
Abstract
Energy supply goes through significant change as production and productivity evolve. When an energy revolution occurs it can drive social development and move society forward
DRC Team Lead of Special Report 1:
Wang Xiaoming from the Research Department of Industrial Economy, DRC of the State Council of China.
Shell Team Lead of Special Report 1:
Nie Shangyou and Professor Wang Yunshi from University of California, Davis, USA.
Contributors:
Guo Jiaofeng from DRC of the State Council of China; Liu Bing and Zhang Wenqiang from Shanghai AILNG Energy Technology Co., Ltd.; Shi Shude from the Research Department of Management and Consulting, State Grid Energy Research Institute Co., Ltd.; Yang Guang from the Energy Research Institute, National Development and Reform Commission; Li Jifeng from the State Information Center, Government of China; Zeng Ming, Wang Yuqing and Long Zhuhan from the North China Electric Power University, Beijing; and Feng Yujia from Tsinghua University, Beijing.
You have full access to this open access chapter, Download chapter PDF
1 Definition Implications of the Energy Revolution
1.1 Elements of the Energy Revolution
1.1.1 Defining the Energy Revolution
Energy supply goes through significant change as production and productivity evolve. When an energy revolution occurs it can drive social development and move society forward.
Scientists and research institutes define energy revolution differently. Here are four examples:
-
“The purpose of a revolution in energy production is to accelerate the transition away from fossil fuels to clean and low-carbon energy, and to accelerate the growth of nuclear energy, renewables and natural gas in the primary energy consumption mix in China.”Footnote 1
-
“The heart of the energy revolution is to improve efficiency and societal benefits. Restrictions limiting environmental impacts should be the red lines for energy development and investment to enable a clean and low-carbon energy economy to thrive.”Footnote 2
-
“The energy revolution makes fundamental changes to the energy mix and energy industry. The excessively high cost of developing and using the predominant types of primary energy, and the mismatch between the benefits they provide and the negative impacts they make, drive innovation and the substitution of new energy carriers for old ones.”Footnote 3
-
“Energy revolution is the evolution of the energy system by society. Unlike social and political revolutions, energy revolution is evolutionary. When the existing energy system can no longer adapt to social and economic change, a new energy system is required to replace it. This triggers transformation in supply and demand, including significant change in energy resources, technologies, management and public perception. The current energy revolution is adopting a scientific approach to energy use and replacing the conventional energy system with one that is efficient, clean, low-carbon and smart to help drive society forward.”Footnote 4
At the 6th meeting of the Central Leading Group for Financial and Economic Affairs in June 2014, President Xi launched his Four Types of Energy Revolution and One Cooperation as the new energy strategy for China’s energy security and development. This strategy requires a revolution in energy demand to curb unreasonable consumption; a revolution in energy supply to develop a diversified supply system of multiple sources; a revolution in energy technology to stimulate innovation and modernisation; a revolution in the energy system to fast-track development; and strengthening international cooperation to guarantee energy security. President Xi made clear that whichever definition is adopted, energy revolution is a combination of energy supply diversification, energy demand changes, energy technology advances, energy system innovations and far-reaching changes in the global energy landscape.
1.1.2 Definition and Elements of the Energy Supply Revolution
China’s energy revolution is a significant attempt to accelerate the energy transition, guarantee national energy security, meet the nation’s demand for energy, improve energy efficiency and combat global climate change. Some researchers have proposedFootnote 5 that this involves optimising the energy mix, reducing the use of coal and coal’s share in primary energy consumption, and developing a modern energy supply system that is efficient, clean, low-carbon and diversified. To understand the elements of the energy revolution, the following three factors need to be taken into consideration:
(1) The energy supply revolution will be a revolution in the true sense of the word
Revolution implies the transition from something old to something new, triggered by fundamental change. There are many factors that may cause an energy revolution, such as technological advances, changes in resource availability, environmental constraints or geopolitical disruptions. In the energy revolution, the old refers to the high-carbon and high-pollution energy supply structure dominated by coal and oil, while the new refers to a low-carbon, clean, diversified, stable and smart energy system. With regard to the objectives of energy revolutions, there are sharp differences between countries. China, for example, has an abundance of coal and a shortage of oil and gas. Despite recent technical advances, the economic feasibility of renewable energy still falls far behind fossil fuels. Therefore, in addition to focusing on renewables in its energy revolution, China also needs to attach great importance to the clean and efficient use of coal.
Energy revolution also implies fundamental change in energy supply. This does not happen overnight, but systematically and gradually in politics, technology, the economy and the environment. It is, therefore, important to weigh the pros and cons of each factor to understand its role in the energy revolution.
(2) The energy supply revolution will lead to major changes in the supply chain
Revolution can optimise the effectiveness and flexibility of supply and increase the share of high-quality energy in the mix to better meet demand and change the way energy is used. Optimisation helps remove obstacles to technological advances and encourages system innovations, driving the energy revolution forward. A revolution in supply is a cornerstone of the broader energy revolution. But it needs to be supported by similar revolutions in consumption, technology, demand and the energy system itself.
(3) The aim of the energy supply revolution is to combat climate change, meet demand and guarantee energy security
The most important role of the energy revolution is to meet the demand for energy and improve people’s quality of life, while combating global climate change. In the transition from high-carbon to low-carbon energy, the energy revolution focuses on the supply of cleaner conventional energy and the development of renewable energy. This will enable energy supply to match demand more effectively and adapt to change more flexibly.
The energy revolution aims for energy security. Close to 70% of China’s energy comes from coal, which makes China the country suffering the most from coal-smoke pollution and the world’s largest greenhouse gas emitter. As a result, China shoulders increasing pressure from the international community to reduce its emissions. As the scramble for oil and gas intensifies, the difficulty of accessing resources in international markets is mounting. China’s oil imports are surging, around 80% of which come from the Middle East and North Africa. Such a high dependency on one region, in combination with a lack of strategic oil reserve capacity, weakens China’s ability to respond to emergencies. A weak emergency response system increases the risk of long-term dependency on international oil resources. The energy revolution must therefore focus on China’s specific conditions and aim to ensure energy security.
1.1.3 Implications of the Energy Revolution for China
At the 6th meeting of the Central Leading Group for Financial and Economic Affairs in 2014, President Xi defined the specific requirements of the energy revolution: to develop a diversified energy supply system; create a diversified domestic supply system to ensure energy security; vigorously promote clean and efficient coal use; focus on more non-coal energy supply sources to develop an energy supply system based on coal, oil and gas, nuclear power and renewable energy; strengthen the power transmission and distribution systems; and build energy storage facilities.
These requirements reflect China’s actual conditions. China has many challenges to address, including excess capacity in fossil energy (mainly coal), insufficient supplies of renewable energy, intense environmental constraints, and severe defects in the energy supply system. Alleviation of excess capacity in the coal sector, optimisation of the energy supply system, and robust development of clean energy are, therefore, high on the energy revolution agenda.
1.2 Characteristics of the Energy Revolution
1.2.1 Key Characteristics
(1) Changes in primary energy
(1) Fossil fuels
Fossil fuels include coal, oil and gas. Coal mining and coal utilisation technologies are relatively mature, but due to high levels of pollution coal’s share of the energy mix will decrease dramatically as the energy revolution moves forward. In the future, clean coal mining technologies will be widely deployed to enable scientific and efficient exploitation, and investments in safety will also increase. This will enable the cost-effective and safe exploitation of coal resources.
China has limited proven resources of conventional oil and gas. There is great potential for unconventional oil and gas in China. However, due to the limitations of technology and other factors, the utilisation rate of unconventional oil and gas remains low. The energy revolution, therefore, needs to shift to more unconventional oil and gas, deep-sea and deep-shale oil and gas resources. It needs to accelerate the exploration and production of shale gas and coalbed methane through technology intensification and innovation, and it needs to promote a low-cost, clean and green energy strategy.
(2) Non-fossil energy
Non-fossil energy includes renewables and nuclear power. The strategy of the energy revolution for renewables is as follows:
-
(1)
hydropower—construct a fleet of hydropower plants, as planned, that comply with stringent environmental protection standards, as the ecologic protection redline should never be crossed;
-
(2)
wind power—develop a wind power control and management system that fulfils the requirements of large-scale grid connection, improve equipment quality, establish a sector-specific mechanism to remove inefficiency, and construct support facilities like energy storage;
-
(3)
solar power—build solar power plants in the north-west desert region of China and grid-connected rooftop solar power in east and central China to ensure the development of complementary solar energy technologies;
-
(4)
bioenergy—increase R&D investment in non-grain biofuels to replace petroleum fuel with liquid biofuels at scale in several industries; and
-
(5)
heating—deploy proven solar, biomass and geothermal energy technologies in heating applications. The pace of solar and wind energy development should match the speed of the energy transition to prevent excessive capacity build-up.
In nuclear, China should increase investment in nuclear power stations in the eastern coastal region, create Chinese nuclear power technology brands and become a global centre for nuclear power plant development and manufacturing.
(2) Changes in secondary energy
(1) Transition from primary to secondary energy
The energy revolution increases the share of electricity (from fossil fuels and renewables) in the energy mix. As electricity’s share increases, and the proportion of non-fossil energy use rises, the power supply system becomes cleaner and more efficient. Power consumption in the service industry and households will increase, while that in manufacturing gradually decreases.
(2) Combination of centralised and distributed energy systems
China has adopted a centralised approach to energy supply and demand, which will remain dominant in China’s energy system for some time. Distributed energy systems provide less power per generating unit and much lower generating efficiency than centralised energy systems. However, their flexibility and environment-friendliness make them an important means of addressing pollution and energy shortage. As such, they are indispensable to the energy revolution and integral to China’s future energy system. An optimal combination of centralised and distributed energy systems would guarantee a stable and efficient supply of energy and optimise China’s energy mix.
1.2.2 Drivers
(1) Less pressure on global energy supply
Growth in global energy demand is slowing down. Influenced by the shale gas revolution in the USA, some Latin American countries are developing their domestic oil and gas resources and have made clear progress to reduce their dependency on imports from other states. This eases the pressure on global supply and demand and encourages countries to diversify their energy supply. As the share of renewable energy grows globally, diversified energy supply will become an irreversible trend.
(2) Opportunities in the energy revolution
At the opening ceremony of the 2018 Summer Davos Forum, Li Keqiang, Premier of China’s State Council, said the Chinese economy is at a crucial stage of transition, from old to new growth drivers. It is faced with structural contradictions and downward pressure in several regions and industries. However, opportunities coexist with challenges. In the energy industry, China continues to implement its Internet + strategy and roll out the Energy Internet which, by integrating the energy industry with digitalisation, boosts innovation and new energy forms and revitalises energy supply. Natural gas, a clean energy carrier, is another of China’s energy priorities. China’s proven gas reserves are increasing rapidly, and exploration of natural gas hydrates has achieved major breakthroughs. As technology and innovation advance, natural gas has great potential to partly replace coal and oil.
(3) Environmental constraints are driving the energy revolution
As Wang Jinnan, Vice Director and Chief Engineer of the Chinese Academy for Environmental Planning points out, China tops the world in terms of emissions of almost all air pollutants, including carbon dioxide. Despite measures to control and prevent pollution, thick haze often hangs over large parts of China. Along with almost 200 other signatories, China ratified the United Nations Framework Convention on Climate Change (UNFCCC) at the 2015 Paris Climate Conference, which took effect in December 2016. Air pollution is inextricably linked to energy supply. In the face of unprecedented pressure, the need to protect the environment forces the energy revolution to accelerate the transition to clean, low-carbon energy.
1.3 Evaluating the Energy Revolution
As energy production transits from coal to low carbon, the latter’s share of the energy mix becomes a key criterion for judging the success of the energy revolution. However, a revolution cannot be achieved overnight. Rather, it is an evolving process that takes place under certain conditions. It is influenced by specific factors and has significant impacts on energy supply in certain geographies. And it can create profound change over time. To decide whether the changes China is experiencing can be considered an energy supply revolution, we look at four countries that have undergone energy revolutions: the UK, France, Japan and Germany.
1.3.1 Energy Revolutions in Four Countries
The UK’s energy revolution started with the discovery of North Sea oil in the 1960s. In 1973, coal made up 84% of the country’s energy production and oil accounted for 44% of total energy consumption. As the production capacity of UK North Sea hydrocarbons expanded, the share of oil and gas in energy production and consumption rose rapidly, while that of coal decreased. By 1983, the UK was one of the world’s top 10 oil producing countries and an important oil and gas exporter across the globe. At a time when overall energy demand was stable, the share of gas in the energy mix increased rapidly in the UK, becoming a major alternative to coal.
Japan’s energy revolution can be clearly divided into three stages based on energy mix share. Stage 1 is changes in the supply of primary energy to the power industry, reflected by a higher share for oil and a smaller share for coal. In 1973, the first oil crisis spurred a transition from oil to gas and nuclear power, which started stage 2 of Japan’s energy revolution. Use of gas in the energy mix grew from 1.6 to 19.2%, and that of nuclear power from 0.6 to 11.8%. Thanks to reduced costs and improvements in equipment efficiency, the use of coal rose from 16.9% to 22.6%. Following the Fukushima nuclear accident in 2011, Japan initiated stage 3 of its energy revolution by phasing out nuclear power.
In France, oil and coal made up a high share of the energy mix before the energy transition. As a result of the first oil shock, Prime Minister Pierre Messmer announced a large nuclear power development programme (the Messmer Plan) in 1974, which included 13 1,000-megawatt nuclear power plants. This not only completely changed France’s electricity sector, it made France a major force in nuclear power and related technologies. Currently, nuclear makes up 75% of total power output in France, which is a substantial contribution to France’s energy self-sufficiency.
Germany passed the Renewable Energy Sources Act in 2000, pioneering the transition from fossil fuels to renewable energy. Coal and nuclear power were the major sources of energy in Germany at that time. According to Stephan Kohler, former head of the German Energy Agency and director of the Center of Sino-German Renewable Energy Partnership, the goal of Germany’s energy transition is mainly to phase out nuclear power and fossil fuels by 2050. After the Fukushima disaster in 2011, the German government decided to shut down nuclear reactors permanently and make wind and solar power the basis of Germany’s future low-carbon energy system. As Stephan Kohler pointed out in 2000, 5% of Germany’s then energy consumption came from renewables, especially hydropower. By the end of 2016, this had risen to 33%, with solar power especially registering explosive growth.
1.3.2 Timelines of the Energy Revolutions
Starting with the discovery of North Sea oil in 1968, the UK’s natural gas revolution can be divided into two stages. In stage 1 from 1968 to 1990, the supply of natural gas grew dramatically. It was used mainly by households and industry, with a very small amount used for power generation. In 1991, a large gas field with sufficient reserves for 15 years was discovered along the North Sea coast, marking the outset of stage 2 of the UK’s energy revolution. The UK government increased the use of natural gas in power generation, which far exceeded that used by industry.
Japan’s energy revolution began in 1960. It is now going through its third energy transition. The first transition, from 1960–73, substituted oil for coal. As a result of the first oil crisis, Japan underwent a second transition, from oil to gas and nuclear power, from 1973–2011, which is the focus of this report. The third transition took place after the Fukushima disaster in 2011, when Japan started to phase out nuclear power.
The first oil crisis also triggered France’s transition to nuclear power from 1974. In June 2017, Nicolas Hulot, French energy and environment minister, announced that the government planned to shut down several nuclear reactors. The move was intended to decrease the share of nuclear power in total power output from 75% to 50%, but the timeline remained unclear.
In 2000, Germany embarked on a transition to renewable energy. In September 2010, the minister responsible for the Federal Ministry for Economic Affairs and Energy announced Germany’s medium- and long-term energy policies and identified the energy transition targets for 2050.
1.3.3 Pathway Options for Energy Revolution
The UK discovered North Sea oil when its domestic energy resources were scarce. The first oil crisis accelerated drilling and exploitation in the North Sea and escalated the use of natural gas. The UK’s energy revolution was therefore driven by resource shock.
During the first oil crisis, oil prices soared and the cost of oil-fired power generation in France and Japan spiralled. High oil consumption and a lack of domestic resources forced the two countries to carry out an energy revolution. France has few oil, coal and gas resources, but relatively abundant uranium ore. France decided to transition to nuclear power, while Japan chose to replace oil with gas and nuclear power.
Germany spearheaded the transition from high-carbon to low-carbon energy to reduce air pollution from fossil fuels and to strengthen energy security. The transition to renewable energy is now a common trend in energy revolutions.
1.4 Pathways to Energy Revolution
1.4.1 Economic Development, Energy Security and Environmental Protection
According to the above analysis of energy revolutions in four countries, the UK, France and Japan sought an energy transition before and after the first oil crisis due to a lack of domestic energy resources. They needed to limit the potential impacts of an energy supply shortage on their economies and energy security. Germany’s energy supply revolution occurred relatively late. In addition to economic development and energy security, Germany also took environmental pollution from fossil fuels into consideration, and eventually decided to point its energy revolution towards renewable energy.
All four energy revolutions targeted economic development, energy security and environmental protection. These same three factors apply to China’s energy revolution as well.
First, economic development is a permanent goal. China has many challenges that need to be urgently addressed, such as overpopulation, large income inequality and regional imbalances in economic development. The energy revolution can satisfy people’s energy demands and create high-tech and low-energy-consumption industries, bringing new employment opportunities. More jobs will reduce income inequality and regional development imbalances, helping to deliver the government’s goal of economic prosperity.
Second, the energy revolution can reduce China’s dependency on other countries for energy and lower potential supply risks, thus improving energy security.
Finally, the severe haze and air pollution challenges facing China are closely related to its underdeveloped energy system. In addition, pressure from the international community on greenhouse gas emissions makes environmental protection another goal of China’s energy revolution.
In recent years, as China’s economic development entered the new normal of lower growth rates, the energy industry also entered a new phase. China’s energy system is shifting from growth in quantity to a phase consistent with the new era of socialism with Chinese characteristics and China’s new normal economy. As new businesses start up, and energy technology innovation and deployment accelerate, the three factors of economic development, energy security and environmental protection become increasingly interdependent.
1.4.2 Scenarios for China’s Energy Revolution
The scenarios for China’s energy revolution are based on the following four factors.
First, in alignment with the government’s Chinese Dream strategy, China’s socioeconomic development scenario forecasts socioeconomic development and energy service demand for 2020, 2030 and 2050.
Second, in accordance with the Energy Supply and Consumption Revolution Strategy (2016–30) to forecast end-use energy demand and to analyse the possible and recommended pathway.
Third, we have conducted research on the impact on the energy supply system in three scenarios (High, Medium and Low) in which electricity and gas replace scattered coal and the Recommended and Limit scenarios in which electric vehicles replace internal combustion engines.
Fourth, we forecast China’s future primary energy supply in the Recommended scenario for its energy revolution pathway.
1.4.3 Outlook for China’s Energy Revolution and Scenario Analysis
China’s future population, floor space growth and trends in major industrial products are analysed to forecast China’s socioeconomic development and energy service demand in 2050. Energy consumption in agriculture, industry and buildings, transport, the service industry and households, is predicted in order to estimate future total end-use energy demand. The scenarios for replacing scattered coal and internal combustion engines are analysed to estimate electricity and natural gas consumption and total energy demand for vehicles in 2050.
A review of China’s socioeconomic development and energy service demand reveals that China’s population will peak by 2030. As the population ages, China’s future workforce will decline in absolute terms. China’s floor space is forecast to peak at about 92 billion cubic metres by 2040. The rapid expansion of the real-estate industry will come to an end, and its ability to stimulate economic growth will weaken. China’s automobile industry maintains strong momentum, but growth is expected to slow after 2030 due to gradual market saturation. Iron and steel output will fall in line with declining annual average floor space, and the steel recycling rate will gradually improve. The nonferrous metal industry will see continuous growth in energy consumption to 2030, and new building materials will gradually replace old ones. By 2030, China will achieve the government’s goal of “common prosperity” and avoid the middle-income trap of developing countries. In 2030, China’s GDP will exceed that of the USA, making it the world’s largest economy. In 2050, China’s economic growth will shift from production-driven to consumption-driven. As industrial restructuring accelerates, China’s GDP will reach and exceed the level of moderately developed countries.
In agriculture, machinery will be powered by electricity, especially by renewables and biofuels, instead of by fuel oil. Use of scattered coal will start to disappear. Energy use in industry and buildings is expected to peak in 2025–30, and then steadily decline. In iron and steel, as the mainstream technologies gradually shift to a more balanced use of long-term and short-term objectives, the use of coal will fall sharply and that of natural gas, electricity and heat increase significantly. In the transport sector, petrol, diesel and kerosene remain dominant, but the rate of replacing them with electricity, natural gas and biofuels will increase significantly. Energy consumption in transport will continue to grow to 2030, then slowly decline. Energy demand in the service industry will increase continuously throughout the period to 2050 and use of coal will decrease rapidly as the service industry modernises and replaces scattered coal with electricity and gas. Household electricity demand will remain steady.
In summary, China’s end-use energy demand will stay at peak level between 2030–50. Specifically, energy demand in agriculture, industry, building construction and transport will peak in 2020, 2025–30 and 2030–40 respectively. In the service and household sectors, peak energy demand will not be reached until 2050.
Three rate of change scenarios (Fast, Medium and Slow) are also analysed for substituting electricity and gas for scattered coal (SEGFSC). For the pathway for the electric vehicle sector, a recommended scenario and an extreme scenario (featuring accelerated development) are analysed, leading to energy demand forecasts for petrol, diesel and electricity.
In the Recommended scenario, the share of electricity in end-use energy demand rises steadily. In the SEGFSC and electric vehicle scenarios total energy consumption will decline, although not significantly, as electricity and gas are more efficient than coal and oil. This will increase demand for electricity and gas, but to a manageable extent. However, a rapid increase in the number of electric vehicles will boost demand for electricity. The power system will therefore require sufficient backup capacity or better demand-side management to meet this uncertainty.
In the Recommended scenario, electricity demand is divided into four segments—peak load and ancillary services, intermediate load, base load and distributed load. Clean power’s share of energy supply will gradually increase, wind and solar will rise rapidly, and nuclear power steadily. Gas-fired power generation’s share will remain around 10% in 2050, while hydropower’s will gradually decrease despite its growing generating capacity.
In the Recommended scenario, China’s total primary energy demand will continue to grow. Coal and oil will peak then decline. The share of non-coal in energy supply is expected to increase to 73% by 2050, whereas oil will rise then gradually fall as the scale of replacing the internal combustion engine with electric vehicles rapidly expands. Meanwhile, clean energy will gradually play a critical role in meeting energy demand. In addition, the rising rate of electrification will increase the share of power generation in energy supply.
1.5 Impacts of the Energy Revolution
The Recommended scenario analyses the impacts of the energy revolution on the following four aspects: energy supply, industry and capacity conversion, investment, and employment.
(1) The energy revolution changes the energy supply system by transforming production and innovating new energy supply technologies to safeguard national energy security. The shift in production from centralised generation to an optimal combination of centralised and distributed energy improves efficiency and encourages the development and use of clean energy. Technology advances are reflected in the development and deployment of the Energy Internet (Internet +). Internet + is a combination of complementary energy sources in an optimised mix of centralised grids and distributed energy networks that is low carbon and intelligent. With support from Energy Internet technologies, demand response becomes a crucial forcing mechanism to accelerate supply-side change and improve energy management. In the Recommended scenario, China’s energy imports will continue to rise in the short term, but as renewable energy and nuclear power advance, China’s dependency on energy imports will fall.
(2) The energy revolution drives change in the energy system and guides development of the energy industry. As coal will continue to dominate China’s short-term energy mix, low-carbon energy and clean coal should be the focus in the near future. The oil and gas sector will concentrate on innovating greener technologies and accelerating the exploitation of unconventional resources. China will make vigorous efforts to drive the development of clean energy. It will invest more in technology innovation to lower costs and improve energy efficiency. Power conversion will be cost-efficient, clean and green. It will replace fossil fuels with clean energy and increase the amount of electricity in end-use consumption.
(3) The energy revolution drives the energy industry to invest in clean energy and the cleaner use of fossil fuels. To deliver the energy strategy of a diversified supply system, the participation of various types of investor is needed.
(4) The energy revolution will make the structural imbalances in the labour market more severe. There will be more job opportunities for highly skilled people, but rising unemployment for those in the conventional energy sector. This applies to those regions and provinces that rely on conventional energy, less so on those developing new energy sectors. It may force some provinces to carry out an energy transition and reduce their dependence on conventional energy. So doing would spur their economy, ease unemployment and make for healthier and more stable development.
2 Precedents and Prospects of International Energy Revolutions
2.1 Energy Companies in Transition—Responses to Future Trends
2.1.1 Introduction
Strategies and organisational structures within the oil and gas industry are the result of historical market conditions that are likely to change over the coming decade. Oil and gas markets have traditionally been characterised by rising demand and prices. This has led companies to focus on megaprojects that require intense coordination. As a result, pyramid organisational structures with multiple levels of oversight have become the industry norm. However, the oil and gas industry faces large structural shifts that can affect its organisational and strategic structures in the future.
Specifically, two trends are likely to trigger change. First, structurally lower oil and gas prices are becoming increasingly likely. This is due to a combination of technology and policy that increases supply and reduces demand. Supply is increasing as horizontal drilling and hydraulic fracturing techniques are diffused and climate policies—together with energy efficiency improvements—curb demand. Second, technology disruptions in energy markets are becoming more likely. Digitalisation and innovations in decarbonisation will increasingly change how energy is produced and consumed, which will ultimately lead to changes in existing markets.
Oil and gas companies have already begun to adjust their strategies and organisational structures. The industry is currently characterised by two strategic themes. First, oil and gas companies, including Equinor, Total and Shell, have begun to invest in renewable energy technologies, such as solar and wind, to diversify their portfolios. Second, companies are shifting their hydrocarbon investments away from conventional mega-ventures towards smaller more flexible projects, such as shale wells, which can be scaled up or down in response to market changes. These strategic changes have been accompanied by organisational adjustments. New, smaller investments are more reliant on trial and error, agile local teams and rapid coordination. Recognising this, oil and gas companies like BP and ExxonMobil, are adopting flatter organisational structures that allow for greater local autonomy.
However, oil and gas companies are at the start of a long journey. It is, therefore, useful to study responses in comparable sectors that have faced similar structural shifts for longer. The postal and power sectors are good examples as they, like oil and gas, are heavily regulated, capital-intensive industries dominated by large state-owned enterprises. Furthermore, they have faced structural shifts similar to those expected in oil and gas. The postal industry has faced falling letter volumes in the past decade and companies in the sector have already adapted their organisational structures and strategies. Likewise, the electric utility sector can be seen as a frontrunner for oil and gas; it has long been challenged by large technology disruptions in the form of increasingly price competitive renewables. These parallels make postal and power companies’ useful cases for exploring future strategic and organisational changes in the oil and gas industry.
The postal and power cases show that company-specific motives and context can lead to different but rational strategic responses to the same structural shift. Some companies, such as United States Postal Service (USPS) and RWE (circa 2004), changed very little in response to structural shifts, while others, such as Deutsche Post and DONG Energy (now Ørsted), transformed or diversified their companies completely. Little strategic change was observed in situations where owners valued security of the existing service and nearer term profits. In the case of USPS and RWE in the early 2000s, their strategy was to harvest the short-term value of legacy assets. In companies, such as the UK’s Royal Mail—where stakeholders valued longer-term profitability but were constrained by regulation, conflicting interests or limited capital—business strategy focused on streamlining and redirecting resources to new capabilities. In cases where owners sought to expand the business, had relevant capabilities and sufficient capital, the strategic shift was more aggressive than for those acting later or facing resistance. As an example, both Deutsche Post and DONG Energy moved early and used rents from legacy activities to finance their strategic transformation to international logistics and offshore wind respectively. In contrast, late movers such as RWE and Innogy SE suffered from capital constraints, which slowed their strategic transition.
Organisational change needs to align with the adopted strategies and business models. In all our cases, companies started out with relatively hierarchical, top-down organisational structures. Where the strategic focus remained on the traditional business model, as with USPS and RWE, organisational change was limited to making the prevailing structure more effective. Where new business growth was the main priority, all companies first ensured some separation between new and old—this gave the new business sufficient autonomy to grow. Where new businesses had similar underlying characteristics to the traditional business, as with Royal Mail and DONG Energy, organisational change focused on reorienting the existing structure and flattening the hierarchy, but not on a radical shift to a horizontal structure. In contrast, radically new product or service models involved far-reaching organisational change. As Deutsche Post transformed from a German mail delivery firm to an international logistics company it also changed its organisational model. Notably, it shifted focus from production to consumers and organised itself around a series of relatively autonomous divisions supported by cross-cutting service divisions. Innogy’s split from RWE in 2016 resulted in a more radical turn towards business unit autonomy focused on customers, allowing a more agile shift in investment across units based on results.
Motive and context will likely determine how Chinese oil and gas companies respond to lower prices and new technology disruptions. Drawing on the postal and power cases, four archetypes of potential strategy response arise:
-
Supply security focused harvesters: These companies ensure supply security or near-term employment, and harvest value from legacy assets during the transition period. However, as was the case with USPS, they face the risk of shrinking considerably as the market changes around them.
-
Constrained niche growers: These companies have aspirations for growth, but regulation or capital constraints prevent them from moving beyond conventional oil and gas business areas. They focus on streamlining their core functions and growing within niche markets such as chemicals.
-
Dividing conquerors: Acknowledging the potential for misaligned internal incentives, these companies split into two with one focused on harvesting value from legacy hydrocarbon assets to deliver near-term supply security, dividends or employment, and the other focused on delivering long-term growth by developing new technologies or wider energy sector diversification.
-
Transformative diversifiers: In contrast to the above, these companies move quickly to a new energy service model, catalysing change and gradually selling off their least profitable legacy assets to finance the transition. They have the potential to deliver long-term growth but are riskier; supply security, employment and profitability outcomes are uncertain.
The different archetypes for oil and gas company strategy will be accompanied by several organisational considerations. Supply security focused harvesters will likely maintain a top-down approach with central control of big decisions. In contrast, constrained growers will have to enable agile decentralised units to efficiently capture niche markets. Their central functions will be focused on portfolio optimisation, as well as asset management and organisational efficiency. Companies that face significant internal cannibalisation between old and new business units will likely become dividing conquerors. Like Royal Mail and DONG Energy, these companies will strategically and operationally split, but could be managed as a conglomerate that carries over existing organisational strengths. Finally, transformative diversifiers will likely adopt more horizontal organisations structured around energy services rather than production. Like Deutsche Post, their organisations will likely be flatter with a series of relatively autonomous units supported by service divisions that leverage synergies across the group.
Motive and context are not set in stone but controlled by stakeholders, and the Chinese government can therefore shape strategic and organisational outcomes in its oil and gas industry. As the owner of national oil companies, the Chinese government can shift the motive driving strategic and organisational change. Supply security requirements could be lifted by reducing fixed reserve targets; incentives to maintain unproductive workers could be minimised by reducing local political oversight; and near-term profitability motives could be eased by adopting longer-term key performance indicators for managers. Furthermore, as a regulator and key stakeholder, the Chinese government influences the context in which oil and gas companies will respond to structurally lower prices and technology disruptions. For example, capacity development could be supported through public-private R&D schemes, regulatory constraints could be reduced by lifting natural monopolies, and capital limitations could be minimised by providing policy clarity (this would allow rents from legacy assets to be channelled sooner towards financing new investments). An important lesson from both the postal and power sectors is that the government is key in setting the conditions that determine strategic and organisational change. Policymakers who recognise this will be able to directly or indirectly shape the future of the Chinese oil and gas industry.
2.1.2 Future Trends in the Oil and Gas Industry
The oil and gas sector faces new trends that could induce change in business strategy and companies’ organisational structure. Trends have always arisen to create new challenges and opportunities in the oil and gas sector, as the discovery of new resources, technologies and political shocks have changed the fundamental characteristics of the market. For example, the emergence of powerful state-owned oil companies in the 1960s and 1970s forced many international oil companies to transform their business models to focus on megaprojects in hard-to-reach places. The future appears to hold even more substantial changes due to advances in technology and decarbonisation, which have already begun to affect energy markets and will become more prevalent over time. Oil and gas companies are already considering changing their strategies and organisational models in response to these trends and will need to continue to do so in the future.
This report focuses on the two main trends facing the oil and gas sector: (1) structurally lower oil and gas prices, and (2) an increasing set of disruptive technologies. The trend of structurally lower prices reduces margins and makes high-cost supply uncompetitive. It is already occurring, as new shale resources continue to increase supply, and is likely to strengthen as decarbonisation policies reduce fossil fuel use. Several technology disruptions are also impacting the sector, including those driven by digitalisation and increasing low-carbon R&D flows. These can rapidly shift value within the energy sector, which will require oil and gas companies to be more versatile if they are to capitalise on opportunities in areas of new value and avoid risks in areas of declining value. This report examines the broad impact of these shifts in business strategies, and the implications for future organisational change within oil and gas companies (Fig. 1).

Structural shifts will alter the business strategies and organisational structure of oil and gas companies
Companies will need to understand the implications of these trends and how to respond best to them in order to thrive. It is possible to draw parallels between the trends facing the oil and gas industry today and the trends that other sectors have already experienced and responded to. This report aims to use the learnings from cross-sectoral responses to better understand the possible set of strategic and organisational responses of oil and gas companies to structurally lower prices and increased technology disruption, as well as the factors that will affect those responses.
(1) Current strategies
Current strategies and organisational structures within the oil and gas industry have been shaped by historical market conditions. The main strategy employed in recent years has been the development and management of megaprojects with large volumes of recoverable resources: in 2005, 60% of oil production was from giant fields of more than 0.5 billion barrels of recoverable resources. This focus on quantity has been driven by the historical trends of growing demand and generally increasing, if fluctuating, prices, as seen in Fig. 2. Given these trends, replacement ratios have been of key importance for oil and gas companies, which have focused on accumulating reserves and been less concerned about the cost of extracting those reserves.

Note Giant fields are defined as having more than 0.5 billion barrels of recoverable resources. Source International Energy Agency, BP, Robelius (2007)
Megaprojects, and the pyramid organisational structure that facilitates them, have been motivated by historical trends.
Effectively deploying large, complex projects requires extensive coordination that has encouraged pyramid organisational structures with multiple layers of oversight. These megaprojects are technologically demanding and usually involve complex multiparty relationships, as well as high commercial and environmental risk. Given these features, a pyramid structure that allows for strong oversight is required to ensure all aspects of the project are under control and that coordination between them is achieved.
(2) Structurally lower prices
Rising supply from unconventional sources and plateauing demand make it likely that prices will remain lower for longer. Recent advances in drilling technology, such as hydraulic fracturing and horizontal drilling, have made new oil and gas resources available. This has shifted the global supply curve outwards, putting downward pressure on prices, and is likely to continue as these technologies are deployed globally.
The economic logic for this is described in Fig. 3, where a shift out of the supply curve and a contraction of the demand curve can lead to significantly reduced producer surplus, illustrated by the difference in size between the original red area of producer surplus and the new blue area. This is accentuated by the steepness of the global oil and gas supply curve at the higher levels of quantity—this means that a small fall in demand can cause the price and surplus to fall rapidly.

Source Vivid Economics
The trends of the oil and gas industry will likely result in significantly tighter margins for producers.
There have already been sharp falls in oil and gas prices in recent years, demonstrating the potential for structurally lower prices. The trend is already in place. Oil prices have been consistently around $50 per barrel since 2015, as US oil shale resources have contributed to a supply glut that has driven down prices to pre-2005 levels. The overall impact of this on oil and gas companies can be seen in their share price during and after the final quarter of 2014 in Fig. 4. The average share price of five major oil and gas companies fell by more than 30% from 2014 to the trough in 2016 and has yet to recover.

Source BP, Google Finance
The fall of oil prices in late 2014 coincided with sharp drops in the share price of major oil companies.
New, relatively low-cost supply sources are becoming increasingly available as technology improves, driving production above predicted levels. New technologies have reversed persistent declines in production and have exceeded historical expectations, as illustrated in Fig. 5. The U.S. Energy Information Administration (EIA) forecasts for oil production in both the 2002 and 2012 Annual Energy Outlook did not fully anticipate the impact that new fracking methods would have on increasing tight oil supply, as conventional oil production has continued to diminish. The result has been a near doubling of oil production from its trough in 2008 to its peak in 2015.

Note Total US oil production includes conventional and tight oil. Source EIA (2017)
New tight oil sources have pushed total US oil production to heights that exceeded forecasts.
The low-carbon transition will reduce demand for fossil fuels in favour of low-carbon alternatives over time. Decarbonisation has been an increasingly important priority in energy in recent years and now has widespread support, as demonstrated by the signing of the Paris Agreement in 2015. As a result, policies are in place globally to phase out fossil fuels and promote low-carbon energy sources. Figure 6 shows potential pathways for primary oil and gas demand in two EIA scenarios: a reference scenario that reflects the world’s announced decarbonisation policies and a 2-degree scenario (2DS), which assumes additional policies to limit global warming to 2°C. In the reference scenario, demand for oil and gas rises, but if additional policies are put in place to limit global warming to 2°C as intended, then demand for both oil and gas is expected to fall sharply in the future. This reduction in oil and gas demand due to decarbonisation will likely reduce prices, and so contribute to structurally lower prices.

Source IEA Energy Technology Perspectives 2017
Primary demand for oil and gas falls sharply under the IEA’s 2-degree scenario (2DS), presenting a challenge to the oil and gas sector.
In a future of structurally lower prices, the decision of whether to divest or diversify into new areas will gain greater importance. Oil and gas companies face the risk of lower margins in their main areas of operation. As a result, there may be value in pursuing strategies such as divesting or diversifying to attempt to maintain profits in the future. The potential strategy options and the factors that induce different types of responses are discussed in Sect. 2.1.3.
(3) Disruptive technologies
Disruptive technologies are shifting the sources of value in energy markets, driven by digitalisation and decarbonisation. Digitalisation is the automatic collection of large quantities of data and the application of computing power to the data to enable better decision-making. Its use in other (non-energy) sectors has driven rapid advances. Collecting big data with remote sensors is already prevalent in the oil and gas industry, and there is enormous potential for digitalisation in other areas of the energy system through smart technology that enables dynamic, autonomous energy systems. Decarbonisation policies have increased R&D spending (01.2.7) and raised market expectations about the long-term value of new innovation across various parts of the energy system. This has resulted in major advances, including those related to power generation (like wind and solar), oil and gas exploitation (floating liquefied natural gas and advanced seismic analysis for oil and gas exploration), and energy demand (electric vehicles and smart homes with demand-side response).
This has created opportunities and risks for the oil and gas sector. The impact of these technologies, whether marginal or revolutionary, will have repercussions on oil and gas companies. For example, sensors on drills are collecting masses of high-quality real-time geological data that allow for more cost-effective extraction. Smart grids can better coordinate decentralised variable generation and minimise curtailment rates—this makes renewables more productive and reduces the need for fossil fuel peaking plants to balance the energy system. And reductions in carbon capture and storage (CCS) costs could make the large-scale use of gas in power and industry low carbon (Fig. 7).

Source OECD
R&D is shifting towards new areas, increasing the potential for disruptive technologies to emerge.
(4) Initial responses
Oil and gas companies have started to adjust their strategies, shifting towards smaller-sized projects and investing in renewables. Structurally lower prices and technology disruption have already begun to appear and affect the oil and gas industry, driving initial responses. Some major companies have begun to integrate renewables into their portfolio to gain presence in a market that is rapidly growing, thanks to widespread policy incentives and improving renewable technologies—both Equinor and Total have made recent renewable energy investments. There has also been a shift away from the historical focus on megaprojects, as shown in Fig. 8. Investment in smaller fields has been consistently higher since 2009 and is expected to continue into the near future as flexible shale projects and lower extraction costs become increasingly prominent in a future of lower prices.

Source Rystad Energy, Bloomberg (2017)
Investment in smaller projects has been greater than investment in megaprojects since 2009.
These changes in strategy have also led to organisational adjustments—this has been prominent as companies have implemented more shale projects. Successful shale projects rely on a very different approach to that of megaprojects. Shale projects are smaller and far less complex but require trial and error and multiple iterations to be successful. This is more suited to a flatter organisational structure with agile, local teams and rapid coordination between business development and exploration divisions. Given this, large companies have tended to separate their shale operations into autonomous subsidiaries to preserve the flatter structure that makes them successful, rather than integrate them. This is just one example, but the expectation is that oil and gas companies will be faced with scenarios of a similar nature and possibly on a larger scale.
2.1.3 Case Studies of Responses in Other Sectors
(1) Introduction
The prevailing structural shifts that are facing oil and gas are not unique—other sectors have already experienced and responded to similar transitions. The postal sector has faced structurally lower demand since the early 2000s due to steadily declining letter volumes. Letters have historically been a major source of value, and their decline has had a severe impact on the financial performance of postal companies. Power generation utilities have faced disruptive technologies in the form of ever-cheaper renewable generation backed by favourable policies, impacting the profitability and longevity of their traditional assets.
Figure 9 shows the perspective we are taking for the case study analysis: structural shifts can lead to changes in business strategy, which then motivate change in organisational structure. The trends of lower prices and increasing technology disruptions have caused fundamental structural shifts in the postal and power utility sectors. Companies have employed a range of business strategies to respond to these trends and subsequently have often had to adjust their organisational structure to facilitate their new strategies. We analyse the response of each company at specific points in time to better understand the factors influencing their adoption of different strategies in response to similar sector-wide trends.

Source Vivid Economics
We study archetypical responses in comparable sectors to understand how oil and gas might change.
These cases provide examples of how the oil and gas industry can respond to trends, and what the outcomes of different responses may be. Studying other sectors that have experienced similar price and technology trends can help to guide the future strategy and organisational decisions of oil and gas companies. It provides an understanding of the potential consequences from different types of responses and the factors that motivate these responses, particularly when there is no clear dominant strategy for adapting to these structural shifts (Fig. 10).

Source Vivid Economics
Structural shifts lead to changes in business strategy, which in turn lead to changes in organisational structure—but the exact changes depend on motive and context.
(2) Motive and context framing
The cases show that company-specific motives and context can lead to a range of different but rational responses to the same structural shift. Companies can rationally have different strategy responses to the same trend if they face different decision factors, namely the motive of the owners and context of the company. For example, even if two companies have the same motives and overarching goals, the different regulatory environments each faces may force them to choose different strategies in response to a trend. The motive of a company is derived from the owners and broadly encompasses the desire to maintain service and employment security, the time preferences of cash flows (the weight placed on profit today versus profit in the future) and whether the risk preferences of the company are suitable to encourage expansion into new areas of value. The context of a company is the operational conditions that affect its ability to implement different strategies—this includes the regulation it faces, internal or external capital constraints, and the potential synergies between current business areas and future ventures.
We have analysed the different responses of three companies in each sector. Understanding the motive and context allows for the outcomes of each company’s response to be understood holistically and deeper parallels to be drawn to the potential future responses of the oil and gas industry.
Two companies demonstrate a relatively minimal response, with a continued focus on improving their current business through the existing organisational model. USPS, protected by a monopoly on letters but banned from entering new non-postal markets, represents the minimal response or “hold firm” approach to industry-wide trends, both in terms of business strategy and organisational structure. RWE is the parallel example in the utilities sector, preserving a focus on its traditional assets rather than on integrating renewables.
Our four other cases all chose to split their old from their new businesses organisationally, although in different ways. Both the UK’s Royal Mail and Innogy were legally split from larger companies to help them reorient their business; Deutsche Post split its businesses organisationally but did not divest; while DONG Energy separated its businesses and then divested old business units.
Two companies pursued business strategies that led to a deep shift towards flatter, less hierarchical organisations. Innogy was separated from RWE in 2016 to focus on new energy markets and has taken measures to increase the autonomy of its business units (based on target customers) and enable more agile investment and divestment in rapidly changing markets. Deutsche Post was privatised in 2000; it then diversified from its former core business, both geographically and in terms of products offered. To support this, it took an organisational shift towards decentralised and autonomous divisions.
Two other companies pursued quite different business strategies, with both seeking to change their organisations, yet without radically changing their organisational structure. Royal Mail was unbundled and privatised in 2013 to increase focus on competitive mail and parcel services; and it took a range of measures to de-layer the organisation, reduce operational costs and reorient its corporate culture and processes towards customer service. DONG Energy is an even more extreme example of business strategy change, completely divesting its oil and gas exploration assets to focus on offshore wind generation. While this was accompanied by various changes in organisational culture and responsibilities, it has not (yet) resulted in the degree of diversification and decentralisation seen in Innogy and Deutsche Post.
Table 1 illustrates the role that motive and context plays and the general response archetypes that each of our cases falls into. In response to structural shifts, companies within the same sector and facing the same shifts have chosen alternative strategies, due in part to their differing motives and context. This has led to a range of outcomes and organisational shifts—oil and gas companies facing their own unique motives and context can learn from these cases to better guide their future responses.
(3) Lessons from the case studies—the postal sector
(1) United States Postal Service (USPS)
The US government’s priority was for USPS to provide service security. This motive, combined with legislation that constrained USPS to its existing core business areas, meant the business strategy and hierarchical structure remained unchanged in response to declining letter volumes.
-
Context: The Postal Accountability and Enhancement Act of 2006 was passed after USPS posted several years of strong earnings. This act prevented diversification into non-postal areas due to potential cross-subsidisation, with monopoly earnings leading to unfair competition and market distortion. However, the timing of this act was unfortunate, as mail volumes began to decline from 2006 onwards.
-
Motive: The motive of preserving service security subsequently led to Congress vetoing cost-cutting measures, such as ending Saturday deliveries and closing the least busy post offices, despite the obvious cost savings. Workers’ benefits have also been given high priority over profitability, as evidenced by the $51.8 billion USPS has had to spend to prefund pensions for its future workforce. The price of postage is also regulated and is lower than all the major European postal companies, placing further pressure on USPS’s margins.
-
Strategy response: Combined, the above factors have resulted in USPS not adopting a clear strategic response to structurally lower letter volumes. USPS has remained in its core business areas, with falling letter volumes and strong competition in parcels continuing to place pressure on margins. Basic cost-cutting measures, such as reducing headcount, have been implemented, but have not been sufficient to offset the declining value in core businesses. However, supply security has been maintained and the price of postage remains low.
-
Organisational structure: USPS has remained a government-controlled and regulated monopoly with a top-down hierarchical structure. This multi-layered structure provides strong oversight of operations and drives uniform operational improvement, creating high levels of efficiency (USPS has half the workers per unit of mail compared with Deutsche Post), albeit within a declining market (Fig. 11).
Fig. 11 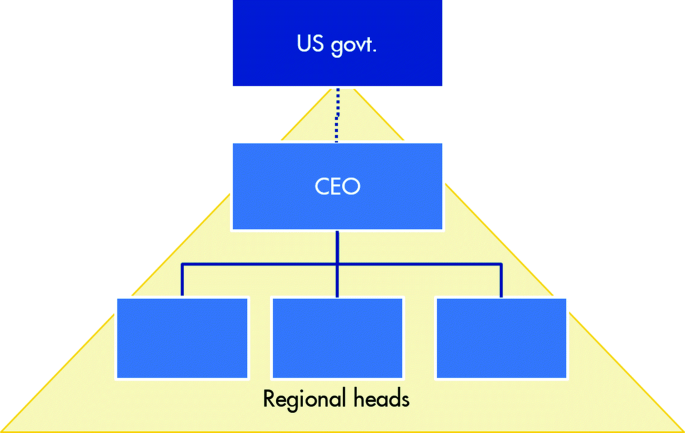
Source Vivid Economics
USPS remained under government control with a top-down regional structure that helped promote efficiency in a large operation.

(2) Royal Mail
The UK government’s motive in 2011 was returning Royal Mail, which was balance sheet insolvent in 2011, to profitability. This involved the separation and privatisation of the postal service from the postal infrastructure of Royal Mail, which allowed for cost-cutting, delayering and a customer-orientated service culture that returned the postal service to profitability. Growth beyond its core areas has been limited by capital constraints, although Royal Mail has been exploring other markets.
-
Motive: The UK government was focused on returning Royal Mail to profitability after four years of pre-tax losses from 2008–11 that made it a growing liability for the government. Royal Mail has had to contend with declining letter volumes since 2004, the loss of its monopoly in letters in 2006 and, more recently, intense competition in parcels from other European postal operators.
-
Context: Four consecutive years of losses created internal capital constraints that were exacerbated by the stigma of using public funds for investment. As a government-owned company, Royal Mail was bound by strict regulation that made it difficult to renegotiate contracts or alter services. It maintained a universal service obligation that further limited its ability to diversify from its core letters business. It also had a pension plan that accrued large liabilities during the financial crisis of 2008, which contributed to making the firm insolvent.
-
Strategy response: The response was the separation and privatisation of the postal service from the post offices, which remained under public ownership. The government had to take up the pension liabilities of Royal Mail to make its balance sheet solvent and enable privatisation. This enabled Royal Mail to reorient its core business, focusing solely on the service delivered to customers and implementing intense cost-cutting measures that resulted in the closure of a third of mail processing centres and a 10% reduction in headcount after privatisation. These measures were successful in returning the core business areas to profitability, despite minimal revenue growth from 2011 to 2017. However, Royal Mail has not yet been able to significantly diversify, and cost-cutting is unlikely to be a long-term strategy for generating profits. Royal Mail has begun to invest in other geographies and logistic services. These investments have been small due to the constraints of its low capital reserves and dependence on external financing, which prevent large-scale acquisitions of the like Deutsche Post made in the early 2000s.
-
Organisational structure: The separation of the postal service and infrastructure arms allowed for more distinct business models to be implemented. By the Post Office arm remaining in public hands, Royal Mail ensured it could act as network infrastructure for all postal companies, preventing wasted investment and the potential formation of a natural monopoly. The new, service-focused Royal Mail was able to take advantage of its less stringent regulatory environment to implement targeted cost-cutting and investment. To assist in this, Royal Mail brought in a CEO, with significant experience of the public-private transition, to reform the regulatory context and ultimately make the company more profitable (Fig. 12).
Fig. 12 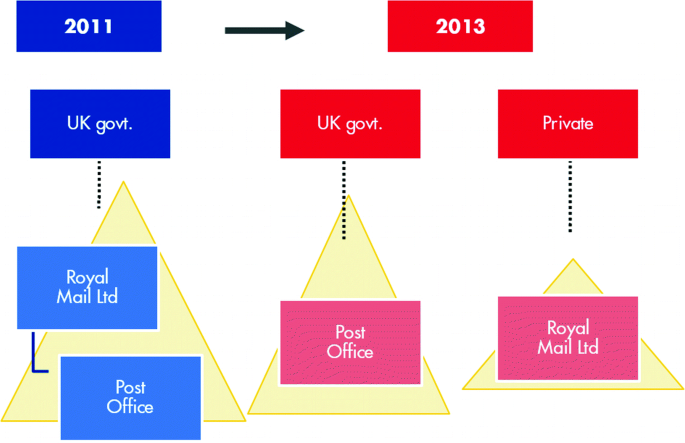
Source Vivid Economics
Royal Mail was separated from the Post Office and privatised to facilitate intense cost-cutting.

(3) Deutsche Post
Deutsche Post began a large programme of acquisitions to diversify its business after it became clear that its domestic market would be threatened by changing legislation. It benefited from favourable timing and had significant cash flows from its traditional business areas, allowing it to finance its acquisitions internally. It also created divisions with a customer focus and increased divisional autonomy, while demonstrating organisational flexibility to maximise synergies across its increasingly broad areas of business.
-
Motive: EU directives led to Germany passing new laws to promote greater competition in its domestic postal market in 1997, making Germany the leader in postal market liberalisation in Europe. At the time, domestic post accounted for more than 75% of Deutsche Post’s revenues. Hence, Deutsche Post was motivated to expand into new value areas, both geographically and within logistic services, to preserve profits as domestic competition inevitably increased.
-
Context: Deutsche Post benefited from favourable timing. Its transition was motivated by legislation, rather than by declining letter volumes. Consequently, it still had the large internal cash flows needed to undertake large acquisitions. Its privatisation in 2001 also afforded it the freedom to undertake radical strategies.
-
Strategic response: Deutsche Post made several large acquisitions that transformed it into a major global logistics company. It made smaller acquisitions in the late 1990s (Danzas and Air Express International) before acquiring DHL and Excel in 2002 and 2005 respectively for more than €8 billion following its privatisation in 2001. DHL had expertise in international express delivery and a developed postal network across the USA and Europe, while Excel made Deutsche Post a major player in supply-side logistics. However, such an extreme strategy comes with inherent risks, as evidenced by Deutsche Post discontinuing its domestic express service in the USA and incurring $3.9 billion in restructuring costs as a result in 2009.
-
Organisational structure: Deutsche Post has demonstrated flexibility in its organisational structure as it has sought to increase the autonomy and customer responsiveness of its divisions. Similar divisions in new acquisitions were combined to create more efficient networks, and a shift from a three-tier to a two-tier management structure allowed for greater responsiveness to consumer demands. Deutsche Post also formed cross-cutting service divisions to maximise synergies across its new business areas, and a global services unit was introduced in 2006 to provide support across all divisions (Fig. 13 and Table 2).
Fig. 13 
Source Vivid Economics
Deutsche Post imposed a flatter organisational structure and central service divisions to maximise synergies.
Table 2 There have been diverging responses among utility companies in response to a similar trend

(4) Lessons from the case studies—the utilities sector
(1) RWE
RWE had a large stock of lignite, coal and nuclear assets in 2004 that were low cost, delivered high returns and provided employment in key shareholder municipalities. Despite new legislation introduced in 2004 promoting renewables, RWE held firm and planned to increase its lignite generation capacity. Hence, RWE kept a centralised organisational structure that could better focus on managing these concentrated, large-scale assets.
-
Motive: In 2004, renewable capacity in Germany was noteworthy, but seemed unlikely to displace the extremely low-cost baseload power provided by lignite and nuclear generation, which had high returns. In addition, German municipalities owned 24% of RWE and relied on the local employment from lignite and coal assets. The employment from lignite generation was also a political tool, leading many politicians to support its use and protect its role in the German energy system, which further disincentivised RWE from diversifying into other technologies.
-
Context: RWE had already invested in improving and expanding its traditional asset base, locking capital into assets with long lifespans. RWE’s previous status as a regional monopoly also fostered a culture of inaction and risk aversion. This was further accentuated by RWE’s history of large cashflows and dividends that investors were not prepared to compromise.
-
Strategic response: RWE did not make any significant additions to its renewable capacity from 2004-10, instead it continued to focus on its legacy assets. In 2004, RWE considered Germany to be “at the beginning of a long-term investment cycle” and the plan was to replace old power stations with more efficient versions, rather than branch off into alternative generation methods. In its 2004 annual report, RWE mentioned the new renewable energy legislation solely in terms of the monetary burden it would place on the company, rather than the opportunities it offered. Consequently, in 2005 RWE announced plans to spend €3.5 billion on two projects to install 3.6 GW of new, optimised lignite generation capacity, which were among the largest projects ever planned in RWE’s history. However, as renewable energy capacity increases at unprecedented rates, RWE has been forced to adopt a harvester mentality, with the aim to derive as much value as possible from its large legacy asset base that will be gradually phased out of Germany’s power system.
-
Organisational structure: RWE maintained the centralised management structure that oversaw its conglomerate of business areas. For its traditional large-scale assets, this allowed for efficient management, but it constrained the autonomy, flexibility and organisational development of its new energy areas and made investment and growth more difficult.
(2) Innogy
Innogy was separated from, but still majority-owned by, RWE in 2016. It contained the green assets of RWE, as well as the network and retail businesses. The motivation for this change was for Innogy to be able to pursue growth opportunities in renewables and other markets without being constrained by the growing liabilities of RWE’s legacy assets or conflicts of interest. By splitting from RWE, Innogy was free to attract fresh investment and implement an organisational structure focused on energy services to better serve its new markets.
-
Motive: Innogy was split from RWE in order to chase growth opportunities. RWE as a whole struggled to come to grips with the changes it was facing and lacked flexibility due to the capital it had invested in its legacy assets.
-
Context: German renewable energy policy had motivated an unprecedented uptake of renewables that has completely altered the state of the energy system—it was clear that the future trend in Germany was one of mass renewable energy generation. In addition, the Fukushima nuclear incident in 2011 resulted in a moratorium on nuclear generation and even greater support for renewable power as a clean alternative.
-
Strategic response: Innogy has marketed itself as a highly innovative company and is pursuing renewable energy opportunities internationally. It is attracting financing as a longer-term investment, which would not have happened if it were still bundled with the legacy assets of RWE, which represent more of a short- to medium-term investment.
-
Organisational structure: Innogy was separated as a partially owned subsidiary of RWE. This removed any association it previously had with the declining legacy asset base of RWE, although 75% of the shares remain in RWE’s hands. Separation afforded Innogy the freedom to pursue its new energy service strategy and reorient the organisation accordingly. Innogy restructured itself in accordance with the different levels of the energy value chain to align with the demands of the end consumer rather than those of production. It also gave units a greater degree of autonomy (flattening the organisational hierarchy), while also pursuing a portfolio approach, whereby investment across those units could be ramped up or down depending on their relative success (Fig. 14).
Fig. 14 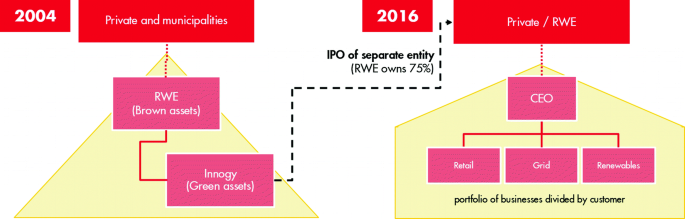
Source Vivid Economics
Once Innogy was separated from RWE it adopted a consumer-focused structure, aligning its divisions with areas of the value chain.

(3) DONG Energy
DONG Energy (now Ørsted) is majority-owned by the Danish government. The company was motivated to pursue offshore wind technology as a reliable source of domestic clean energy to offset declining profits in conventional generation and also develop a new potential growth market.
DONG Energy’s expertise in offshore oil and gas exploration and its experience in pilot offshore wind farms made it ideally placed to aggressively shift its business focus from oil and gas to offshore wind. The company had to change its organisational structure to accommodate this new business area: offshore wind was first added as a division under the CEO to develop, before later becoming the main focus of the company.
-
Motive: Denmark has ample offshore wind reserves and has long promoted wind power with strong domestic subsidies. Declining electricity prices in the Nord Pool power market and fluctuating demand levels reduced thermal generation earnings, making the subsidies and secured earnings from wind generation more appealing.
-
Context: DONG Energy had the necessary skills to drive the development of the offshore wind market. Its offshore oil and gas expertise was easily transferrable and it gained significant experience developing offshore wind farms from its merger with Elsam in 2006, mitigating the risks and barriers to investment.
-
Strategic response: DONG Energy managed to completely transform its main area of focus from oil and gas production to offshore wind generation. Having already completed several medium-sized pilot projects in Denmark in the early 2000s, DONG Energy began seeking out larger opportunities that resulted in an agreement with Siemens in 2009 to buy 1.8 GW of wind turbines. The sheer size of this deal enabled economies of scale to develop in production and deployment and it marked the start of DONG Energy’s commitment to pioneering offshore wind technology. Since 2009 DONG Energy has been involved in the largest offshore wind farms in Denmark (Anholt, 400 MW) and globally (London Array, 640 MW) and has won the bid to deliver the world’s first offshore wind farm of more than 1 GW (Hornsea Project One, 1.2 GW).
-
Organisational structure: Offshore wind was formed as a special division under the CEO to prevent conflict of interest with other areas and to ensure that targets were set appropriately for a developing business area. At the same time, DONG Energy was able to use the existing organisational structures and capabilities from its oil and gas exploration business—scouting, construction and asset management—which were well suited for offshore wind projects. As the wind division expanded and traditional assets were divested, a more consolidated organisational structure emerged with a focus on the growth of the green businesses and an integrated approach to sharing functional expertise. The result (so far) has been a greater emphasis on the benefits of integration and focus, rather than autonomy and diversification (Fig. 15).
Fig. 15 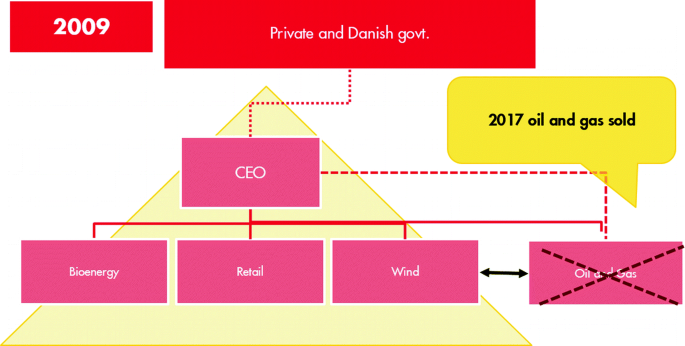
Source Vivid Economics
DONG Energy reframed its organisational structure and applied it to offshore wind.

2.1.4 Conclusions and Implications for China
The oil and gas sector is facing structurally lower prices and more technology disruptions, which could challenge the long-standing business strategy and traditional, hierarchical organisational structure of companies.
Case studies from the postal and electric utility sectors show that companies may respond in different ways, depending on their motivation (the outcomes valued most by stakeholders) and context (the operational conditions that may constrain a company’s strategic margin of manoeuvre).
-
Little change remains an option—where stakeholders valued security of existing services and nearer-term profits, business strategy focused on harvesting the value of the existing business model, and organisational change was about making the existing structure leaner (USPS).
-
Splitting the old from the new—where stakeholders valued longer-term profitability but were constrained by regulation, conflicting interests or capital (Royal Mail, RWE in 2004 and DONG Energy), business strategy focused on streamlining and redirecting resources to new capabilities, and organisational change focused first on splitting the old from the new.
-
Transforming with the trend—where companies seeking new opportunities had relevant capabilities and sufficient capital (Deutsche Post, DONG Energy, and Innogy after 2016), and the strategic shift was more aggressive than for those acting later or facing resistance (Royal Mail and RWE in 2004).
Organisational change needs to align with the business model. Where new businesses were similar to old (Royal Mail and DONG Energy), the organisational change is more about refreshing the existing structure than radically restructuring it; while entirely new product or service models (Deutsche Post and Innogy) involved far-reaching change.
Governments can have a role to play in shaping the motives and context of companies to help guide outcomes, and they should consider what types of response current policies are encouraging. Through setting the conditions that influence strategic and organisational change, governments can determine the future role of the oil and gas industry. Current policies are setting the motive and context of companies that will encourage a particular response that may not be in line with the government’s aims. Consideration should be given to how motives and context impact future responses and what the options are for a government to influence these factors.
(1) Response archetypes for oil and gas companies
There is no dominant or common response strategy to the prevailing future trends—the motivations and context behind each company will determine what types of strategic and organisational response they adopt. Figure 16 illustrates the generic range of motivation and context that oil and gas companies may potentially face. How a company responds to these factors will require the appropriate archetype of strategy response, which in turn will involve a different type of organisational structure.

Source Vivid Economics
Motive and context will determine how Chinese oil and gas companies strategically respond to lower prices and new technology disruptions.
When there is a focus on security and binding constraints exist, legacy assets are often maintained and harvested and their declining role in a changing market is accepted. Companies in this position will need to maintain their legacy assets to meet supply security or short-term employment targets but are unable to diversify given the restricting context that surrounds them. In such a situation their best response may be to take on a harvest mentality, using their legacy assets as much as possible during the transition, but with the knowledge that the value of these assets will be greatly diminished over time as the market changes. This strategy is facilitated by maintaining a top-down approach to keep central control, which is more efficient when dealing with a small number of high-value legacy assets. Central functions that aid asset management and organisational efficiency would also be useful to maximise the rents from harvesting.
This strategy is effectively what RWE and USPS employed, although they did so to a lesser extent. RWE has maintained its large capacity of lignite and nuclear generation and is earning what it can from those assets, while maintaining its hierarchical structure. USPS is not showing obvious indications of harvesting value, but the company is clearly bound by a service security commitment that is preventing it from adopting other responses.
When a similar focus on security exists but within a less stringent context, a company has the option to separate in order to provide the desired service security and seek growth opportunities elsewhere. When security and short-term gains are the priority, some continued use of legacy assets is unavoidable, as diversifying into new ventures will not immediately fulfil either of the two objectives. However, when the prevailing context is less restrictive companies should consider employing a divide and conquer strategy, separating themselves into two distinct parts, where one delivers the near-term supply security, dividends or employment targets and the other is free to pursue diversification for long-term growth, unhindered by the needs of the existing legacy assets. Organisationally, this requires a clear split between the two different parts of the company. Care must be taken to carry over any existing organisational strengths into the appropriate areas of the business.
Innogy was separated from RWE for these reasons. Although it became clear by 2011 that both lignite and nuclear generation were declining in relevance, RWE maintained them to preserve short-term cash flows and to try and recoup as much of its sunk investment in these assets as possible. Innogy was created as a separate subsidiary that was not burdened with any legacy assets and was free to innovate and invest in growing renewable markets.
A binding context can prevent a company from moving away from its traditional assets, even when the primary motivation is for long-term growth—in such scenarios, a focus on efficiency in core areas and expansion in niche markets is a sensible response. When regulatory or capital constraints are tight, companies may not be able to divest their legacy assets or effectively invest in new areas. To drive growth in this scenario, companies can focus on streamlining their core functions to maximise efficiency and squeeze up margins. Alternatively, they can aim to develop within smaller niche markets where lower capital investments may still be sufficient to generate decent returns. This type of strategy is implemented by forming agile, decentralised market units that can respond quickly to the unique and often changing circumstances of different niche markets and ensure that the core business stays as relevant and lean as possible. Portfolio optimisation is also an important step to ensure that all business areas are aligned, and central functions are implemented effectively.
Royal Mail found itself in this situation in 2013. It was limited by tight capital constraints after several years of losses and was seeking to generate long-term profit and growth. It began a programme of intense cost-cutting that returned the company to profitability despite little revenue growth, and it started to make small investments in other logistic areas and geographies to gain a foothold in potentially long-term growth markets.
If the motivation is for long-term growth and the context is non-restrictive, a transformative strategy can be adopted, although this comes with higher risk. When long-term growth is the primary motivation, investment into new areas becomes a priority as legacy assets will shrink considerably as structurally lower prices and greater technology disruptions set in. Companies facing this situation may seek to diversify aggressively and shift to new markets or incorporate new technologies. However, such extreme change comes with inherent risk, which makes the outcomes for supply security, employment and profitability uncertain. To adopt such a strategy effectively, companies should develop an organisational structure that is flatter and has more divisional autonomy to facilitate fast response to the needs of different business areas. It is also important to strengthen core capabilities across the group to maximise synergies wherever possible, especially if elements of the current business can provide a competitive advantage in new areas (Fig. 17).

Source Vivid Economics
Motive and context are not set in stone but controlled by stakeholders—the Chinese government can therefore shape outcomes.
Both Deutsche Post and DONG Energy are examples of companies that have undergone extreme transformations to preserve long-term profits. Deutsche Post used its large internal cash flows to invest heavily in other logistic areas and was flexible with its organisational structure to maximise synergies across its rapidly expanding business areas. DONG Energy transformed its core business from oil and gas to offshore wind. It was incentivised by consistent wind subsidies and implemented divisional autonomy for its offshore wind division to insulate it from competition from other divisions within the company, setting growth rather than profit targets until it reached maturity.
(2) Options for adjustment
Governments can play a role in shaping the future responses of companies by adjusting the motives and context through policy setting. Although strategy and organisational response choices are decentralised and made at the corporate level, there is potential for governments to intervene and guide the direction of future responses by setting the conditions that influence those responses. This can be done by setting different targets for government-owned companies or it can be implemented broadly with policy that affects all companies. These adjustments will be important to guide the oil and gas industry towards the role that the government envisages for it in the future, as structurally lower prices and increasing technology disruptions begin to take hold in the industry.
Government-owned oil and gas companies may be limited in their future response to prevailing trends by the current goals set for them. The government has a clear, direct role in setting the motive for companies that are under government control and should be aware that some types of future response will not come about without the correct motivation. For example, a national oil company cannot transform its business model and shift into renewables, as DONG Energy has, if it is bound by an obligation to deliver fixed reserve targets. USPS was clearly limited in its ability to respond to the structurally lower demand it was facing by the government’s (its owners) singular focus on service security. Similarly, employment goals and short-term profitability targets encourage continued use of legacy assets and will prevent large-scale diversification. This is an issue that affected RWE—employment and dividend requirements meant RWE prioritised its legacy assets over investment in new areas.
There is also the potential to collectively adjust the context across all companies by altering pertinent policies. As a regulator, the government can influence the context that all companies face. Public funding or R&D that supports new technologies or new capacity development can reduce the uncertainties that companies face when trying to enter new business areas. The Danish government’s strong wind subsidies were key in encouraging DONG Energy to pursue offshore wind at a time when thermal generation earnings were volatile. Removing natural monopolies by allowing greater access to infrastructure networks can help companies to refocus on their core businesses. When Royal Mail was partly privatised in 2013, the Post Office arm was separated into an independent entity with a management structure centred on the postal service the company provided. Early policy clarity is the key to providing the robust signals needed for companies to optimally plan their longer-term strategy and organisational responses. Deutsche Post benefited from this level of clarity, as it was able to diversify into new markets and geographies before its domestic market declined, when it still had significant cash flows to invest. In contrast, Innogy, the green asset subsidiary of RWE, was separated from RWE in 2016, well after the German renewable energy revolution had cut into the earnings of RWE’s legacy assets. The rapid escalation of renewable energy policies in Germany prevented a clear policy signal from forming, contributing to RWE’s continued use of legacy assets and subsequent losses.
Appendix 1: Postal Companies: Responding to Lower for Longer Trends
Introduction
Since the early 2000s, the postal industry has faced two global trends: a decline in letter volumes from the spread of electronic communications; and a parallel, but smaller, increase in parcel volumes due to the rise in e-commerce. Combined, these two trends yield a fall in total volume of 1–2% per year, and global revenue growth of only 1.6%, significantly below the economy-wide average of 4.3% revenue growth. The effect on postal companies has clear parallels with oil and gas companies facing lower for longer hydrocarbon prices. Major postal companies have been hit particularly hard by the decline in letters, historically their main source of revenue and over which they had a monopoly—they were often state-owned and seen as delivering an essential service. Postal companies have revenues of the same magnitude as oil and gas companies.
On top of these two global trends, some countries have experienced deregulation and rising competition, while others have remained closer to a regulated monopoly. Beginning in 1997, the European Commission has abolished national monopolies on mail in Europe. EU member states were required to allow competitors to enter their national postal services, at first only in certain product categories (such as parcels) and by 2012 across the full spectrum of postal services. In contrast, the USA allowed competition in parcels and express letters, but the United States Postal Service (USPS) continues to hold a legal monopoly on standard mail.
Postal companies have had a range of responses to the challenge of declining value in their main area of business—understanding the factors that led to these can help oil and gas companies plan their own transitions. The individual decision factors and circumstances facing each postal company dictated the way in which they responded to the lower for longer trend of falling letter volumes. Broadly speaking, the responses to lower for longer can be organised into three categories:
-
(1)
Inaction: No organisational changes or divestments, with cost-cutting and efficiency improvements limited to a few areas due to restrictive legislation.
-
(2)
Divestment and cost-cutting: Large efficiency gains from divesting inefficient, non-core areas and fully utilising cost-cutting opportunities. This has often been achieved through privatisation or reorganisation by separating mail operations from other parts of the business (such as pensions and post office operations).
-
(3)
Diversification: In addition to separating certain parts of the business from core operations, companies can diversify into new geographies and new lines of business.
We have analysed the responses of three companies, each of which represents a different category of response. USPS, protected by a continuing monopoly on letters but prohibited from entering new non-postal markets and with limited cost-cutting options, represents the minimal response or inaction to industry-wide trends. Royal Mail, unbundled and privatised in 2013, has enacted a wide range of cost-cutting and modernisation measures that have significantly improved its recent financial performance. Deutsche Post, privatised in 2000, has taken similar steps as Royal Mail, but has gone faster and further, diversifying from its former core business, both geographically and in product offering, and growing substantially as a result.
The parallels with the oil and gas industry, both in terms of the lower for longer trend faced and the scale of the companies themselves, make the postal sector a good case study for oil and gas. Both have two core products with different outlooks: one that is facing challenges because of long-term falling demand (oil/letters) and another that is experiencing rising demand (gas/parcels). In addition, both industries have faced, or are facing, large regulatory change: deregulation and competition in the case of post and increasing climate change policy in oil and gas.
The large postal companies were similar to oil and gas companies: they were often nationalised, delivered an essential service and had huge revenues. The high capital and large economies of scale in both sectors mean that small falls in volumes can make large impacts on profitability. These similarities make the postal sector a good learning case for oil and gas companies.
USPS: An example of inaction
USPS has been facing a steady decline in the volume of first-class mail since 2001 and mail overall since 2006. Figure 18 shows the volume of first-class mail, which is the main source of revenue for USPS, peaked in 2001 and has been falling ever since. In contrast, overall mail volumes tended to rise until 2006, after which they fell sharply. The parcel market is dominated by multinational companies, like FedEx and UPS, that were quick to innovate and capture profitable delivery routes, leaving USPS with only an 8% share of the sector’s main growth market.

Source Vivid Economics
Total mail volume did not begin to fall consistently until after 2006, although first-class mail volumes have been falling since 2001.
From 2002–06, total mail volumes were rising and USPS posted a cumulative profit of $8.6 billion. Given the very small falls in first-class mail volumes from 2002–06 and the fact that total mail volumes continued to rise to 2006, it is unsurprising that USPS posted strong financial results pre-2006. Its average annual profit during those years was $1.7 billion, more than double that of the late 1990s, which averaged $726 million per year from 1997–99.
Since 2006, USPS has been forced into inaction, as legislation and Congress have prevented cost-cutting and diversification in response to mounting losses. The 2006 Postal Accountability and Enhancement Act was intended to modernise postal regulation that had been in place since 1971, reassessing the pricing of postal services and setting clearer barriers to entry for USPS in non-postal services. Given USPS’s monopoly over non-express letters and its strong profits pre-2006, the concern was that USPS might use its monopoly profits from letters to unfairly subsidise its entry into new areas. Congress wants USPS to maintain a universal service and has continually blocked cost-cutting measures like stopping Saturday deliveries. Once the lower for longer trend set in after 2007, USPS had limited responses and had accumulated losses of $10.6 billion by 2016.
In 2006, letter volumes had yet to fall appreciably and with USPS posting profits in four consecutive years, there were over-optimistic expectations about the future of letter volumes and the payoff from inaction. The timing of the 2006 Postal Accountability and Enhancement Act was unfortunate in that it preceded the onset of falling letter volumes. It seems apparent that in 2006 expectations for the potential severity of the lower for longer trend were not accurately formed. This led to an overestimation of the potential payoff from adopting a strategy of inaction. The historical evidence suggested a mild lower for longer trend at the time (later forecasts in 2009 have proved more accurate in predicting letter volume falls). There was, therefore, little motivation to shift to a new strategy.
After the 2006 Postal Act, diversification was effectively no longer open to USPS—a prohibition that was criticised by USPS’s management—limiting its strategy response options to either inaction or divestment.
The US government promises a universal service and responds strictly towards any action that may disrupt or threaten it. The government places a high value on security of service and benefits to employees, both of which contribute to USPS adopting a strategy of inaction. This resulted in Congress vetoing many cost-cutting measures, forcing USPS towards inaction by default. The large postal infrastructure system that USPS operates requires economies of scale to be efficient—small falls in volume can quickly reduce margins and create large losses.
Once the lower for longer trend had taken hold after 2006, USPS had to accept its limited ability to respond strategically. Given the restrictions placed on it entering new non-postal services and the heavy competition it faces from other companies that specialise in parcel and express delivery, USPS has been limited to cutting costs and making efficiency improvements that address the decline of its main market.
Some cost-saving measures were implemented, mainly by reducing head count, although mandatory pre-payments of pension and security benefits for workers added huge liabilities. From 2006–14, the number of full-time employees at USPS fell by 30%, as it pursued efficiency gains to offset the sharp fall in letter volumes. However, these gains are small in comparison to pension pre-funding payments of more than $5 billion per year that USPS was forced to make between 2007 and 2016. While other postal companies have often had their pension obligations split off to make them solvent, USPS has had to bear the full cost. Once the pre-funding payments are separated from expenses, slight but persistent falls in operating expenses since 2007 are visible, despite a growing number of delivery points.
Other cost-cutting and divestment measures have been prevented by Congress to avoid potential disruptions to the universal service. USPS has pushed to stop Saturday deliveries since 2009, but Congress has vetoed it, most recently in 2013. Similarly, Congress vetoed a plan to close the 3,600 least busy post offices in 2012. There is also tight regulation around the pricing of letters, which closes another potential avenue to boost falling revenues. A price decrease of 5% was implemented in 2016, cutting deeper into margins already squeezed.
The result of this has been large cumulative losses by USPS over the past decade: $10.6 billion in total from 2007–16, excluding pension pre-funding payments. The case of USPS shows that if mandatory rules prevent a government agency from adjusting to long-term declines in its core markets, large losses are likely to accumulate. Figure 19 shows that expenses could not be reduced due to the restrictions on cost-cutting options and the large losses that resulted. In addition, USPS is prevented from seizing possible growth opportunities—by regulations, financial constraints and culture. However, social objectives (such as preserving a post office in nearly every town) and past commitments (such as the pension and healthcare benefits of postal workers) were honoured.

Note The profit/loss figures here exclude the security pre-payment obligations of USPS; all figures separate over 2012 and 2011 the double pre-payment made in 2012. Source Vivid Economics
USPS has suffered huge losses and depressed profits since 2006, illustrating the dangers of inaction.
The clear parallel between USPS’s experience and the oil and gas sector is the potential desire to maintain security, which can lead to large losses if it prevents a company from responding to trends. It is not difficult to envisage a nationalised oil and gas company being unable to reduce or diversify away from fossil fuel production in order to maintain domestic energy security, just as USPS was forced into inaction partly by the political desire to protect the USA’s universal postal service. If a government objective like energy security or universal service is the goal, then policymakers should be aware that there is a significant possibility of the company accumulating loss, as new trends can rapidly change the market.
If energy security is a high priority, it is prudent to review policies regularly to account for shifting trends. Enacting policy that creates barriers to change is risky and possibly highly damaging for the companies affected. A balance needs to be reached by having policy that is strict enough to achieve an appropriate level of security, but which has the flexibility to allow the company to respond to trends when the negative effects become overwhelming.
Inaction may be an appropriate strategy in the short run, but change is likely to be required over the longer term; introducing independent scenario teams can help identify when a change in strategy is needed. Scenario teams that are not under the jurisdiction of any specific business unit can offer unbiased guidance of when inaction may no longer be appropriate. Given the structurally lower prices that are gradually taking hold, an alternative strategy to inaction will need to be considered in the longer term. Correctly timing this strategic shift will lead to better outcomes.
Royal Mail: An example of a divestment/cost-cutting strategy
The UK’s Royal Mail was struggling with operational inefficiencies, declining letter volumes and poor financial results before its part-privatisation in 2013. UK letter volumes peaked in 2004 after steady growth since 1990. The initial decline was modest but gathered pace after 2007. Letters delivered fell by about 5% per year from 2007–15. In 2007–08, Royal Mail had the lowest operating margin of the 13 major western European postal companies and posted pre-tax losses each year from 2008–12. At the same time, the UK postal market was opened to competition from January 2006, causing a steady decline in Royal Mail’s market share. Lastly, in the wake of the financial crisis of 2008, Royal Mail became balance sheet insolvent, as the asset value of its pension fund declined, with balance sheet net liabilities of more than £3 billion in 2011 (Fig. 20).

Source Vivid Economics
Royal Mail letter volumes peaked in 2004, but experienced sharp falls after 2007.
The British government decided to privatise the service arm of Royal Mail in 2011. This led to strong cost-cutting initiatives but limited diversification. The legislation that allowed for private control of Royal Mail was passed in 2011, with privatisation starting in 2013. Following privatisation, Royal Mail returned to profit in 2017 after five consecutive years of pre-tax losses, mainly driven by efficiency gains in its core domestic delivery service (profits rose without major increases in total revenue). Some diversification into international markets and vertically upwards into e-commerce has occurred, but these have been relatively minor compared to the strategies of other companies.
The positive examples of postal service privatisation in other European countries and clear financial struggles of Royal Mail since 2008 motivated a similar privatisation in the UK. By 2011, the decline in letter volumes had become a clear trend and the poor performance of Royal Mail showed that continued inaction would not be sustainable. Earlier examples of privatisation across Europe illustrated how postal companies could reform their operations and return to profit while maintaining service obligations. Hence, the expectations were that the payoff from inaction would be low due to the continued decline in letters and inefficiencies, while the payoff from divestment or diversification would be high given the evidence from similar strategies across Europe.
However, as a government-controlled corporation, Royal Mail was subject to tight regulations that created high barriers to change and prevented action pre-2013. Being under government control meant Royal Mail could not renegotiate contracts, access private capital, adjust its products or enter new markets without time-consuming approval processes. Consequently, even with expectations of high payoffs from divestment and diversification, Royal Mail was not able to respond in an effective manner to its declining financial performance, resulting in several consecutive years of pre-tax losses before 2013. Privatisation offered an easy avenue to reduce transformation costs and allow for new strategies to be adopted.
While the British government considers a universal service important, it has far more lenient price controls on postage than the USA. Post-privatisation, Royal Mail was still designated as the universal service provider, obligated to provide a nationwide service for a uniform price, six days a week. This designation meant that a strong focus was still needed on the core service of delivering letters, leading to a degree of aversion to change. Large diversification strategies inherently carried a great deal of risk and could disrupt this core business. Hence, the Royal Mail’s preferences pushed it more towards cost-cutting strategies than diversification into new markets.
The British government split the historic post office into three parts in 2013 and only privatised the postal service arm, leaving the network of post offices under public ownership. These three parts were the letter and parcel service operations of Royal Mail, which were subsequently privatised in 2013; the network of post offices, which remains in public hands; and the net liabilities of the Royal Mail Pension Plan that were taken over by the government to make Royal Mail solvent again. In effect, the government bore a one-time cost to enable privatisation and reduce transformation costs. This unbundling was implemented to allow the post offices to be used by different postal service providers and avoid wasted spending on infrastructure.
Following privatisation in 2013, Royal Mail’s financial situation improved dramatically, mainly through divestment in its core business area. While revenue growth was modest, with a compound annual growth rate of 1% between 2011 and 2017, profit levels increased substantially, suggesting the focus was on efficiency gains rather than entry into new areas. Between 2011 and 2016, Royal Mail achieved an overall headcount reduction of 9.7% and reduced the number of its mail processing centres from 57 to 38. This greatly improved the profitability of its core domestic letters and parcels business, reversing an operating loss of £120 million in 2011 to an operating profit of £411 million in 2017.
Although effective in the short run, this divestment strategy is unlikely to offer a long-term solution for generating profit growth. The short-term impacts of divestment have clearly been significant, reversing Royal Mail from losses into profit as seen in Fig. 21, mainly due to improvements in the core business. However, the future performance of this business is in doubt, as letter volumes continue their lower for longer trend (they are forecast to decline 4–6% annually). In addition, fierce competition from foreign operators in the parcel market has led to a 20% overcapacity, which prevents Royal Mail from staking a large claim in the main growth market. As efficiency gains are exhausted, further profit growth will likely have to come from parcels—where profit growth has been unimpressive so far—or diversification, which Royal Mail has only pursed at small scale and is losing ground to more aggressive competitors.

Source Vivid Economics
Privatisation in 2013 led to a return to profitability, despite a continuous decline in letter volumes.
Royal Mail has begun to move vertically into e-commerce and logistics but is being outpaced by movement the other way, which is likely to increase pressure on margins. Royal Mail (like Deutsche Post and France’s La Poste) is moving vertically up the value chain towards website development, digital marketing and parcel collection points. For now, Royal Mail appears to be progressing exclusively through mergers and acquisitions; no major organisational reshuffle—such as the creation of a new board position or business unit—has been announced. The deal volumes of its e-commerce-related acquisitions have not been disclosed, nor have revenue forecasts been given by Royal Mail, but it is estimated they will add only £100 million in revenue over the next two years. Amazon has started to build an in-house delivery network, expanding its operations from e-commerce to the underlying parcels and logistics business which, by comparison, reported revenues of £1.5 billion in 2016.
Royal Mail has acquired foreign postal operators to diversify into new international markets, but again these have been small. In the USA, it acquired Postal Express for $13 million in 2017 and Golden State Overnight for $90 million in 2016. In Europe, Royal Mail acquired ASM Transporte Urgente of Spain for €71 million in 2016. By comparison, Deutsche Post’s acquisition of DHL in 2002 for around €2 billion and Exel for €5.6 billion in 2005 are of a different magnitude. Part of the reason for these smaller acquisitions by Royal Mail was capital limitations. There are benefits from taking a more measured, modular approach that does not require large-scale strategic and organisational shifts: the risk and costs are much lower. This is evidenced by the $3.9 billion in restructuring costs arising from Deutsche Post’s expansion into the US market, followed by an exit from domestic US deliveries. But the reality is that a strong presence in new markets requires strong investment that Royal Mail is currently not delivering.
The government effectively paid a one-off fee to allow Royal Mail to break out of constraining monopoly regulation, which was crucial for Royal Mail to become profitable again. With its high transformation costs before privatisation, Royal Mail was unable to pursue any strategy other than inaction, despite expectations of a continuing lower for longer trend and a high payoff from divestment or diversification. By taking on the pension liabilities of Royal Mail, the government made privatisation possible, which proved to be net beneficial. For oil and gas in China, this could take the form of divesting network infrastructure (as a precondition to becoming a private company) and accessing private capital markets for growth opportunities.
With the right regulatory environment and leadership, stabilising the core business and maintaining service security is possible without major top-level organisational change. Except for the separation of the post office arm and the government taking on the pension liabilities, Royal Mail’s turnaround has been achieved without making major changes to its organisational structure. However, as mentioned above, this turnaround was concentrated in Royal Mail’s core business, and the company’s long-term growth prospects are not yet certain.
Deutsche Post: An example of a transformative strategy
Deutsche Post’s diversification strategy into global markets and logistic services began in the late 1990s, predating any fall in mail volumes. The decline of mail volumes in Germany began later than in both the USA and the UK, peaking in 2008 and falling only by 13% by 2015. In comparison, the falls in mail volumes in the USA and the UK from their respective peaks were 38% and 42% respectively (Fig. 22). By the time mail volumes began to fall appreciably, Deutsche Post was already well diversified into different geographies and markets—hence, lower for longer had a minimal overall impact on the revenue and earnings of Deutsche Post.

Source Vivid Economics
The decline in Germany’s postal market began in 2008, later than in the USA and the UK.
Since 2001, Deutsche Post has completed several large acquisitions and achieved consistently high profits, despite falls in domestic mail volumes. These large acquisitions include DHL in 2002 and Exel in 2005, although a global diversification strategy with smaller acquisitions has been implemented since 1998. As a result, Deutsche Post has taken early positions in growing markets and developed expertise, which has led to strong revenue growth (68% from 2001–15) from a wide range of ventures and little noticeable impact from lower letter volumes, as seen in Fig. 23.

Source Vivid Economics
Since the early 2000s, Deutsche Post’s revenue has come from several areas; total revenue has not been appreciably reduced by declining domestic letter volumes.
Deutsche Post’s motivation for diversification was triggered by the European Union postal reforms of 1997, which aimed to increase competition in domestic mail. The EU directives led to Germany passing new laws to guarantee postal service quality and promote greater competition in 1997, making Germany the forerunner in postal market liberalisation in Europe. This set expectations of a declining future share of the domestic postal market, which in 1997 represented more than 75% of Deutsche Post’s revenues. The chosen response was to diversify into a global logistics company offering a full range of services—the payoffs from such a strategy were expected to be high given the rapidly growing courier, express and parcel markets in Europe and abroad, as well as the desire of business customers to have a one-stop shop for all logistics services.
Large cash flows and privatisation allowed diversification activities to occur with minimal internal barriers. Deutsche Post began to diversify well before lower for longer began to impact margins—the profit from its mail operations was around €2 billion in 2000. This allowed Deutsche Post to pursue diversification from internal financing rather than having to raise capital externally. Privatisation further facilitated this by streamlining decision-making, allowing much faster acquisitions. Systematic restructuring of the company in 1989, and again following German reunification up to 1997, provided valuable experience in assimilating and accommodating new assets.
Germany has had more flexible regulations for universal service provision than the USA and the UK, which has minimised the external barriers to diversification for Deutsche Post. Although Deutsche Post has historically had a universal service obligation, as well as some exclusive rights, since 2008 the market has been fully liberalised, and Germany no longer formally designates one company to provide that universal service. Without this pressure, Deutsche Post has been free to continue exploring international markets and create new products, while willingly providing a universal service on business grounds.
Deutsche Post’s path to privatisation in the 1990s was motivated by losses caused by an inefficient organisation and EU directives, rather than as a response to falling mail volumes. Before 1989, a state-controlled company, Deutsche Bundepost, was in control of all postal and telecommunications services. This company adopted the bureaucratic structure of its governing bodies that was inappropriate for a market-oriented company, leading to complex processes, no bookkeeping and no coherent strategy for marketing and sales. The result was heavy losses, with a deficit of €320 million in 1990 alone. The first round of postal reform in 1989 separated the different services and restructured them into corporate organisations, quickly reversing their fortunes. When EU directives on opening up postal markets to competition were released, Germany scheduled the privatisation of Deutsche Post, which began in 2000.
Deutsche Post stated its aim to become a globalised logistics company in 1997, as it became clear domestic markets would be exposed to increasing competition. The 1997 Postal Act laid out the regulations to induce greater competition in the German postal market. One of the main policies of this act was the removal by 2002 (later extended by six years in 2001) of Deutsche Post’s exclusive licences on some postal products. Consequently, Deutsche Post began its globalisation strategy to become “the number-one global player”, not only to escape a tightening domestic market, but also to access the rapidly growing express, courier and parcel markets in Europe and globally. This transition began with some smaller acquisitions and new international services, but large acquisitions did not occur until after privatisation in 2001.
Following privatisation, Deutsche Post launched an intensive programme of diversification through acquisitions and the divestment of non-core activities. Privatisation afforded Deutsche Post the freedom to use its strong internal cash flows to pursue larger acquisitions. DHL, a US express logistics company, was acquired in 2002 for €2.4 billion, just a year after Deutsche Post’s privatisation; Exel, a UK-based logistics company, was acquired for €5.6 billion in 2005. These gave Deutsche Post an immediate foothold in new markets, transforming it from a mail-centred company into a global, full-spectrum logistics provider. Deutsche Post also made more than €8 billion from divestments in 2004-10, mainly from the sale of Postbank, raising funds for further acquisitions.
In more recent years Deutsche Post has focused on innovation, establishing innovation forums and creating a dedicated innovation unit within DHL. In 2010, Deutsche Post released E-Postbrief (E-mail letter) as a digital alternative to physical letters, although its popularity is hard to determine as usage figures have yet to be released. More recent innovations include drone deliveries, which are completing a third round of testing, electric postal delivery vehicles and a real-time supply chain management system. DHL Innovation Centers act as forums to encourage collaboration between customers and partners to develop new products and services.
Deutsche Post has made a remarkable transition that has allowed it to weather the decline in its previous core product (domestic letters) and is now positioned as a global leader in growing logistics markets. However, this strategy of rapid diversification is not without drawbacks; moving so rapidly into new ventures can lead to heavy losses. However, this should be accepted as a risk of such bold strategies. Deutsche Post discontinued its domestic express offering in the USA and incurred $3.9 billion in restructuring costs as a result in 2009.
2.2 Electricity Grids in Transition
2.2.1 China’s Network Arrangements
(1) Overview
China’s current network arrangements provide grid access to 100% of its vast and widely dispersed population. In 1990, 89% of the population had access to electricity; by 2014, 100% were connected. In the same period, electricity consumption per person increased eightfold, from 511 kilowatt-hours (kWh) to 4,047 kWh per person, which is half of the average OECD electricity consumption of 8,004 kWh per person. This vast increase in electricity access and consumption has been delivered through one of the largest and most reliable electricity networks in the world.
China has abundant energy reserves, such as hydropower and coal, to serve its rapidly growing electricity demand, but these lie far from large demand centres. The geographically uneven distribution of energy resources and demand centres limits the flexibility of the system to respond to imbalances in supply and demand. It also requires considerable investment in long-distance transmission networks.
The Chinese transmission system is organised on administrative lines and composed of provincial networks, with limited regional and national integration. Detailed planning, investment and operation are primarily coordinated at the provincial level, with a smaller degree of coordination at the level of the national network. The institutional framework of the Chinese electricity sector is complex, as shown in Fig. 24.

Note SASAC = State-owned Assets Supervision and Administration Commission; MEP = Ministry of Environmental Protection; NDRC = National Development and Reform Council; SAWS = State Administration of Work Safety; NEA = National Energy Association
The institutional framework of the Chinese electricity sector comprises several organisations with overlapping responsibilities.
Network planning follows a top-down process. The National Development and Reform Commission (NDRC) specifies general network investment in five-year planning cycles, after which provincial governments and local NDRC branches finalise these plans for their administrative territory. The State Grid Corporation of China, the state-owned electric utility, invests in interconnectors between regions, while the regional grid companies invest in interconnectors between provinces. Provincial grid companies focus on the bulk transmission network within their provinces. Subsidiaries of grid companies at the prefectural and county levels are responsible for distribution networks.
Electricity pricing follows a similar top-down process. The regulatory bodies set the wholesale and retail prices of electricity, which can then be amended by provincial governments to achieve policy and economic development goals.
China explores alternative approaches for restructuring and marketisation of its electricity sector. In 2014, the NDRC launched a pilot project in Shenzhen to accumulate experience for wider adoption of performance-based regulation in China. The pilot project aimed to incentivise grid companies to decrease their costs. It determined permitted costs and profits of grid companies and capped their total revenue. Following the success of the pilot project in Shenzhen, the NDRC decided to expand the reform step by step to other provinces and then nationwide.
(2) Performance of Chinese network arrangements
China’s current network arrangements have delivered a large and stable grid with high levels of energy access, but the grid is fragmented geographically and has highly centralised management. As Chinese regulatory bodies are not independent, planning and pricing decisions at the central and local levels may be influenced by political objectives. The top-down planning approach and lack of coordination with provincial and regional grid companies may lead to inefficient investment decisions and poor coordination between generation and transmission investments. Such investment patterns create pockets of generation where electricity supply is abundant, but an inability to transmit to areas where it is scarce, due to limited transmission capacity. As a result, while China has significant renewable generation capacity, such as solar and wind, large volumes of renewable energy are curtailed, increasing overall electricity costs and carbon emissions.
The transition to a low-carbon and decentralised electricity system is likely to worsen these inefficiencies and create new challenges. As the Chinese economy and energy sector decentralise, it will be increasingly difficult to maintain the electricity grid’s high level of reliability at an affordable cost. Moreover, decentralisation of electricity resources requires significant investment in smart capabilities and creates challenges for the efficient planning and delivery of infrastructure across different networks.
Therefore, China may benefit from reforms to network arrangements, as have many other countries that have adopted international best practice for efficient network provision.
2.2.2 Key Principles of Efficient Network Provision
In order to realise the economic benefits of liberalised electricity markets, international best practice suggests a set of principles for efficient network provision:
(1) Proceed towards full liberalisation of the wider electricity system
Effective investment in, and operation of, the wider electricity system is a precondition for efficient electricity supply. This requires liberalisation of sectors suitable for competition (fuel production, generation, retail), use of markets to procure key services (capacity, balancing), and the pricing of externalities, such as air pollution and carbon emissions.
(2) Align incentives with public policy objectives
Make the incentives of network providers consistent with the provision of a reliable and affordable supply of electricity by controlling the monopoly behaviour of network companies and ensuring that prices reflect underlying costs:
-
Reform electricity network institutions. Electricity networks are natural monopolies, with little scope for improvement through competitive markets. It is therefore critical that their incentives are aligned with public policy objectives. A monopoly faces incentives to underinvest in new infrastructure and to charge prices that are higher than its costs. A state-owned company may face incentives to prioritise short-term political objectives, rather than longer-term public policy objectives. These incentives can be mitigated through institutional reform of the electricity network. One option is to reform the network company’s incentives through performance-based regulation enforced by an independent regulator. Another is to separate network operation and ownership through the creation of an independent system operator (ISO). The UK and most European countries currently use performance-based regulation, while the USA uses the ISO model across its transmission systems, for example, PJM Interconnection (the transmission system in north-eastern USA).
-
Consider the use of locational pricing. Efficient network investment and operation make use of information on network congestion. If implemented, locational (nodal or zonal) pricing can help reveal the costs of network congestion. Nodal pricing is used in several US states, Argentina, Chile, Ireland, New Zealand, Russia and Singapore, while zonal pricing has been adopted by most European countries and Australia. However, locational pricing has disadvantages as well as advantages. Importantly, locational pricing is most effective once time-of-use pricing is fully implemented across network users.
(3) Take further action to meet the challenges of a decarbonised system
The electrification of energy demand and improvements in the efficiency of electrical appliances will make the future volume and demand for transmission capacity more uncertain. Flexible resources such as electricity storage and demand response can substitute for new network investment, as long as sufficient investment incentives are present:
-
Designate strategic zones for transmission-scale renewable generation to reduce planning and investment uncertainty. Renewable energy resources may be located far from demand centres and thus require large-scale transmission investment. Uncertainty over the volume and location of generation can be mitigated through zoning.
-
Ensure there are revenues available to encourage providers of flexible resources to offer a full range of system services. The flexible resources needed for decarbonisation contribute several system services, such as balancing and frequency response, but there may be underinvestment if markets do not exist for these services. Several electricity markets in western China run demand curtailment markets, allowing flexible resources to generate revenues.
(4) Prepare for the development of a decentralised electricity system, and its associated digitalisation
By investing in the coordination of decentralised resources, their control, balancing, security and data flows:
-
Coordinate investment in decentralised resources. A coordination problem arises when independent developers that lack information about the plans of other developers make similar investments, creating overinvestment or, if the developers are risk averse, underinvestment. Either way, the result can be inefficient. Solutions include formal processes for multilateral resource planning and the publication of current and consented resources, as used by the transmission and distribution system operators of Spain and Ireland.
-
Determine how decentralised resources will be controlled. While distribution networks today are largely passive, an active network is capable of accommodating distributed resources. As the electricity system becomes more active and complex, a single system operator may start to rely on intermediaries (such as virtual power plants) and partners (such as distribution system operators) to assist with system balancing. New systems of control, with new computational requirements, administrative rules and institutional characteristics may then be employed, reflecting new operational vulnerabilities.
-
Balance data transparency with security. As information communications technology infrastructure expands, the amount of data from the power system grows. The data systems need their own infrastructure, with public access to facilitate competition and optimise operations. Meanwhile, the distribution of data across resources creates new risks of cyberattack and privacy loss, which can be solved through adequate protocols.
2.2.3 Roadmap for Efficient Network Arrangements
This section presents a suggested roadmap for the development of network arrangements in China, as the country simultaneously carries out large-scale investment, market reforms and decarbonisation of its power system. These options are based on international best practice and leading thinking on future arrangements, as set out in Sects. 2.2.6 and 2.2.7.
The roadmap is based on the following guiding principles:
-
Strong markets need strong government. Market-based solutions have the potential to identify and deliver cost-effective investment and operation of power systems. However, both markets and natural monopoly networks benefit from a strong government that takes an active role in ensuring institutional incentives are aligned with public policy objectives. Network incentives can be aligned through separation of roles (unbundling) or strong regulation.
-
The institutional framework can be developed progressively. Wholesale institutional reform is challenging and disruptive. At the outset, small changes in current practice and small-scale pilots may provide proof-of-concept sufficient to build consensus for larger-scale reforms.
The roadmap suggests the following:
(1) Immediate actions
-
Continue the market liberalisation programme. Phase 1 of the DRC-Shell cooperation suggested a programme of electricity market liberalisation; consistent with this, China’s 13th Five-Year Plan (2016–20) aims to improve the systems by which markets play the decisive role in resource allocation. It will be important to continue with the market liberalisation programme to deliver a more advanced and efficient electricity system.
-
Rationalise investment planning. Clearly defined metrics for reliability and economic efficiency help network planners to identify efficient investments. Meanwhile, the application of the “beneficiary pays principle” encourages investment that increases productivity and avoids diverting national resources to stimulate regional output. Together, these approaches, when applied at national and regional level, facilitate greater interconnection and sharing of generation services.
-
Implement a coordinated approach to investment. The use of a common investment framework enables coordinated planning of generation and network investment, harnessing both strategic decisions and market enterprise. For example, the framework might set out the role of generation zones for large-scale renewables alongside alternatives like small-scale distributed generation.
-
Implement smart system architecture. Smart distributed resources are crucial to affordable decarbonisation. Before building the distributed resources, the system architecture to manage it should be laid down. At a minimum, this includes: deployment of smart meters to introduce time-of-use pricing to consumers in the distribution network; upstream information and communications architecture; and R&D to develop technical solutions for the smart grid.
(2) Move towards efficient pricing
-
Deregulate prices. Cost-reflective pricing can signal investment and operational efficiency to decision makers. The deregulation of prices can proceed sequentially, with further price reform contingent on the success of previous reforms. Price reform could commence upstream and progress downstream, beginning with input fuels and progressing through generation, network access and ending with retail, with provision to protect retailers if wholesale prices rise above retail prices before deregulation
-
is completed.
-
Create harmonised trading arrangements between transmission systems. Use prices to determine interconnector flows between provincial and regional transmission systems, signalling which provinces or regions could benefit from new investment. The prices would stimulate lower-cost generators to respond to demand.
-
Implement time-of-use pricing. Time-of-use pricing allows consumers and flexible resources to respond to variation in generation costs and demand. Again, it can proceed sequentially, starting with larger consumers, such as industrial facilities with flexible production schedules, and ending with smart household appliances.
-
Consider locational pricing. Similarly, locational pricing can signal investment and operational efficiency, but it brings disadvantages as well as advantages. China may consider locational pricing, after it has implemented time-of-use pricing, to signal geographical network constraints once demand peaks have been shaved. Zonal pricing is a potential intermediate step between uniform and full nodal pricing.
-
Protect end users. The deregulation of retail electricity may result in rent-seeking by retailers, raising consumer prices. This can happen if consumers do not switch suppliers readily or for other reasons if competition is not effective. Policies to protect consumers could be developed alongside any deregulation of retail electricity prices.
(3) Begin market trials
-
Create small-scale trials. Create small-scale trials to competitively procure new transmission investments, non-network alternatives to new transmission assets, ancillary services and so on. Use competitive tenders or auctions for the trials. These may provide proof-of-concept and experience with innovative, cost-effective solutions. To be successful, procurement must be open-access and transparent.
-
Progressively introduce market procurement. If the competitive procurement trials are successful, they can be scaled up and wider market procurement progressively introduced, where appropriate, across each transmission system. Market procurement can reveal information about the relative cost and benefits of a range of technologies.
(4) Make institutional choices
-
Develop transmission network institutions. Options include the status quo, an enhanced role for market procurement, and a regulated transmission system operator (TSO) or independent system operator (ISO). International experience of the regulated TSO or ISO model is yet to reveal the best performer of the two, so it matters more to adopt a good quality institutional model early than to choose between the options.
-
Select a model of control for decentralised resources. Initially, when the number of resources is small, the TSO may be able to control them directly. However, as the number of resources increases, and as temporal and locational pricing become more sophisticated, the computational, commercial and contractual capacity of a single operator model may be exceeded, and new models of control may be needed.
2.2.4 An Introduction to Electricity Networks
Electricity networks transport electricity from generators to consumers through a combination of high voltage transmission networks and low voltage distribution networks. The system operator balances supply and demand on the network at all times, within the constraints of available network capacity.
Liberalisation of electricity markets can lead to more efficient electricity systems by replacing government control over markets with competition. However, government intervention remains necessary to correct market failures. Electricity networks are a natural monopoly and may be subject to regulation to ensure efficient investment and operational decisions and pricing.
(1) Basic concepts
Networks are used to transport electricity and keep costs down. First, power generators often operate under economies of scale—it is cheaper to build a small number of large power plants than a large number of small plants to serve a population. Second, generation may be located remotely, far from sources of demand (for example, due to environmental constraints). Third, networks can reduce redundancy in generation investment, where patterns of generation and demand vary geographically.
To reduce losses and unit costs, most networks combine high voltage transmission with low voltage distribution. Electrical losses are low when power is transported at high voltage, and high when transported at low voltage. To minimise losses, electricity networks use high voltage transmission to carry electricity over long distances, and low voltage distribution to deliver electricity to consumers. Figure 25 provides a stylised illustration of a conventional electricity network.

Source Vivid Economics
Electricity networks transport electricity from generators to end users.
Transmission networks are typically meshed networks, while distribution networks are radial networks. Meshed networks are a complex arrangement of links, with multiple paths connecting different nodes. Meshed networks are more resilient: multiple links provide redundancy, such that if a single link fails, other paths remain intact. This redundancy raises the cost of the network. Furthermore, flows of electricity through a meshed network are governed by physical laws and are difficult to predict. The operation of a meshed network is, therefore, complex and computationally demanding. Radial networks are a simple arrangement of links, with single paths connecting nodes. Radial networks are less resilient, but also less costly and less complex.
The system operator balances supply and demand on the network at all times. Network voltage and frequency need to be maintained within precise limits to prevent damage to equipment and blackouts. The maintenance of stable voltage and frequency is known as system security. While generators and consumers can trade privately for electricity supplied through the network, system security benefits everyone equally. The system operator arranges with generators and consumers to adjust output or consumption to stabilise the network.
Transmission and distribution links have finite capacity, which leads to congestion. Congestion occurs if demand at a node is greater than the capacity of the links supplying that node. As demand is variable, it is usually not efficient to invest in sufficient capacity to meet peak demand at all times. The efficient level of capacity is lower, which gives rise to a degree of congestion. The system operator manages this congestion by balancing generation output and consumer demand across the network.
The system operator typically balances in one of two ways. Under a central dispatch system, the system operator observes potential generation and consumption on the network and optimises the pattern of generation and consumption within the network constraints. Under a bilateral trading system, the system operator observes contracted generation and consumption on the network and identifies areas of network congestion. The system operator then curtails some generators causing the congestion and arranges for alternative generators on less congested lines to provide the missing generation.
(1) Balancing the electricity system
A simple example of balancing an electricity system under network constraints is shown in Fig. 26. In this example, a system operator balances a system of two cities interconnected with a capacity-constrained transmission line. The numbers in green, blue and purple are the inputs for the system operator’s balancing problem. The numbers in red are the outputs.

Source Vivid Economics
Example of system balancing with network constraints.
In City A, generators can produce up to 150 megawatts (MW). Generation costs $10 per megawatt-hour (MWh). Consumers demand 50 MW. In City B, generators have 50 MW capacity. Generation costs $20/MWh. Consumers demand 90 MW, exceeding the local generation capacity. Consumer demand in both cities is constant and does not change with price. The interconnection between City A and City B can carry up to 80 MW.
To minimise the total cost of the system, the system operator first uses the cheaper generation in City A. Generators in City A serve local demand (50 MW) and export 80 MW to City B (in total 130 MW). Because the 80 MW capacity of the interconnection is fully utilised, the more expensive generators in City B serve the rest of City B’s local demand (10 MW). As a result, the system price equals the cost of the generators in City B ($20/MWh), and the total cost is $2,800 (140 MW x $20/MWh).
(2) Electricity networks in a liberalised electricity system
The liberalisation of electricity markets has a strong economic rationale: competition maximises efficiency and increases welfare. For this reason, many countries have gradually liberalised their electricity markets, reducing government intervention and increasing competition. Beginning in 1990 with the UK, liberalisation spread to Norway, Chile, Argentina, New Zealand and Australia in 1991, and began to spread across the USA from California in 1994. The European Commission published directives in 1996 that encouraged more countries across Europe to liberalise.
Liberalisation of electricity markets means the development of competitive markets, with minimal government control over the technologies and prices in these markets. Competitive markets operate in wholesale electricity, capacity and the procurement of balancing services. Historically, this has been achieved through the unbundling of generation and retail from the natural monopolies of transmission and distribution. In parallel, a process of privatisation often occurred, particularly in the competitive parts of the supply chain.
However, market failures remain and government interventions are needed to correct them. As summarised in Fig. 27, measures include: a strong carbon price to incentivise low-carbon generation and reduce demand; a stable, predictable and credible policy setting to reduce policy risk and the cost of capital for low-carbon investments; and, the regulation of natural network monopolies.

Source Vivid Economics
The objective of an electricity market is to supply services so that demand and supply can be balanced, while correcting market failures.
2.2.5 Challenges in Network Provision
Network service providers face challenges as electricity systems decarbonise and decentralise.
(1) What are the challenges?
The challenges of efficient network provision encompass planning and delivery, operation and cost recovery. Challenges in planning and delivery arise from uncertainty over future electricity demand and the difficulty of coordinating network investment with independent generators. Challenges in operation arise from the capacity constraints of the network, the complexity of the system, and the unpredictability of flows of electricity. Challenges in cost recovery arise from the natural monopoly characteristics of electricity networks, and the difficulties of mitigating monopoly behaviour with conventional regulation.
(1) Planning and delivery
Planning and delivery of electricity networks faces uncertainty over future electricity demand and difficulties in coordinating network investment with independent generators. First, the volume and location of future demand is uncertain and depends on population growth, changes in settlement patterns, and changes in industrial structure, technology and economic growth. Network planners judge where network assets will be required. Second, while vertically integrated utilities coordinate their plans for generation and network investment, in a liberalised electricity system, generation and network investment are carried out by separate organisations. Without coordination, generators face the risk that their revenues may be curtailed by network congestion, and networks face the risk that generators will underuse their assets.
(2) Operation
Balancing the electricity system is challenging due to system complexity and the unpredictability of electricity flows. With many sources of generation and consumption, as well as network constraints, the optimal level of production and consumption for each source is a complex calculation. Furthermore, due to the physical laws governing electricity networks, the precise flows of electricity through the network depend on the volumes of consumption and production of each generator and user and cannot be predicted in advance.
(3) Cost recovery
Electricity networks are natural monopolies. One of the roles of the system operator is to levy charges to pay the network owner. This is achieved by designing tariffs that recoup capital, operation and maintenance costs for the network owner, and passing these costs through to network users. When the network operator is also the network owner, it operates as a monopoly and is incentivised to underinvest in network infrastructure and charge high prices to consumers.
Innovative arrangements are needed to mitigate monopoly behaviour effectively. Electricity networks are characterised by high capital costs and economies of scale. For these reasons, electricity networks are natural monopolies, with a single network serving a given area. The conventional approach to mitigating monopolistic behaviour in a natural monopoly is regulation. However, regulators have imperfect information on current network costs and how these costs can be reduced over time as productivity improves. Depending on the type of regulation, network companies may face incentives to overstate their costs or to overinvest.
(2) Future changes: decarbonisation and decentralisation
Potential changes in key characteristics of the electricity system are encompassed within two broader trends: decarbonisation of electricity and the wider energy system; and decentralisation of system resources, as summarised in Fig. 28. These changes, and their implications for the challenges of efficient network provision are described below in turn.

Source Vivid Economics
Future electricity grids will be shaped by two broad trends: decarbonisation and decentralisation.
(1) Decarbonisation
Decarbonising an electricity system requires changes in generation technologies and far-reaching changes in patterns of electricity demand. Generation technologies will shift from fossil generation to low-carbon generation, that is, a mix of carbon capture and storage, nuclear, biomass and renewables. Electricity demand will be affected by increases in demand from electrification of end-use sectors, particularly heat and transport, as well as decreases in demand from greater efficiency of electrical appliances. There will also be a shift in the profile of demand, as low-carbon flexible resources (electricity storage and demand-side response) emerge to balance the relatively inflexible generation profile of nuclear and renewables.
These changes are likely to make harder the challenge of planning and delivering network infrastructure. Future volumes of demand will be more difficult to forecast, due to uncertainty over the level of electrification of end-use sectors and improvements in the efficiency of electrical appliances. Another element of uncertainty is the degree to which low-carbon flexible resources will reduce peak demand and, therefore, the level of network capacity.
Low-carbon flexible resources can be substituted for new network investments, thus reducing network costs. However, as these resources provide different system services (balancing, frequency response, network congestion mitigation), there may be underinvestment in them if markets do not exist for all the services the resources provide.
(2) Decentralisation
Decentralisation involves a shift in electricity resources from the transmission system to the distribution system. Decentralised electricity resources comprise generation, demand response and storage. Decentralised generation includes wind and solar, which are increasingly connected to the distribution network, including at the household level. Demand response is the flexible operation of electrical equipment in response to system conditions; electric vehicles are expected to significantly increase the potential for demand response as their batteries can be charged at times of high electricity generation and low demand. Decentralised storage may also increase, potentially even at the household level.
To unlock decentralised electricity resources requires a smart grid. A smart grid is characterised by the predominance of controllable electricity resources (generators, storage and appliances) throughout the electricity system, the ability for users to decide when to use their devices, the development of operating standards that allow resources to be operated in a coordinated way, sufficient development of digital technologies (communications bandwidth, data storage and computing power), and adequate data security and privacy protocols.
Decentralisation exacerbates the challenges to planning, delivery and operation:
-
A coordination problem may arise between the transmission system and the various distribution systems. Most new investment occurs in the transmission system, where adequate information is available on current and planned resources to inform new investment decisions. A shift in investment to the distribution network, where adequate information is not typically available, will create a coordination problem, where investors will not have a clear understanding of system needs nor the potential returns on investment. This could result in overinvestment, underinvestment, a poor technology mix, or a poor spatial distribution of resources.
-
The computational requirements of balancing a decentralised system will increase significantly. Optimising the operation of the entire system requires knowing the optimal volume of output and consumption of every resource in the system. As the number of controllable resources increases, from the limited set of large resources in a transmission system to the total set of resources across all distribution systems, the computational demands of this optimisation calculation also increase. If computing technology is not able to meet these computational demands, then intermediate levels of control are required, and only partial optimisation is possible.
Finally, decentralisation will require the risks to data privacy and cybersecurity to be effectively managed. Decentralisation will be accompanied by a very significant extension of digital technology across all distributed resources and will create risks to data privacy and cybersecurity. Protocols to manage data use and control these risks can be developed and implemented.
2.2.6 Network Arrangements to Address Current Challenges
Best practice arrangements are needed to ensure efficient network provision. Section 2.2.5 describes challenges in efficient network provision, and how these challenges will grow as power systems decarbonise and decentralise. International experience since the liberalisation of electricity markets has produced strong evidence—based on best practice in network arrangements—on how to meet the challenges of efficient network provision. Current best practice arrangements provide a foundation for new arrangements to meet future challenges arising from decarbonisation and decentralisation. These best practice arrangements comprise:
-
an institutional model to align incentives with public policy objectives: an institutional model is needed that mitigates monopolistic behaviour and incentivises networks to invest in appropriate network infrastructure and operate it efficiently;
-
strategic transmission planning: determining the appropriate profile of new transmission investment is a complex process that requires strategic planning;
-
the appropriate level of locational pricing: investing in and operating networks efficiently requires an understanding of current network congestion; and
-
a regime for merchant transmission investments: merchant transmission investors have the potential to deliver more adequate investment than a single-owner network.
(1) An institutional model to align incentives with public policy objectives
An institutional model is needed that mitigates monopolistic behaviour and provides networks with incentives to invest in appropriate network infrastructure and to operate that infrastructure efficiently. Two institutional models that can create an efficient regime are the transmission system operator (TSO) model with performance-based regulation, and the independent system operator (ISO) model. 0 highlights the key differences between these two models: a TSO both owns and operates the transmission system, requiring strong regulation; while an ISO is a system operator that is fully separated from ownership of all network resources. Several intermediate models also exist, for example, where the system operator and transmission owner are legally separate companies but owned by the same parent company (Fig. 29).

Source Vivid Economics
The transmission system operator (TSO) and independent system operator (ISO) are the two main institutional models for system ownership and operation.
As shown in Fig. 30, most electricity systems have moved from vertically integrated monopoly utilities before liberalisation to a TSO or ISO model today. In 1985, Chile was the first country to adopt the ISO model. The UK shifted from vertical integration to a TSO with a performance-based regulation structure in 1990, with Germany following suit in 1998. Following the orders of FERC (the US electricity regulator), Pennsylvania-New Jersey-Maryland (PJM) and California (CAISO) transitioned from a vertically integrated structure to the ISO model in the late 1990s.

Note VIU = vertically integrated utility; ISO = independent system operator; TSO = transmission system operator; TSO/PBR = transmission system operator with performance-based regulation. Source Chawla and Pollitt (2013)
Several countries shifted to the TSO and ISO models when they liberalised their electricity markets.
(1) TSO with performance-based regulation
A TSO is an entity that both owns and operates the transmission system; it therefore has incentives for monopolistic behaviour. The TSO owns all the network assets and is also responsible for planning, deployment and operation of the system. The TSO model is prevalent in most European countries.
Performance-based regulation is needed to align a TSO’s incentives with public policy objectives. A TSO is difficult to regulate as it has better information than the regulator on the costs it faces. This gives rise to one of two problems. If the regulator tries to prevent monopoly behaviour by imposing a cap on prices, known as price regulation, it estimates the price level required for the TSO to recover its costs. The TSO then has incentives to exaggerate the costs it faces and secure price caps greater than its actual costs, a problem known as adverse selection. In this case, the TSO can underinvest and continue to set high prices. If instead the regulator tries to prevent monopolistic behaviour by paying the TSO for its costs plus a regulated return (cost-of-service regulation), the TSO does not have any incentive to take necessary measures to decrease its costs, a problem known as moral hazard. In contrast to these approaches, performance-based regulation seeks to address both monopoly profits and underinvestment. An example of performance-based regulation is the imposition of a price (or revenue) cap, which is adjusted every year by the rate of inflation and target rate of productivity growth. The TSO is constrained in exaggerating its costs by the regulator conducting benchmark analysis and detailed studies of the TSO’s historical accounts. The TSO has some incentive to lower its costs because it can retain the difference between the price cap and its actual cost as profit.
Performance-based regulation is still evolving and there is no consensus on the optimal practice. Several forms of performance-based regulation have been adopted, which continue to evolve. An example of their evolution is the introduction in the UK of the RPI-X (retail price index minus X) mechanism in 1992, and its eventual replacement by the RIIO (revenue = incentives + innovation + outputs) mechanism in 2013, as described below. A key challenge in performance-based regulation is its high information burden. The regulator has to review the TSO’s accounts and business plans and undertake benchmark analysis.
Performance-based regulation in the UK
The UK introduced performance-based regulation in electricity networks in 1992 with the RPI-X mechanism, later replacing it with the more sophisticated RIIO mechanism in 2013:
-
RPI-X mechanism. Ofgem and its predecessors, the electricity market regulator in the UK, used the RPI-X mechanism until 2013. Under this mechanism, Ofgem carried out cost forecasts to determine the base revenue required by the TSO to recover its costs. Based on this base revenue, Ofgem set a price cap and adjusted it each year for retail price inflation (RPI) and an assumed target rate of productivity growth calculated by statistical benchmark analysis. Ofgem reset the price cap at the end of the five-year price control period to ensure that the TSO’s cost savings are passed on to end consumers. Under the RPI-X mechanism, the TSO had incentives to reduce its costs because it was able to retain the margin between the price cap and its own actual cost as profit, as shown in Fig. 31. However, the RPI-X mechanism did not adequately incentivise service quality or innovation. It allowed cost savings to be achieved through decline in quality of service, and the five-year price control periods did not provide sufficient incentives to develop new technologies (such as smart meters) with longer investment cycles and the potential to provide cost savings over the longer term.
Fig. 31 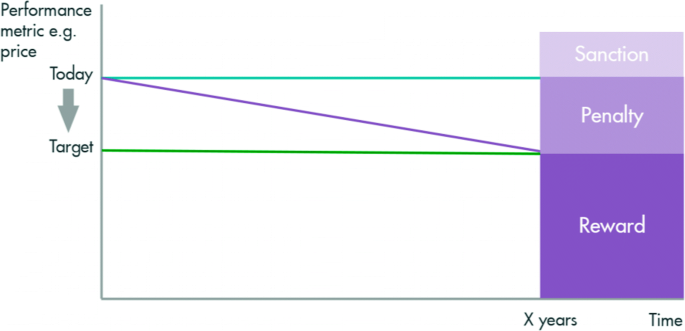
Source Vivid Economics
Under the RPI-X mechanism, the TSO takes measures to decrease its costs because it retains revenue from cost savings.
-
RIIO mechanism. In 2013, Ofgem introduced the RIIO mechanism to address its concerns with RPI-X. The RIIO mechanism takes the elements of RPI-X that work well, such as determining base revenue, and adds extensive innovation and output targets to them. The RIIO mechanism determines the base revenue from output-led business plans with greater use of option analysis and scenario planning. In their business plans, companies compare the costs and benefits of options for delivering long-term outputs under various scenarios and assess the value of keeping these options open. Moreover, financial and reputational incentives strengthen the incentive structure. Ofgem rewards or penalises companies when they achieve or miss their output targets. Reputational incentives do not have a financial element, but they affect Ofgem’s evaluation of base revenue in the next review periods. A longer control period, of eight years, encourages the TSO to focus on longer term investments, such as smart meters. RIIO provides a wider set of performance incentives than RPI-X, but at the cost of greater complexity and reduced transparency.

(2) Independent system operator
An independent system operator (ISO) is fully separated from ownership of all network resources. The ISO performs all system operation functions, including allocating network capacity among generators and consumers to respect the physical characteristics of the network, carrying out residual balancing to ensure electricity is delivered to where it is most valued, and maintaining the stability of the electricity system. In an ISO model, the transmission network resources are owned by one or more transmission owners (TOs). The ISO levies charges from generators and/or consumers for use of the transmission system and pays these charges to the TOs. Typically, an ISO is also responsible for planning new transmission investments, either mandating TOs to make these investments or incentivise competitive tenders to facilitate delivery of investment. An ISO is usually a non-profit entity.
Separation of operation from ownership removes the system operator’s incentives to charge monopoly prices. An ISO may be a non-profit organisation or may earn profits on revenues for system operation. As an ISO does not earn profits determined by revenues from use of the transmission system or by the cost of transmission investments, it has no incentive to charge tariffs that are higher than needed to recover the investment costs of the transmission network or underinvest in transmission assets. Unlike a TSO, therefore, an ISO does not need performance-based regulation.
The ISO’s functions can be specified by its mandate and its behaviour can be governed by a set of rules. The mandate could be to minimise the total cost of meeting a given reliability standard. Rules could govern processes for transmission planning and investment; providing grid connections to new system resources; administering competitive tenders for new network assets; levying charges for network use; or monitoring market power in the electricity system.
Nevertheless, it is desirable to have in place a mechanism to incentivise the ISO. It is unlikely to be possible to specify a set of rules that perfectly incentivise the management to meet the ISO’s mandate. That is, to encourage the ISO to carry out the planning, investment and operation of the transmission system to strike the best possible balance between reliability of electricity supply and economic efficiency of the network. Imposition of financial penalties on the ISO is likely to be a poor incentive mechanism as ISO revenues are likely to be small relative to the welfare losses arising from poor performance in operating the system. Instead, well-designed management incentives may be needed.
The ISO model is prevalent in North and South America. Chile, Argentina and Peru were early adopters of the ISO model. There are many ISOs in the USA, each covering a transmission network.
(2) Strategic transmission planning
The design of new transmission investment is a complex process and requires strategic planning. Specific challenges are: the uncertainty in volume and location of future demand, the coordination problem facing generation and network investors, and the large number of possible transmission investments. These challenges can be mitigated by strategic planning. Key characteristics of strategic planning include:
-
Define the objectives of new transmission investment. Transmission planning is more effective when the objectives of new investment are clearly defined. These include reliability (security and adequacy of supply) and economic efficiency (reduction in the total cost per unit of output). Defining these criteria allows the benefits of new transmission infrastructure to be measured.
-
Estimate and compare the benefits of each proposed investment. Cost-benefit analysis is a key planning tool to identify proposals that meet investment objectives. Reliability and economic efficiency can be assessed with electricity system modelling, and modelling of multiple scenarios can help identify the best possible infrastructure investments in conditions of uncertainty. If available, locational pricing provides a clear signal of congestion costs and can substantiate the economic benefits of new network infrastructure.
-
Consult all relevant stakeholders. As the costs of investments are borne by network users, they have incentives to ensure that only the most valuable network infrastructure is developed. Stakeholder consultation can elicit views from generators, consumers (municipalities, consumer interest groups) and connected transmission and distribution systems to inform the cost-benefit analysis.
(3) Appropriate level of locational pricing
Investing in networks efficiently requires an understanding of current network congestion. New network investments that relieve significant network congestion are particularly valuable.
Many electricity systems operate a system of uniform transmission pricing, which does not signal network congestion. Under a system of uniform pricing, the price of electricity is the same at every network connection, regardless of the degree of congestion. It does not signal the need to invest in solutions to relieve network congestion—such as new network investment, generation or non-network alternatives to new transmission assets, such as electricity storage and demand-side response. While, in principle, the system operator can signal the need to invest through location-specific transmission charges, the rate of these charges is difficult to determine if the electricity price does not signal network congestion. Furthermore, uniform pricing results in redispatch costs, where a plant that is scheduled to generate is compensated for curtailment if the network is congested.
Nodal pricing can help signal network congestion. Nodal pricing, or locational marginal pricing, is a price mechanism that reflects the cost of supplying additional electricity at a specific network connection (node), given the demand for electricity, transmission constraints and options for local generation at that node. When there is no network congestion, overall demand is met at least cost and all nodal prices are the same. When network congestion occurs, demand is met by costlier local generation rather than cheap generation from another node, raising prices at congested nodes. Nodal pricing therefore signals the need to invest in solutions to relieve network congestion, such as new network investment, new local supply, and non-network alternatives to new transmission assets, such as electricity storage and demand-side response.
(1) Nodal pricing
Figure 32 provides a simple example of balancing an electricity system under nodal pricing. In this example, a system operator balances a system of two cities interconnected with a capacity-constrained transmission line under nodal pricing. The numbers in green, blue and purple are the inputs for the system operator’s balancing problem. The numbers in red are the outputs.

Source Vivid Economics
Nodal pricing reflects the cost of supplying additional electricity at a given node
In City A, generators can produce up to 150 MW. Generation costs $10/MWh. Consumers demand 50 MW. In City B, generators have 50 MW capacity. Generation costs $20/MWh. Consumers demand 90 MW, exceeding the local generation capacity. Consumer demand in both cities is price inelastic (consumer demand is constant and does not change with price). The interconnection between City A and City B can carry up to 80 MW.
To minimise the total cost of the system, the system operator first uses the cheaper generation in City A. Generators in City A serve the local demand (50 MW). That is why the nodal price in City A equals the local generation cost ($10/MWh). Generators in City A also export 80 MW to City B. Since the capacity of the interconnection is fully used, expensive generators in City B supply the rest of local demand (10 MW). As a result, the nodal price in City B equals the local generation cost ($20/MWh). The total cost is $1,500 (= 140 MW x $10/MWh + 10 MW x $20/MWh).
However, nodal pricing has disadvantages as well as advantages. First, vulnerability to market power may arise because the segmentation of the electricity market into smaller locational markets increases the concentration of generators at each node with a supply deficit. Some authors challenge this view and argue that the network architecture is the main driver of market power, rather than the pricing mechanism. Nodal pricing can also reduce liquidity in long-term contracting, such as financial transmission rights and contracts for differences. This problem is addressed in the USA by averaging nodal prices into trading hub prices to provide liquidity to market participants.
Zonal pricing, another form of locational pricing, may provide a useful compromise between uniform and nodal pricing. Zonal pricing reduces the complexity of having large numbers of nodes by aggregating them into zones. Similar to dispatch under nodal pricing, the system operator first dispatches generation-given transmission constraints between zones. If transmission lines in a given zone are congested, the system operator has to redispatch generation in that zone to alleviate congestion. As a result, zonal pricing provides some of the benefits of nodal pricing in terms of signalling network congestion, but does not fully eliminate the redispatch costs associated with uniform pricing.
Locational pricing may be considered when time-of-use pricing is fully implemented. Wider changes to improve the flexibility of the electricity system through electricity storage and demand response are expected to reduce demand and generation peaks, which would automatically reduce network congestion relative to an inflexible system. These changes require time-of-use pricing to be fully implemented across all system resources (including end users) to be effective.
(4) A regime for merchant transmission investments
The entry of merchant transmission investors has the potential to deliver greater adequacy of investment than a single-owner network. Merchant transmission investors are third-party developers of transmission projects. If locational pricing is implemented, a merchant transmission investor has the incentive to invest in a new transmission link when the revenues from use of that link are greater than the investment cost. Therefore, in principle, merchant competition offers the potential to increase the adequacy of the transmission infrastructure by investing where an incumbent is not willing to do so. This might be the case if the incumbent is an unregulated monopoly or poorly regulated TSO.
Other attractive properties of the merchant model are the ability to include non-network alternatives to new transmission assets in planning processes, reduce the risk for consumers and minimise investment costs. In liberalised power markets, potential merchant transmission investors could invest in new transmission capacity or enter the generation market to supply local generation to a node that is served by a congested transmission link. Investment risk is transferred from regulated transmission owners and consumers to the merchant. As the merchant is the beneficiary of any cost saving, construction costs may also be minimised.
However, merchant investment alone is insufficient to ensure overall adequacy of the network, underscoring the importance of a well-designed institutional model. Transmission investments exhibit economies of scale, where large capacity investments carry only a small cost premium relative to small investments. As large capacity investments offer significant additional benefits at little additional cost, they are socially desirable; however, as these additional benefits are reflected in lower locational prices (due to lower congestion), they are less desirable for private investors. In this setting, merchants will tend to underinvest in new network capacity. Alternatively, with an ISO institutional model, the ISO can also ensure overall network adequacy by planning new network capacity and delivering new investment at minimal cost by running competitive tendering processes.
Merchant transmission investments have been implemented in the USA, Australia and Argentina. In the USA, merchant investment is promoted by the Federal Energy Regulatory Commission (FERC) Order 1000, and several projects are in progress or have been completed in recent years. Nearly all merchant-led investments have been on interconnectors, that is, links between separate networks. Here merchants alleviate coordination and cost allocation issues between different system operators.
2.2.7 Network Arrangements to Address Future Challenges
This section discusses new network arrangements to address the future changes brought on by decarbonisation and decentralisation. They are:
-
Strategic generation zones: Strategic generation zones coordinate investment in transmission and generation assets and connect remote renewable energy resources to large population centres.
-
Markets for flexibility services: Flexible resources, such as electricity storage and demand response, can be a substitute for new network investment, as well as providing a range of different system services. A simple set of markets for each system service can reward flexible resources and avoid underinvestment.
-
System for controlling decentralised resources: While distribution networks today are largely passive (one-directional flow between the transmission system and the end user), they will need to become active (distributing power from various sources and bidirectional) to accommodate distributed resources. Distributed resources increase the complexity of the electricity system. If the system is too complex for a single system operator to balance, a hierarchy of resource control will be needed, with intermediaries such as virtual power plants and distribution system operators interacting with the transmission system operator. The hierarchy of resource control may reflect computational requirements, institutional characteristics or operational vulnerability.
-
Coordinated investment in decentralised resources: Investment in generation and storage resources should meet the needs of the whole electricity system. A decentralised electricity system may not be able to provide adequate information to investors on system needs, raising the risk of inefficient investment. A coordinated approach to investment can mitigate this risk.
-
Open-access, public data on system conditions and resources: Market participants need access to market information to facilitate a level playing field for competition. A data exchange could be part of an efficiently functioning energy system, but would need to be both secure and accessible.
-
Accommodate future innovations: Recent innovations in electricity networks include new network structures and peer-to-peer electricity trading, which may offer significant benefits. These innovations can be facilitated through pilots and early stage funding.
(1) Strategic generation zones
The decarbonisation of electricity generation and the wider energy system heightens the challenge of planning and delivering network infrastructure. The amount of new transmission investment needed will be more difficult to determine due to greater uncertainty over the level of total electricity demand. This uncertainty is due to: (a) the electrification of end-use sectors and improvements in the efficiency of electrical appliances; and (b) peak demand, as flexible resources contribute to smoother generation and consumption profiles. The degree to which generation will be centralised, that is, connected to the transmission network, will be difficult to forecast.
In many countries, renewable energy resources are located in areas that are distant from large population centres, and thus require large-scale transmission investment. For example, in the UK, most electricity demand is located in the south of England, while a large proportion of onshore wind resources are located in Scotland and offshore wind resources in the North Sea.
In a liberalised electricity system, investors in generation and network investment face a coordination problem. While vertically integrated utilities can plan generation and network investment simultaneously, in a liberalised electricity system, generation and network investment are carried out by different institutions. Generation investors face the risk that their revenues may be lower due to inadequate network investment, and network investors face the risk that generators will underuse their new network investments. This can lead to underinvestment.
This coordination problem can be mitigated with strategic generation zones. If a strategic decision is made to exploit a large renewable resource that is distant from large population centres, generation investors may be given incentives to invest there. This may require an overarching strategic plan to be developed by an institution, such as a government agency, with sufficient authority to determine the location of both transmission and generation investment. It may also require a credible, long-term regime for network connection to be developed to reduce stranded asset risks for generators. For example, in the UK, nine offshore wind farm zones of varying sizes with the capacity to deliver 33 GW were identified within British waters. The Crown Estate, the statutory owner of seabed rights, asked renewable energy developers to bid for exclusive rights to develop offshore wind farms within the zones. The Electricity Networks Strategy Group, a high-level forum of key stakeholders in electricity networks, including the Crown Estate, then identified the key transmission investments needed to meet future demand, given the expected location of future generation. The areas identified by this exercise are shown in Fig. 33.

Source The Crown Estate (2017)
UK offshore wind farm zones identified for the development of renewable energy
(2) Markets for flexibility services
Decarbonisation will require flexible resources, electricity storage and demand response, which offer non-network alternatives to new transmission assets. Electricity networks are costly, long-lived assets. Investment in them is made with uncertainty over the future spatial and temporal profile of generation and demand. It will be increasingly valuable to substitute flexible resources like electricity storage and demand response for new network investments where possible, or defer new network investments until the future profiles of generation and demand are better understood. As discussed later in this report, nodal pricing provides a locational signal for non-network alternatives.
Flexible resources provide a range of system services. As well as substituting for and deferring new network investments, services provided by flexible resources include balancing and system stability. To provide balancing services, electricity storage can hold surplus energy until it is needed, and demand response can shift demand to when electricity is being generated. To provide system stability, electricity storage and demand response can adjust system voltage and frequency. For flexible resources to be deployed at volumes that bring the greatest benefits, mechanisms exist to reward them for the system services they provide.
A simple set of markets for each system service allocates existing flexible resources and signals investment need. Storage and demand response are already actively engaged in balancing supply and demand in several wholesale markets worldwide. However, markets for system stability are typically not developed enough to allow flexible resources to participate to their fullest extent. Procurement mechanisms for system services typically specify these services in terms of the properties of the thermal generators that historically provided them, such that these mechanisms are often closed to new, low-carbon flexible resources. Recent attempts to create procurement mechanisms for flexible resources have resulted in a patchwork of complex and mutually inconsistent mechanisms. For example, in the UK, electricity storage facilities providing a short-term ancillary service called enhanced frequency response are not allowed to participate in the capacity mechanism. A simple set of markets to reward all system services provided by flexible resources is needed to ensure adequate investment in non-network alternatives.
(3) Model for controlling decentralised resources
While distribution networks today are largely passive, they will need to become active to accommodate distributed resources. As demand on the distribution network is typically inflexible, generators for the transmission system operate flexibly to meet demand and maintain system security. As decentralised electricity resources (distributed generation, storage and demand response) are deployed in the distribution network, these resources will need to operate flexibly.
Distributed resources increase the complexity of the electricity system. Optimising the operation of the electricity system involves finding the optimal volume of output and consumption of every resource in the power system. A conventional, centralised electricity system typically includes a limited number of large transmission-connected generators, suppliers and large industrial consumers with flexible demand. However, a decentralised electricity system will include a very large number of small decentralised resources. The number of resources to be optimised might increase by a factor of several million.
A similar increase in computational demand would occur if the temporal resolution at which resources are controlled increases. For example, shifting from hourly to real-time (second-by-second) settlement of all dispatch and consumption actions would increase the computational demands of optimal system balancing by a factor of 3,600.
If the system is too complex for a single system operator to balance, a hierarchy of resource control will be needed. Complete optimisation of a decentralised electricity system would have very significant computational requirements. If computing technology is not able to meet these requirements, then control of the system will be distributed.
Virtual power plants (VPPs) and distribution system operators have a role to play in a hierarchy of resource coordination. VPPs, also known as aggregators, could coordinate (aggregate) decentralised resources and coordinate them individually to present the (transmission) system operator with a level of net generation (or consumption). If the system is complex, more than two levels of resource coordination might be needed, for example, with some VPPs coordinating the activity of smaller VPPs further down the hierarchy. Distribution system operators are VPPs that coordinate all resources in a given distribution system, either directly or via intermediate VPPs.
Hierarchies of resource control provide only partial optimisation of the electricity system. In order to optimise the whole electricity system, a single optimising agent must know the demand and supply curves for each system resource. Where no single agent has this information, only partial optimisation is possible, as groups of resources for which information is available must be optimised separately. Markets between groups of resources will be required to coordinate their operation to balance the whole system. However, supply and demand curves in electricity systems change in real time, while the process of price discovery in decentralised markets takes place over time through multiple iterative trades. Therefore, markets between multiple levels of resource coordination can provide only a partial optimisation of the electricity system.
A decision needs to be made about how distributed resources will be coordinated, with several possibilities available. Four possible models for operating a distribution system of distributed energy resources are currently being discussed in the literature, and are illustrated in Fig. 34. These models are:

Note TSO = transmission system operator; DSO = distribution system operator; DER = distributed energy resources; VPP = virtual power plant. Source Vivid Economics
There are several possible models for coordinating distributed energy resources.
-
Whole system operator. This model involves only one level of control. The transmission system operator (TSO) carries out constrained dispatch of the whole electricity system. In other words, it carries out least-cost dispatch across all resources in the transmission and distribution systems, taking capacity constraints in both systems into account. In this model, distribution system operators retain their current, minimal functions of basic planning and operation of the distribution system.
-
Whole system operator with distribution system operator. This model has two levels of control. First, the TSO carries out economic dispatch of the whole electricity system, including constrained dispatch of the transmission system. In other words, it carries out least-cost dispatch across all resources in the transmission and distribution systems, but only takes capacity constraints in the transmission system into account. Second, distribution system operators (DSOs) modify the operation of distributed resources to allow for capacity constraints in the distribution system.
-
Virtual power plants (VPPs) with distribution system operator. This model involves three levels of control. First, VPPs provide the transmission-level system operator with offer curves for generation or demand reduction for the resources they operate. Second, the transmission-level system operator carries out constrained dispatch of the transmission system. Third, DSOs modify the operation of distributed resources to take into account capacity constraints in the distribution system.
-
Distribution system operator. This model involves two levels of control. First, DSOs act as sole distribution-level VPPs, controlling all distribution system resources and carrying out constrained dispatch of the whole distribution system. DSOs provide the transmission-level system operator with bid or offer curves for the generation and demand resources they operate. Second, the transmission-level system operator carries out constrained dispatch of the transmission system.
Key criteria when choosing a model are the computational requirements, institutional characteristics and operational vulnerability of each model. As explained above, systems with high computational requirements or small improvements in computing technology will require more levels of resource coordination; while systems with low computational requirements or large improvements in computing technology will require fewer levels of resource coordination, and—with sufficiently developed computing technology—potentially a whole system operator. Preferences for specific institutional characteristics are also relevant. For example, the system operator and distribution system operator models involve coordination of resources by a single operator. Consumers may or may not have concerns about price, quality of service and privacy. If they have concerns, they might prefer a model involving control of resources by VPPs, which compete to meet customer requirements. Finally, the models may have different degrees of vulnerability to digital failures, such as those caused by cyberattack.
Hierarchies of resource control may be needed until digital capabilities are sufficiently developed. While in the near term a single operator may be able to optimise the electricity system with relatively low volumes of distributed resources, once sufficient volumes of distributed resources are deployed the task of optimisation may be too great for a single operator. Hierarchies of control may be established early to ensure increasing volumes of distributed resources can be accommodated if improvements in computing technology fail to keep pace with increases in computational requirements. Even if computing technology improves to the point where a fully distributed system can be optimised by a single operator, an increase in the temporal resolution of system control (for example, from half-hourly settlement towards real-time settlement) would result in significant increases in computational requirements. A shift from hierarchies of control to a whole system operator model would only be viable if improvements in computing technology were sufficient to meet the requirements of optimising a fully distributed system in real time.
(4) Coordinated investment in decentralised resources
Electricity systems with largely centralised resources provide adequate information to investors on system needs. Electricity systems periodically require investment in new resources, such as new generation plants. In theory, developers invest in new resources in response to a price signal in the wholesale market. These new investments are typically large. In principle, this leads to a coordination problem, whereby either several investors might plan to develop a similar resource (overinvestment), or investors might not invest in required resources due to the risk that other investors might do so (underinvestment). In practice, these risks are minimised because the transmission system operator knows which resources are under development and awaiting grid connection and can make this information public.
However, a decentralised electricity system may not provide adequate information, risking inefficient investment. As resources shift to the distribution system, the same coordination problem may arise. This is because unless adequate procedures are introduced, no single market participant knows which resources are under development and awaiting grid connection across all electricity systems. The consequence is, again, inefficient investment: overinvestment, underinvestment, a poor technology mix, or a poor spatial distribution of resources.
The risk of inefficient investment can be mitigated through a coordinated approach to planning new assets. As set out in Fig. 35, this could be achieved either through formal processes for resource planning and decision-making, or through provision of information:

Note TSO = transmission system operator; DSO = distribution system operator. Source Vivid Economics
A coordinated approach can ensure efficient investment in electricity system resources.
-
Formal processes for resource planning and decision-making have been introduced in Spain and Ireland by the system operators of the transmission and distribution systems. Processes include formal collaboration, with the TSO and DSOs planning infrastructure and generation investment together. For example, in Spain, some regional administrations formed evaluation boards. In these boards the administration, TSO, DSO and developers coordinate investment plans and grid connection requests. The TSO and DSO analyse and approve investment plans together, thereby minimising network development and project costs and risk. In Ireland, under the group processing approach, investment plans of developers are collected in batches and then submitted to the TSO and DSO for consideration. The TSO or DSO then processes the plans that are most suited to its system. This approach coordinates the development of the transmission and distribution systems and efficiently allocates scarce capacity.
-
An alternative approach is to provide adequate information. For example, compulsory registration in a publicly available database when applying for planning or grid connection consent would provide investors with an understanding of the pipeline of future resources and allow them to evaluate potential investments against the expected system requirements.
(5) Open-access, public data on system conditions and resources
The development of digital infrastructure is expanding the amount of data and information available. Smart meters in buildings track the profile of energy use every second, offering a new source of information on energy consumption and user behaviour. In the electricity grid, sensors and wide area networks monitor grid reliability, providing real-time information on network conditions.
Market participants need a degree of access to market information to facilitate a level playing field for competition. The Council of European Energy Regulators, for example, has identified limited access to information as a key barrier to entry for new market participants. Access to information about distributed energy resources and network conditions may also grow in importance in the future. This information may provide a foundation for new opportunities for system balancing, as new participants could enter the market and find more efficient balancing solutions.
A data exchange could be part of an efficiently functioning set of future energy networks but would need to be managed carefully to mitigate risks while being accessible. A data exchange is a secure store of data, for example, on customer use patterns, available distributed energy resources, local prices and network conditions. The availability of this data raises privacy concerns, so a balance would need to be struck between accessibility and protection. Use of data exchanges will require adequate institutional arrangements. For example, if DSOs, who participate in markets for electricity system services, ran data services to which they gave themselves preferential access. In the long term, digital developments may make the operation of data exchanges by centralised authorities unnecessary, particularly if electricity trading shifts towards peer-to-peer exchange.
(6) Accommodating future innovations
Innovations in electricity networks include new network structures and peer-to-peer electricity trading, which may offer significant benefits. New network structures, including microgrids and fractal grids (a system of multiple microgrids) have the potential to make electricity systems more resilient to failure (see Sect. 1 on new network architectures below). Peer-to-peer trading through a distributed data management platform, such as a blockchain, offers the potential to lower transaction costs and reduce the role of intermediaries in electricity markets (see Sect. 2 on peer-to-peer trading below).
These innovations can be facilitated by the necessary policies and models needed to deliver efficient networks today and in the future. Most fundamentally, liberalised electricity markets provide a supportive environment for the development, demonstration and adoption of innovations. More specifically, an institutional model that aligns system operator incentives to public policy objectives will be needed to mitigate any incentive for incumbents to block the spread of innovations. A model for control of decentralised resources will also be needed to offer innovations, such as new network structures and peer-to-peer electricity trading, the opportunity to participate in electricity markets.
It is possible that over time these and other innovations will drive or enable larger changes that have the potential to restructure the electricity system more significantly. It will be worthwhile monitoring new technologies and business models, so that policy and regulation can respond appropriately, to realise value and address risks.
(1) New network architectures
Microgrids and fractal grids are innovative network architectures. Both architectures provide greater resilience than the radial links of conventional distribution networks. Microgrids achieve resilience through redundancy in generation, while fractal grids achieve resilience through redundancy in network infrastructure.
A microgrid is a small-scale, partially self-sufficient network, incorporating both generation and demand sources. Microgrids may be connected to the local distribution network, importing or exporting electricity according to system conditions, but may also disconnect from the distribution network and operate as an island. As a microgrid can meet some or all of its own demand, it is more resilient to wider system failures, caused by a fault or cyberattack, than a radial network, and is well suited for critical functions such as hospitals, military installations or data centres. As microgrids are self-sufficient, they may require more on-site generation than conventional networks. The deployment of on-site generation in microgrids may result in a larger volume of generation assets in the wider electricity system, implying a degree of asset redundancy and an increase in costs. In principle, the redundancy can be mitigated if sufficient generation is deployed to serve only essential loads when islanded. A microgrid can aggregate its resources like a virtual power plant to coordinate trading with the wider electricity system. This aggregation can be accomplished by a central controller, or potentially by peer-to-peer communication of individual microgrid resources, without a central controller. Figure 36 shows the structure of a microgrid with some of these features.

Source Vivid Economics
A microgrid contains generation and flexible resources, as well as sources of electricity demand.
A fractal grid is a new network structure currently at the concept stage. A fractal grid combines the economy of radial networks, where redundancy is minimal, with the resilience of meshed networks, where nodes are connected by multiple links. The fractal grid achieves these properties through use of a fractal, or recursive pattern, where multiple sets of links with the same structure are connected in a parent-child relationship. Failure of a single link does not prevent power flow between nodes, and the fractal architecture can accommodate microgrids that are able to island themselves during wider system failure. Proponents of fractal grids note that most urban spatial areas already have a fractal structure, so a fractal grid system would be easy to develop in cities. There are several fractal grid demonstration projects ongoing. For example, CleanSpark’s FractalGrid has a federated structure that connects microgrids in a parent-child relationship. Microgrids in the FractalGrid can share their generation and services with other microgrids to shave peak demand and increase the reliability of the whole system, or they can island themselves to manage generation and load independently. The FractalGrid Demonstration at Camp Pendleton military camp in California and NRECA’s Agile Fractal Grid are other examples of microgrids in a parent-child relationship.
(2) Peer-to-peer electricity trading
Peer-to-peer electricity trading could allow individual owners of small-scale generation, storage and demand resources to participate in electricity markets. Currently, electricity is traded between generators and large electricity suppliers. Virtual power plants are also likely to enter the electricity market. In addition, developments in peer-to-peer electricity trading could facilitate individual owners of small-scale generation, storage and demand resources to trade electricity. Peer-to-peer energy trading is being piloted by several small microgrids. For example, the Brooklyn Microgrid in New York connects generators, distribution lines, batteries and load sources, with trades and electricity flows tracked though a blockchain distributed ledger.
If peer-to-peer trading becomes widespread, it may reduce the role of intermediaries operating the electricity system. Some commentators suggest that blockchain could automate the active participation of large numbers of distributed energy resources, such that an intermediary like a virtual power plant is not required. In future, peer-to-peer electricity trading might take place not only within a microgrid, but between resources at the level of the distribution system, and potentially the transmission system. It is theoretically possible that sufficient automation might reduce the role of system operators in distribution or even transmission, though it is likely that their core roles, managing network constraints and maintaining system security, will remain.
2.2.8 Country Case Studies
This section presents six case studies of network arrangements across five countries: China, the USA, the UK, Germany and Australia. China’s experience illustrates the challenges in providing efficient network infrastructure under complex institutional arrangements and limited use of strategic planning of infrastructure investments. The USA provides a contrasting example of a large territory, with multiple separate transmission systems, that has gone through the liberalisation process under the oversight of a central regulator. PJM, one of the larger US independent system operators, is considered the leading example of state-of-the-art network arrangements. The electricity transmission network in the UK is owned by three separate transmission companies, one of which (National Grid) is also the operator for the whole system. As a TSO, National Grid is subjected to innovative performance-based regulation, though the UK is now moving closer to the ISO model. Germany, like the USA, has several transmission systems, which participate in wider transmission planning, both nationally and with other European system operators. Australia has highly progressive markets for system services, facilitating electricity storage and enabling its use as an alternative to new transmission investments. Each section below discusses for each country the institutional arrangements, the processes for transmission planning and delivery, the extent to which locational pricing has been implemented, and recent developments to prepare for the future challenges of decarbonisation and decentralisation.
(1) China
(1) Institutional arrangements
Liberalisation of China’s electricity sector has progressed in three distinct phases. Before the start of the liberalisation process, the then Ministry of Electric Power owned and operated the generation, transmission and retail of electricity. In 1985, the generation market was opened to private investment to address severe power shortages. Then, in 1996, the ministry was abolished, the State Power Company was established, and the State Economic and Trade Committee took over the regulatory functions of the ministry. As a result, the electricity business was separated from government functions. In 2002, generation was unbundled from transmission and retail; two grid companies, State Grid Corporation of China and China Southern Power Grid, were created; and the State Electricity Regulatory Commission (SERC) was established. Taking the liberalised electricity markets as a model, the reform aimed to create competitive wholesale markets and regulated network tariffs.
After a decade of relatively limited reforms, a new phase of reform is now underway. SERC, which would lead the liberalisation of the electricity sector, was folded into the National Energy Administration in 2008, which is part of the National Development and Reform Commission (NDRC). As the leading planning agency under the Chinese State Council, NDRC defines policies for China’s economic and social development. Transmission and retail of electricity has remained vertically integrated. Prices and network tariffs are still regulated centrally. In 2015, the Communist Party Central Committee and the China State Council published a statement committing to electricity market reform and the introduction of competitive wholesale and electricity markets.
The Chinese electricity sector has a complex institutional framework. Several institutions have overlapping authority over the sector, and there is no mechanism to coordinate the actions of these institutions. All institutions in the electricity sector are overseen by central government.
The Chinese transmission system comprises a set of partially interconnected provincial transmission systems, with some additional interconnections at the regional level. State Grid Corporation of China and China Southern Power Grid are in charge of regional interconnectors, while the regional grid companies control interconnectors between provinces, and provincial grid companies manage the transmission network within their provinces.
The Chinese transmission grid is operated by provincial grid companies. Electricity dispatch and trading centres develop generation schedules and manage congestion. The provincial grid companies schedule annual and monthly generation and also manage ancillary services. Scheduling of generation is determined by provincial governments based on an allocation of operating hours, rather than on need. This causes significant curtailment of renewable electricity, if alternative generators are scheduled to operate at times of high renewable output. In 2015, total renewable curtailment amounted to 1.6% of China’s electricity demand. Figure 37 shows the structure of the Chinese power sector before and after the 2002 reform. The reform aimed to aggregate the provincial markets into six regional markets, but this is still in progress.

Note State-owned companies are in red, privately-owned companies are in blue; SGCC is the State Grid Corporation of China and CSG is China Southern Power Grid. Source Vivid Economics
Structure of the Chinese electricity system.
(2) Transmission investment
Network planning follows a top-down process. The National Development and Reform Commission’s (NDRC) five-year plans define general network investment programmes. These programmes are aimed at driving economic growth, rather than meeting reliability or economic efficiency targets. Provincial governments and local NDRC branches refine these general investment programmes for their administrative territory, typically without stakeholder consultation.
In line with the multilevel structure of the grid companies, investment in the transmission network follows a multilevel structure. State Grid Corporation of China and China Southern Power Grid invest in interconnectors between regions, while the regional grid companies invest in interconnectors between provinces, and provincial grid companies are responsible for the transmission network within their provinces. Construction of transmission networks stretching through several regions requires the involvement of several regional grid companies. There is no merchant involvement in transmission investment.
(3) Level of locational pricing
There is no locational pricing and transmission congestion is not priced. The regulatory bodies, the NDRC and State Electricity Regulatory Commission set the wholesale and retail prices of electricity. Provincial governments amend the centrally set price to achieve local policy and economic development goals.
(4) Modernising network arrangements
China does not have specific procedures to ensure non-network alternatives to new transmission assets are assessed in new transmission planning and investment decisions, though investment in electricity storage is increasing. The Chinese government runs pilot projects and subsidises investment in private battery storage projects. According to Bloomberg New Energy Finance, around 180 MW of battery storage is under development in China. The government’s Golden Sun programme subsidises investment in photovoltaic panels and battery storage.
(5) Summary of arrangements
See Table 3.
(2) USA
The US transmission network consists of interlinked regional transmission networks, each of which covers a large geographic area and has a different institutional model and set of arrangements to the others. Figure 38 presents the regional transmission networks of the USA. While some of them have adopted state-of-the-art approaches and are interconnected with their neighbours, others are isolated and remain vertically integrated from generation to retail. Moreover, five alternating current electricity grids (Eastern, Western, Quebec, Alaska and Texas interconnections) cover the USA and Canada and tie together regional transmission networks, and hence utilities, in their territory.

Source Federal Energy Regulatory Commission (FERC) (2017)
The US transmission system is segmented into several regional transmission networks.
(1) Institutional arrangements
Two federal regulators, Federal Energy Regulatory Commission (FERC) and North American Electric Reliability Corporation (NERC), oversee the US transmission system. FERC regulates the transmission and wholesale sale of electricity in interstate commerce, reviews the siting application for transmission projects, and ensures reliability of the interstate transmission system by setting standards. NERC, overseen by FERC, develops reliability standards and ensures the reliability and security of the power system as a whole.
Before the liberalisation of the US electricity sector, vertically integrated utilities owned and operated generation, transmission and retail of electricity in their area. These utilities were operating in poorly interlinked regional transmission networks covering a single state or a group of states (region). Following large blackouts in the north-east in the 1960s, NERC promoted interconnection of neighbouring transmission networks, so they could exchange power and increase the reliability of the whole transmission system.
The Energy Policy Act of 1992 laid the ground for the liberalisation of the US electricity sector. It opened the electricity market to independent generators and gave FERC the authority to regulate all wholesale electricity transactions.
FERC issued several orders and proposed a standard market design for the US electricity sector. It promoted the unbundling of electricity generation, transmission and retail, with transmission arrangements following the independent system operator/regional transmission organisation (ISO/RTO) model. According to the standard market design, ISO/RTO ensures open access for all generators to the transmission system, manages a competitive wholesale spot market, and controls congestion using locational pricing. ISOs and RTOs have similar responsibilities, and in practice there is very little difference between the legal definition of each. FERC proposed to exercise jurisdiction over transmission owners and operators that had not adopted its standard market design. Many entities challenged FERC’s proposal. Opponents argued that one standard would not fit the needs of different regional transmission systems and asked for a voluntary regional approach, in contrast to FERC’s mandatory approach. During the exchange of proposals between FERC and transmission system entities, several entities with high electricity prices, such as Midwest Independent Transmission System Operator (MISO) and Southwest Power Pool (SPP), adapted FERC’s standard market design to their regional needs and introduced ISOs voluntarily. Following these adaptations, FERC gave up its attempt to mandate its standard market design and pursued a voluntary regional approach.
FERC’s push for a competitive electricity sector and standard market design were received differently by the regional transmission networks. Currently, the US power system consists of 10 regional transmission networks. Three of them (Southeast, Southwest and Northwest) have maintained their traditional vertically integrated utility structure and serve customers directly. The others—California, Midwest (MISO), New England, New York, Northeast (PJM), SPP and Texas—liberalised their markets and adopted FERC’s standard market design. They unbundled generation and retail from their transmission systems and introduced competition in generation and retail. Figure 39 shows the key steps in the evolution of FERC’s standard market design.

Source Vivid Economics
Structure of FERC’s standard market design.
(2) Transmission investment
All ISOs assess transmission adequacy, in consultation with stakeholders. A typical ISO periodically reviews adequacy of current and planned transmission assets with a long-term horizon to identify reliability concerns and address public policy needs. The ISO also organises public stakeholder meetings to ask for comments from generators, transmission owners, retailers, end customers and other interested parties. NERC oversees the planning process.
ISOs and RTOs have adopted different approaches to transmission investment and merchant involvement in these investments. Some ISOs, for example New York ISO, identify investment needs, while transmission owners and merchants propose solutions and carry out the necessary planning and investment. Some ISOs, such as California and PJM, identify transmission investment needs and plan the investments to address those needs. Transmission owners, and sometimes merchant developers, then compete for aspects of transmission investment, such as land rights, operations and costs. The California ISO gives a role to merchant investors, whereas in PJM there is little merchant activity, despite provisions for it.
To improve reliability and increase trade volumes between the regional transmission networks, ISOs and RTOs coordinate their network planning and investment. Neighbouring ISOs and RTOs form committees to develop plans for their regions. Moreover, interconnections provide a platform for collaboration between system operators and coordinate development of interconnection-wide transmission plans and transmission investment. However, these collaborations are limited to interconnections and do not attempt to optimise the national transmission network as a whole.
(3) Level of locational pricing
Following FERC’s order and standard market design, the liberalised electricity markets have adopted locational pricing at varying levels of granularity and apply different approaches to address disadvantages of nodal pricing. As an example, PJM adopted a highly granular nodal pricing mechanism, but it averages nodal prices into hub prices to provide liquidity to parties involved in long-term contracts. CAISO followed a less granular nodal pricing mechanism than PJM. It argues that high level granularity increases costs and system complexity, while not providing significant benefits to compensate for these drawbacks.
(4) Summary of arrangements
See Table 4.
(3) PJM
PJM is a regional transmission organisation in the USA. PJM (originally named after the Pennsylvania, New Jersey, Maryland Power Pool), operates part of the Eastern Interconnection grid, serving all or parts of Delaware, Illinois, Indiana, Kentucky, Maryland, Michigan, New Jersey, North Carolina, Ohio, Pennsylvania, Tennessee, Virginia, West Virginia and the District of Columbia. PJM operates more than 82,000 miles (132,000 km) of transmission lines and coordinates 1,373 generating sources with 176,569 MW of generation capacity. Around 65 million people live in the PJM area. There are 20 transmission owners serving their respective transmission zones in PJM.
(1) Institutional arrangements
In 1927, three vertically integrated utilities interconnected their systems to exploit benefits and efficiencies from sharing their generation resources. In doing so they founded the world’s first power pool, PJM. The pool carried out least-cost constrained dispatch to reduce costs for pool members. Later, other utilities joined the pool and extended its area of coverage. Until the beginning of the 1990s, member utilities took turns to operate PJM.
In the 1990s, following the liberalisation of the US electricity market and FERC’s orders promoting a standard market design, PJM started its transition from a power pool to an ISO. In 1993, the PJM member utilities formed the ISO PJM Interconnection Association, which operated the PJM power pool. In 1997, PJM opened its first bid-based electricity market and provided the underlying trading platform. Later that year, FERC approved PJM as the first ISO in the USA. In 2002, in line with FERC’s standard market design, PJM became an RTO to operate the multi-state transmission network. Figure 40 shows changes in the market structure of PJM over time.

Source Vivid Economics
Structure of PJM’s electricity system.
(2) Transmission investment
PJM carries out a planning process called regional transmission expansion planning (RTEP) to ensure future adequacy of the network. Under the RTEP process, PJM analyses several scenarios to assess the adequacy of network conditions over a time frame of 15 years. RTEP defines the need for and benefits of a transmission project, but review and approval are the responsibility of the member states where the project is located. The transmission investments identified are discussed publicly in stakeholder meetings with PJM members, generators, transmission owners, retailers, end customers and other interested parties.
To develop the best plans for the system as a whole, PJM coordinates its planning process with neighbouring system operators. These include Midcontinent Independent System Operator (MISO), ISO New England and New York ISO. This coordinated planning process seeks to ensure an efficient level of new generation resources and transmission lines across neighbouring systems.
PJM mandates transmission upgrades and extensions that are required to maintain the reliability standards of transmission owners. Under PJM rules, the cost of these projects is allocated to the respective transmission owners. Merchants can also explore interconnection business opportunities in the PJM region. Merchants’ interconnection requests are subject to strict rules and procedures. PJM completes feasibility and system impact studies before approving the interconnection request.
(3) Level of locational pricing
In 1998, PJM replaced zonal pricing with nodal pricing to address inefficiencies caused by transmission congestion. Zonal pricing does not account for transmission constraints in a zone, hence market participants do not internalise transmission constraints in that zone. As a result, in the PJM region transmission congestion was under-priced, and widespread bilateral contracting—without considering network constraints—resulted in significant generation curtailment and redispatch costs. Under the nodal pricing scheme, the prices are discovered for around 2,000 nodes, accounting for transmission constraints between the nodes and minimising inefficiencies. To provide liquidity for hedging instruments, PJM averages nodal prices in given areas into hub prices.
(4) Modernising network arrangements
PJM has not developed specific procedures to ensure that non-network alternatives to new transmission assets are considered in new transmission planning and investment decisions. Nevertheless, it is actively encouraging flexible resources to provide system services. PJM offers retail customers day-ahead and real-time options for emergency load response. Virtual power plants, known in PJM as curtailment service providers (CSPs), act as intermediaries between retail customers and PJM. CSPs help retail customers to reduce their demand in high price periods. PJM also operates a reliability pricing model capacity market. Both demand-response resources and energy efficiency resources can participate in these markets through CSPs and collect payments for reducing their demand and adopting efficiency measures. Demand resources can also participate in PJM’s synchronised reserve, regulation and day-ahead scheduling reserve market.
(5) Summary of arrangements
Pennsylvania, New Jersey, Maryland (and other areas within the Eastern Interconnection) (Table 5).
(4) Great Britain
Great Britain comprises England, Scotland and Wales, whereas the UK comprises all three along with Northern Ireland. Britain has the larger of the UK’s two electricity systems. The smaller is the Northern Ireland system, which is connected to the Republic of Ireland. It is owned by Northern Ireland Electricity Networks and operated by the Irish system operator EirGrid, as part of the island’s single electricity market.
(1) Institutional arrangements
Before market reform, the vertically integrated Central Electricity Generating Board (CEGB) was the statutory monopoly provider of generation and transmission services in England and Wales. The CEGB was subject to cost-of-service regulation and its operations were characterised by high capital costs, low productivity growth, and a low return on assets. Distribution networks were operated by twelve regional monopolies, known as area electricity boards.
In 1990, the CEGB was unbundled and privatised into multiple generating companies and a single transmission company, the National Grid Company. The Electricity Act 1989 led to the creation of the Office of Electricity Regulation (OFFER) and the Director General of Electricity Supply (DGES). Their role was to regulate the transmission network monopoly of National Grid and the distribution network monopolies of the regional electricity companies and set price caps with periodic reviews. The act also established competition in generation, with the requirement that generators compete by selling power in a wholesale market.
Today, National Grid is the transmission system operator (TSO) for Great Britain. There are three onshore transmission owners (TOs) in Britain: National Grid Electricity Transmission for England and Wales, and Scottish Power Transmission and Scottish Hydro Electric Transmission for Scotland. Driven by European Commission directives on unbundling, offshore transmission assets are owned by offshore transmission owners (OFTOs), with owner-operators chosen by competitive tender run by the power sector regulatory body, the Office of Gas and Electricity Markets (Ofgem). Figure 41 shows the structure of key parts of the British power system before and after liberalisation in 1990.

Note State-owned companies are in red, privately-owned companies are in blue. Source Vivid Economics
Structure of the Great Britain electricity system.
National Grid’s operations as transmission owner (TO) and system operator (SO) are subject to performance-based regulation by Ofgem. These functions are subject to separate incentive regimes. Transmission ownership is regulated through periodic price reviews, currently occurring every eight years. Following privatisation, this took the form of the RPI-X (retail price index minus x) framework, which has since been replaced by the RIIO (revenues = incentives + innovation + outputs) framework as described in 2.2.6 above. System operator regulation is revised every two years and is designed to incentivise efficient balancing, data provision and modelling.
As well as core system operator functions, National Grid also acts as the delivery body for the UK government’s decarbonisation policies through electricity market reform. As an SO, it is required to contribute to the drive for competition in onshore transmission and act as the delivery body for new market arrangements, such as the capacity mechanism and contracts for difference schemes. The capacity mechanism is the UK’s capacity market to ensure security of supply. Contracts for difference are feed-in tariffs that provide price support for newly contracted low-carbon generation.
The institutional model for the transmission network is moving closer to the independent system operator (ISO) model. In August 2017 Ofgem and National Grid confirmed the separation of National Grid’s system operator business into a legally separate company within National Grid plc. This will take effect from 2019 onwards and will bring the British power grid’s structure closer to the ISO model. The case for separation is based on a greater planning and delivery role for the SO, as well as removing the risk of conflict of interest between TO and SO functions going forward.
As an SO, National Grid is the delivery body for electricity market reform. Under Ofgem’s new integrated transmission planning and regulation (ITPR) framework, National Grid is obliged to identify, plan and recommend transmission investment projects. The case is further strengthened by the underlying trend of decentralisation, which increases the need for coordination of the planning and operation of transmission and distribution systems by an SO.
(2) Transmission investment
Traditionally, planning, development and regulation of onshore transmission in the UK has been implemented by regulated monopoly TOs. In the future, transmission planning in Great Britain will take place under Ofgem’s integrated transmission planning and regulation (ITPR) model. Under this framework, the SO has new responsibilities to recommend transmission investments through the network options assessment (NOA) process. However, final implementation decisions remain in the hands of TOs.
National Grid currently owns all onshore transmission assets in England and Wales, with investment regulated through Ofgem’s price control mechanism. It has traditionally held sole responsibility for the planning and delivery of investments in both countries, and occasionally coordinated with Scottish transmission owners on major projects with nationwide impact. This is set to change, with Ofgem developing a framework for competitive tendering in onshore transmission, although there has been no substantial non-incumbent transmission investment to date. Historically, the regulatory asset value (RAV) approach to TO revenue regulation has tended to favour capital expenditure-based solutions, with little incentive for TOs to present innovative, non-asset intensive solutions which would face greater regulatory scrutiny. The outcomes-based framework of Ofgem’s RIIO regulatory model sought to address these issues.
Efficient offshore transmission will be vital to achieve decarbonisation in the UK, with investment requirements to 2030 estimated at £8-20 billion, perhaps even exceeding onshore investment needs. To achieve this, Ofgem developed a new offshore transmission investment regime. Windfarm developers plan and build offshore transmission assets, which they are then obliged to divest as part of the European Union’s unbundling directives. Competitive auctions are then held for the rights to own and operate these offshore assets, known as offshore transmission licences. Licences are allocated to offshore transmission owners (OFTOs), who are required to be independent of both onshore TOs and offshore wind generation developers. Ofgem’s decision not to extend National Grid’s onshore transmission monopoly to offshore assets was based on a desire to promote competition and achieve more efficient outcomes. National Grid subsidiaries may participate in offshore transmission auctions but separated from National Grid’s existing TSO business to avoid unfair advantages through its privileged position as system operator.
Interconnections with continental Europe and Ireland are largely owned by National Grid, alongside overseas partners. These assets are mainly governed by European Commission directives which determine operational and revenue models. As interconnectors are not classified as either demand or generation, they are exempt from transmission tariffs. This can lead to suboptimal siting signals and a lack of coordination between interconnection assets and onshore transmission planning and investment.
(3) Level of locational pricing
Transmission charges, known as transmission network use of system (TNUoS) tariffs, are set to provide efficient economic signals to grid users by reflecting the additional costs TOs incur in serving them. While electricity in England and Wales lacks full nodal pricing of the type seen in PJM and some other regions, TNUoS tariffs have a locational component which aims to reflect the difference in cost impacts users have at different locations in the grid.
The location varying element of TNUoS tariffs aims to capture the investment, maintenance and operating costs of connecting different locations in the transmission grid. Tariffs are derived from the DC load flow investment cost-related pricing (DCLF ICRP) transport model. TNUoS tariffs also have a non-location varying or residual element, to recover the costs of historical investment.
The TNUoS pricing regime has been criticised for having a high degree of cost socialisation, with around 75% of system costs recovered from the flat residual tariffs. A high degree of cost socialisation leads to inefficient siting signals, as the TNUoS tariffs faced by generators do not adequately reflect the cost of providing them with transmission services.
(4) Modernising network arrangements
In July 2017, Ofgem published a plan setting out future actions needed to deliver a smarter, more flexible energy system. In this plan, Ofgem set out its intention to facilitate the participation of both storage and demand response in the electricity system:
-
Facilitating the participation of storage. Ofgem commits to review network charges for electricity storage, which currently incur network and balancing charges for generators and consumers, despite its role in reducing the requirement for new network investments. Ofgem also commits to define storage in primary legislation and to clarify its regulatory status within the electricity system and planning regimes.
-
Facilitating the participation of demand response. Ofgem commits to allow revenue stacking between the capacity market and ancillary services market, following concerns that market rules prevented demand-side response providers from participating in both markets; and to reform the balancing mechanisms (the procurement mechanism for residual balancing) to allow virtual power plants to participate directly in energy supply and facilitate more demand-side response in residual balancing.
In line with these reforms, National Grid has also committed to reform the procurement processes for flexible energy resources. In June 2017, National Grid published its System Needs and Product Strategy to address key challenges to the deployment of flexible energy resources in Britain’s electricity markets:
-
National Grid identifies the number of products, lack of transparency over product specification and unclear assessment criteria for product parameters as key challenges to the deployment of flexible energy resources. First, the set of products offered for system services is large and complex (providers can choose from more than 20 different products, each with different technical requirements and routes to market). Second, there is a lack of transparency in product specifications, which vary with system conditions and which themselves are the result of underlying conditions. Third, assessment criteria are unclear, as the system operator does not specify the importance and value it attaches to key parameters, such as length of contract or speed of delivery, in the products it procures; and overlapping markets, where more than one product exist to solve the same system problems, each with different procurement processes.
-
National Grid commits to simplify the products for system services through rationalisation, standardisation and improvement. National Grid commits to three actions. First, to carry out a review to reduce the suite of products that it procures, to remove products that are no longer required in their current form, or have been superseded by later products, and offer market-based alternatives where possible. Second, to standardise products within each service market, with standardised parameters such as contract length (e.g. 1 month, 6 months, 1 year, 2 years) and speed of delivery of reserve energy (e.g. 2, 5, 10 or 20 min). Third, to improve the products procured to better suit the technical abilities and economic characteristics of the assets providing the services.
Alongside these reforms, the UK energy networks industry is planning the reforms required to deliver the smart grid. The Energy Networks Association, the industry body for owners and operators of gas and electricity networks in the UK, has set up the Open Networks Project, an initiative to reform the operation of electricity networks and underpin the delivery of the smart grid. The Open Networks Project’s objectives include developing improved processes for transmission system operators (TSOs) and distribution system operators (DSOs) in connections, planning, shared TSO/DSO services and operation; and developing a more detailed view of the required transition from a distribution network operator (DNO) to a DSO, including the impacts on existing organisational capability.
(5) Summary of arrangements
See Table 6.
(5) Germany
(1) Institutional arrangements
Before liberalisation, the German electricity sector was characterised by regional monopolies at three levels. At the supra-regional level, eight network energy supply companies, each active in its own region, produced around 80% of all electricity. Four of these were vertically integrated from generation to retail, while the other four were vertically integrated across generation and transmission only. All eight companies also provided electricity to regional energy suppliers. At the regional level, around 80 energy supply companies generated electricity (10% of total electricity), managed the distribution network and supplied electricity to end consumers or municipal utilities. At the local level, around 900 municipal utilities generated the remaining 10% of total electricity, managed the municipal distribution networks and supplied electricity to end consumers.
The German electricity sector went through a structural change in the 1990s and 2000s. Territorial monopolies were abolished and generators gained access to end consumers in other territories. In the mid-2000s, following the EU’s Electricity Market Directive, Germany unbundled generation, transmission, distribution and retail in its electricity sector, but allowed different degrees of unbundling. The levels of the supply chain could be separated completely, legally or functionally, resulting in a complex and heterogenous structure. Unbundling of transmission and generation took place in 2005, while unbundling of distribution and retail was completed in 2007.
Germany’s transmission network now consists of four different transmission systems, with different institutional models. Two of these are based on the TSO model, with TenneT and 50 Hz owning and operating their networks. A further two retain a degree of vertical integration, with the generation companies RWE and EnBW continuing to own transmission assets, though these are regulated to mitigate conflicts of interest.
There are around 900 distribution operators serving 20,000 municipalities in Germany. The 900 distribution operators include four of the formerly vertically integrated supra-regional network energy supply companies, a number of regional companies and around 700 municipality-owned utilities. Often municipality-owned utilities are vertically integrated from generation to retail.
At the national level, the federal network agency (Bundesnetzagentur) regulates the German electricity sector and has various responsibilities. It oversees competition in the electricity sector and unbundling of vertically integrated companies and ensures non-discriminatory access to the transmission and distribution networks. Bundesnetzagentur also regulates charges levied by transmission and distribution system operators. Since 2009, the TSOs are subject to regulation that caps grid tariffs, but which also provides incentives to increase efficiency and reduce costs. At the state level, 11 state regulatory authorities enforce regulations, while the other five states have delegated all their regulatory responsibility to the Bundesnetzagentur. Grids with more than 100,000 customers, or covering more than one state, are also overseen by the Bundesnetzagentur. Figure 42 shows the structure of the German power sector before and after liberalisation and unbundling.

Note All segments of the German electricity system contain a mix of privately and publicly owned companies. Source Vivid Economics
Structure of the German electricity system.
(2) Transmission investment
The TSOs are responsible for transmission planning and investment. Together, they draft a framework that forecasts developments in the German electricity market over the next decade under different scenarios. After the federal network agency, Bundesnetzagentur, reviews and approves the framework, the TSOs define their transmission investment in line with the framework and draft a network development plan. If the investment project is located in one state only, it is submitted to the state government concerned for approval. If the investment project involves more than one state, the federal network agency makes the final approval decision.
The TSOs coordinate their operation and transmission planning with each other, with TSOs in other European countries and with power exchanges, in order to use existing generation and transmission capacities efficiently. The European TSOs participate in regional security coordination initiatives (RSCIs) to harmonise their electricity system operations. Developed voluntarily by the TSOs, RSCIs are service providers with no live system operation capabilities. They coordinate security analysis, short- and medium-term adequacy forecasts, capacity calculations and outage planning. The TSOs use services provided by RSCIs as input alongside with national factors for their final decision-making. Neighbouring TSOs collaborate to develop regional RSCIs, but they are currently working on a European-wide, central verification platform. The European TSOs will submit their planned energy exchange to this single central platform that will compare and coordinate the TSOs’ actions.
The TSOs make investments in transmission assets. Merchants are involved in consortiums that invest in interconnectors that link Germany to its neighbours.
(3) Level of locational pricing
Germany does not have locational pricing on transmission and faces rising redispatch costs as a result. The federal network agency reported that in 2014 the TSOs intervened in generation and redispatched on 330 days. The intervention concerned 5,197 GWh of power and cost €186.7 million. Redispatch costs are passed on to end consumers. In 2015, the costs increased to €402.5 million.
Transmission charges levied by the TSOs do not have any temporal (time-of-use) or locational component.
(4) Modernising network arrangements
Germany has an increasing share of intermittent renewable energy in its electricity mix. It aims to introduce flexible non-network services to integrate intermittency of renewable resources efficiently and thereby improve the reliability of its electricity sector and supply security.
TSOs allow retail end customers to auction for demand curtailment. The TSOs can enter into contracts with end consumers to curtail their demand at short notice when demand peaks. The TSOs compensate end consumers whose demand is curtailed with a fee. The level of the fee is set in weekly auctions. The auctions are designed for medium and large industrial end customers with high power consumption, but residential customers can also participate in the auctions through aggregators.
There are several pilot projects and public funding available for battery storage. For example, Younicos built a battery park in Schwering to assist the distribution grid with frequency regulation and integration of wind energy. Similarly, ENERCON provides primary control services to Feldheim, whose energy mix is 100% renewables. Since 2013 the German government provides grants to incentivise battery storage of energy generated by photovoltaic panels.
(5) Summary of arrangements
See Table 7.
(6) Australia
(1) Institutional arrangements
Before market reform, Australia’s power market comprised vertically integrated state-owned monopolies. Examples include the State Electricity Commission of Victoria and the Electricity Commission of New South Wales. State governments appointed boards of commissioners which were responsible for the operations of the companies. This structure was also present in Australia’s other regulated industries and was characterised by low productivity growth and inefficient performance.
The electricity sector underwent market reform in the 1990s, with a move towards private ownership that began with the breakup of vertically integrated monopolies into generation, transmission, distribution and retail components. In the late 1990s, generation and retail were largely privatised, with some transmission and distribution companies following suit. The National Electricity Market (NEM) began operations in 1998 as Australia’s first wholesale spot market. To facilitate the new power pool, market reforms were accompanied by significant investment in interconnection capacity, making NEM one of the world’s longest interconnected systems.
NEM covers the five interconnected Australian states of Queensland, New South Wales, South Australia, Victoria and Tasmania, and represents 89% of the country’s generation capacity. The Australian Energy Market Operator (AEMO) is the ISO. Alongside traditional SO functions, AEMO publishes a long-term transmission programme known as the National Transmission Network Development Plan (NTNDP) and makes regional demand forecasts as part of its role of national transmission planner. AEMO is also directly responsible for transmission planning in the state of Victoria. Transmission services are provided by a transmission network service provider (TSNP) for each state and which are jointly state- and privately owned. There are 13 major distribution networks, each of which is a monopoly provider in its designated region. The market is regulated by the Australian Energy Regulator (AER). The structure of the Australian power sector before and after the formation of the NEM is shown in Fig. 43.

Note State-owned companies are in red, privately-owned companies are in blue. Segments containing a mix of privately and publicly owned companies are in grey. Source Vivid Economics
Structure of the Australian electricity system.
(2) Transmission planning
While AEMO conducts transmission planning in Victoria, TOs in other states are responsible for their own investment planning. TOs are required to publish annual planning reports (APRs) analysing their proposed network investments over the next five years. TOs have to take into account AEMO’s National Transmission Network Development Plan (NTNDP) or risk financial penalties. They coordinate their plans with those of the distribution companies in their networks. While TOs are obliged to take the NTNDP into account, they retain autonomy over final planning decisions.
The NTNDP sets out AEMO’s strategic national vision for transmission planning over a period of 20 years. Consistent with requirements for TOs, AEMO takes recent APRs into account when preparing its national transmission development plan. The aim of the NTNDP is to provide a long-term focus for investment planning and inform TOs of likely future developments, rather than influence individual investment decisions. The entire planning process is designed to create a positive feedback loop between AEMO, TOs and distribution companies, which may lead to better coordinated and more efficient transmission planning.
When considering major new transmission investments, TOs are required to perform a cost-benefit analysis known as the regulatory investment test for transmission (RIT-T). The process involves compiling a complete list of network and non-network investment solutions, with the help of stakeholder engagement, and choosing the solution with the highest expected return. Cost categories considered include construction and other asset provisions, operation and maintenance, and regulatory compliance. Benefit categories include more efficient dispatch, increased security of supply, reduced need for other investments, lower network losses or ancillary service costs, and contribution to renewable generation targets.
AEMO provides only a monitoring role in this process, ensuring that TOs comply with the RIT-T protocol. The procedure applies only to projects involving network enhancement, not to maintenance, and only when an option’s costs exceed AUD 5 million. In Victoria, AEMO is directly involved in transmission planning and operates a competitive tendering process for projects that do not affect the assets of the incumbent TO, AusNet Services.
The Australian Energy Market Commission (AEMC) recommended enhancing AEMO’s role in developing national transmission plans and in overseeing TO planning and investment tests. The commission also found that Victoria had similar levels of reliability and service, but paid less in achieving this, suggesting that AEMO-led investment planning is more efficient than incumbent TO planning. This could be due to the regulatory asset value (RAV) approach, which can lead to conflicts of interest and incentives for gold-plating (the more a TO spends on infrastructure, the more it gets paid by the government).
(3) Level of locational pricing
The NEM uses a hybrid of full nodal and zonal pricing, in which the price at each connection point is determined relative to the price at a common regional reference node. The spot price at each network connection point is calculated as the regional reference node price multiplied by a factor that accounts for intra-regional losses associated with that connection point. Under this system, costs of supply are generally higher for loads further from the regional reference node, reflecting higher losses. When capacity constraints are non-binding, prices across regions will vary based on network losses only. By contrast, when congestion occurs, differences in regional prices will depend on marginal generation costs in each region.
Spot prices in each reference node are calculated as the time-weighted average of dispatch prices and vary every 30 min. Dispatch prices are determined through central dispatch at each node and vary every five minutes.
(4) Modernising network arrangements
A set of market-based arrangements for frequency control, known as frequency control ancillary services (FCAS), has been in place since 2001. FCAS provides eight separate real-time spot markets for frequency control. These markets are considered highly progressive: they are market-based with standardised parameters. For example, products to raise or lower frequency are specified for 6-second, 60-second and 5-minute response times. This contrasts sharply with markets for ancillary services in other countries, such as the UK, where products do not have standardised parameters and are not open to providers across all technologies.
Automaker and energy company Tesla built the world’s largest electricity storage facility in South Australia in 2017 to provide frequency response under FCAS:
-
In 2016, Southern Australia experienced a catastrophic state-wide power outage (black system event), in which more than 800,000 customers lost power supply. In the initial stages of the system failure, high wind speeds damaged transmission lines, causing sequential faults and a dip in voltage. This led to an interconnector failure, islanding of Southern Australia from the remainder of the NEM, and supply failure as the system could not be balanced.
-
A lack of inertia caused by high volumes of renewable generation in the system was found to be a key factor in the outage. South Australia has high levels of wind generation, which accounted for more than 40% of its power in 2016. Traditionally, fossil-fired thermal plants have played a key role in managing such events, acting as synchronous generators that provide real-time frequency response. Wind turbines lack this capability, increasing the risk of entire power network failure in the event of asset loss.
-
Utility-scale storage units have been developed in Southern Australia by Tesla to address these issues. Tesla built a 100 MW battery installation in 2017 that is capable of providing power to 30,000 homes in the event of a blackout. The facility was funded by South Australia’s $150 million Renewable Technology Fund that supports renewable energy projects. The facility adjoins the 100 MW Hornsdale 2 wind farm, allowing the batteries and wind farm to provide fast response services together in the case of a network fault, and to time-shift wind capacity and help meet peak demand periods.
(5) Summary of arrangements
Australia (National Electricity Market, NEM) (Table 8)
3 Drivers, Supporting Conditions and Pathways for China’s Energy Revolution
The history of human society is closely linked with energy supply changes. Fossil fuels like coal, oil and gas have driven the industrialisation and modernisation of global society. However, after more than two centuries of industrialisation, the energy system dominated by fossil fuels has brought severe environmental pollution and greenhouse gas emissions. Safeguarding the environment and combating climate change are perhaps the two biggest challenges facing the world, and the transition to a low-carbon global energy system is now an irreversible trend. Human society is entering a new era of energy transition from high carbon to low carbon, from low density to high density, and from black to green.
3.1 New Features in Energy Development Are the Foundation of the Energy Revolution
From 2012, China’s economic development entered a new normal of slowing growth, structural optimisation and a shift in drivers. Understanding, adapting to and leading the new normal is a major issue in China, both now and in the near future. Meanwhile, developments in the energy sector are also changing, sharing some of the features of the new normal: slowing growth in energy demand, a gradual shift of growth drivers from manufacturing to services and households, the emergence of new business models and smart energy, an increase in renewable energy and the continuous optimisation of the energy mix, and success in supply-side reform.
3.1.1 Slowing Growth in Energy Demand
In the new normal, energy consumption shows a clear slowdown in growth. In this century, China’s total energy consumption has almost tripled from 1.47 billion tonnes of coal equivalent (Btce) in 2000 to 4.3 Btce in 2015. This average annual growth in energy consumption of 7.42% produced an average annual economic growth of 9.6%. Although high, the growth rate has in fact been slowing down. In 2006–10, the average annual growth rate in energy consumption was 6.65%, down 5.55 percentage points from 2001–05. In 2011–15 it dropped to 3.58%, down 3.07 percentage points from 2006–10. In general, the current slowdown in energy growth matches that of the economy, thanks to proactive industrial restructuring, continuous efforts to improve energy efficiency and reduce emissions across all industries. These are the principal features of China’s new normal and the foundation of the energy revolution.
3.1.2 Energy Growth Drivers Are Shifting from Manufacturing to Services and Households
Traditionally, as drivers of energy use weaken, new ones gradually arise to take their place. Take power consumption, for example. Average annual growth in power consumption in the tertiary (service) industries and in households during the 12th Five-Year Plan (2011–15) was 4.8 and 2.4 percentage points higher respectively than in the secondary (manufacturing) industries. In 2016, power consumption in the service industries and households grew 11.2% and 10.8% respectively, much faster than the growth in manufacturing (2.9%). This shows that the major driver for power consumption growth is shifting from high energy-consuming industries like manufacturing to the service industries and households.
3.1.3 Growth of New Energy Business Models Represented by Smart Energy and Internet+
A third driver of the energy revolution is the integration of energy with digital and Internet technologies. The rapid development of smart energy and Internet + (Energy Internet) is expected to diversify energy production and supply and stimulate new business models. Energy carriers will shift from single supply mode to a diversified one, in which conventional coal businesses, utilities and oil and gas companies transform themselves into integrated energy suppliers with multiple types of energy sources and the flexibility to provide various energy services that meet different user requirements. Internet + smart energy technologies can coordinate and optimise the control of energy storage equipment and controllable loads by: (1) building information interconnections between distributed energy systems and users and between various local energy networks; these will leverage the spatio-temporal complementarity of distributed power supply systems in a wide area network and the system control capacity between energy storage equipment and demand-side controllable resources; and (2) enabling “horizontally complementary energy sources and networks and the vertically coordinated development of energy sources, networks, loads and energy storage”. These measures will help control the impacts of intermittence on local grids and are a feasible way to connect distributed renewable energy at scale, thus substantially increasing the share of clean electricity in the energy mix.Footnote 6
As the Internet + smart energy sector develops, its most striking feature is the rapid growth of electric vehicles (EVs). On the one hand, EVs are electrifying the transport system, which reduces oil dependency in socioeconomic development. On the other hand, EVs are the only way to fully connect the transport sector with Internet + and build a new and modern intelligent transport system enabled by artificial intelligence technologies, including remote control and unmanned driving. By 2016, China’s EV ownership exceeded 1 million cars; there were more than 150,000 public charging stations and more than 200,000 private recharging points.
3.1.4 More Clean Energy and Optimisation of the Energy Mix
Global energy systems are increasingly turning to clean electrification.Footnote 7 They are investing in and developing clean power generation and new technologies like smart energy and the Energy Internet to create a new power supply system of integrated distributed and centralised energy. Such a system will increase electrification levels in manufacturing and living. And they are decarbonising non-electricity energy applications in industry and transport by replacing conventional fossil fuels with biomass and hydrogen and by developing and deploying carbon capture, utilisation and storage technologies.
Currently, China is substituting oil and gas for coal, and non-fossil fuels for fossil fuels. In 2016, coal’s share of China’s total energy consumption was 62%, down 6.5 percentage points from 2000; whereas the share of natural gas and fossil fuels was 6.4% and 13.3% respectively, up 4.2 and 6 percentage points from 2000. In particular, the slowdown in energy consumption growth, which began in 2013, provided an opportunity to optimise the energy mix. The share of coal consumption in 2016 was 5.4 percentage points lower than in 2013, and the share of fossil fuels and natural gas consumption in 2016 was 3.1 and 1.1 percentage points higher respectively than in 2013 (Table 9).
3.1.5 Early Successes in Energy Supply Reform
As China’s economic development entered the new normal, its rapidly growing energy industry—driven by the traditional modes of supply and demand—began to show inadaptability and regional and structural overcapacity. In response, the national government implemented energy supply-side reforms and reported its initial success in 2016. First, coal overcapacity was cut by 250 Mt annually. Second, the installed base of power generation became cleaner: more than 200 GW of coal-fired generating units were upgraded and made more energy efficient, more than 100 GW of coal-fired generation was upgraded to ultra-low emission standards, and the installed capacity of non-fossil energy rose to 36.1% of the total. Third, substituting clean energy for fossil fuels was vigorously encouraged. This included the installation of electric heating in homes and electric boilers in manufacturing facilities, as well as clean heating demonstration projects using renewable energy in provinces such as Inner Mongolia, Hebei and Jilin. Fourth, the NDRC’s Opinions on Accelerating the Use of Natural Gas was introduced to drive fast and coordinated development along the natural gas value chain—upstream, midstream and downstream.
However, to transform the traditional energy system into a clean, low-carbon, secure and efficient modern energy system requires some deeply seated conflicts and issues to be addressed urgently. First, the excessive production and use of coal remains unsolved. The measures to cut overcapacity, implemented in 2016, haven’t resolved oversupply. Cutting overcapacity will remain the industry’s main focus over the next 3–5 years. Second, the slowdown in growth in power demand is at odds with the rapidly increasing installed capacity of new power generation. As it takes time to improve peak-shaving capacity, there are still difficulties in connecting renewable energy to the grid. Wind, solar and hydro curtailments will remain for some time. Third, as the coal-fired generating units under construction in the latter part of the 12th Five-year Plan (2011–15) are put into operation, the total number of operating hours of coal-fired generating units are predicted to fall to around 4,100 in 2017. Meanwhile, as the price of coal returns to a reasonable level, the risk of operating at a loss increases across the entire coal-fired power generation sector. Fourth, the development of natural gas is still restricted by its comparatively expensive price. There are numerous difficulties in deregulating the natural gas end-use pricing system, which are slowing the growth of downstream gas consumption.
3.2 Five Drivers of the Energy Revolution
3.2.1 Changes and Diversification in International Energy Supply
According to the forecasts of energy companies like BP and agencies like the U.S. Energy Information Administration (EIA), global energy demand will continue to grow slowly. By 2020, total global energy demand will reach 14.6 billion barrels of oil equivalent (boe), and the growth rate will decrease from 2.0% in 2010 to 1.3% in 2020. By 2030, the growth rate will decline to about 1.0%, with global energy demand at 15.4 billion boe.
Meanwhile, with the rise of unconventional energy like shale oil and shale gas, supply is becoming increasingly diversified. Influenced by the shale gas revolution in the USA, other countries in the Americas—including Argentina, Brazil, Canada and Venezuela—are exploiting their rich resources. As the development of unconventional oil and gas increasingly matures, the Americas are expected to become the second Middle East.
According to the EIA, US oil imports dropped to 24% in 2015, in sharp contrast to 60.3% in 2005. The USA is very likely to become a net oil exporter by 2020. Canada’s oil production, according to the IEA’s predictions, will reach 30–60 million barrels per day by 2030. With abundant conventional oil and gas resources, both onshore and offshore, Canada is expected to develop into an energy superpower in the coming years.
As clean energy, renewables will play an increasingly important role in diversifying energy supply. According to the IEA, renewable energy (including hydropower) will account for half of newly added global power output and almost a third of global power generating capacity by 2035, making it the dominant power source.
3.2.2 Stable Economic Development Is a Solid Foundation for the Energy Revolution
Needless to say, China’s socioeconomic development will face unprecedented difficulties and challenges in the future. These include a fall in the working age population, severe overcapacity in traditional industries like steel and mining, low participation in high value-added segments, and increasing exposure to environmental problems caused by intensive industrial development. However, China still holds huge development potential and resilience. It has fully developed industries, rich human resources and rising innovation capability, which provide a solid foundation for future development.
In October 2015, the Fifth Plenary Session of 18th CPC Central Committee adopted the CCP Central Committee Proposals for the Formulation of the 13th Five-Year Plan for Economic and Social Development. Guided by the concepts of “innovative, coordinated, green, open and sharing”, China is expected to make continuous progress in economic restructuring and transformation, and deliver stable and sustainable medium-to-high growth. This will help ensure that the Chinese dream of national rejuvenation will be fulfilled by mid-century. China’s GDP per capita will approach $40,000 (at 2015 prices) by 2050,Footnote 8 an increase by a factor of five on 2015. As a strategic requirement of future socioeconomic development, this increase in GDP per capita will become a solid foundation for the revolutions in energy production, consumption and supply.
3.2.3 Combating Climate Change and Protecting the Environment Are Key Drivers of the Energy Revolution
According to the Fifth Assessment Report (AR5) of the Intergovernmental Panel on Climate Change (IPCC), the rise in global average surface temperature between 1951 and 2012 was 0.72°C, almost double that of 1880. Global warming has become an indisputable fact. Almost 200 ratifying countries agreed on the Paris Agreement in 2015. They identified the long-term goal of keeping the increase in global average temperature to well below 2°C, and even limiting the increase to 1.5°C by 2100. China has also developed action plans to combat climate change, such as setting the target of reaching peak level CO2 by 2030 or earlier and achieving a 60-65% decrease in CO2 emissions/GDP per capita by 2030, compared to the level in 2015. However, long-term extensive economic development impacts the environment negatively and significantly. In response, China issued the Air Pollution Prevention and Control Action Plan in 2013. Currently, China is making vigorous efforts to control haze and is implementing effective measures to reduce emissions of air pollutants. These include shutting down small coal-fired industrial boilers, substituting electricity or gas for scattered coal, replacing the internal combustion engine with electric vehicles, and using oil of higher quality.
The pressure to combat climate change and control haze is forcing China’s energy industry to develop a clean and low-carbon energy system that will gradually deliver sustainable socioeconomic development.
Substituting electricity and gas for fossil fuels like coal and oil is an important way to optimise the energy system and achieve energy efficiency and emissions reduction. However, electricity and gas are both constrained by system factors: gas by price and the need to overhaul the transmission system; and electricity by costs, and a lack of interconnected nationwide infrastructure and critical technologies. During the ongoing 13th Five-Year Plan (2016–20) and beyond in the medium and long terms, optimisation is urgently needed to improve the level of coordinated energy development.
3.2.4 Innovation Is an Important Support for the Energy Revolution
New business models like the Energy Internet are evolving rapidly and driving the entire energy technology innovation value chain. Taking the overall energy industry and its long-term development requirements into consideration, the Energy Internet, enabled by smart technologies, achieves deep integration of energy and information and new technologies and business models. As the new driver of a rejuvenated energy industry, the Energy Internet will support the steady implementation of the energy production and consumption revolution.
China’s Energy Internet (Internet +) will be achieved through a three-stage strategy:
-
In 2017–20: (i) distributed power generation and storage technologies will be deployed at scale to allow flexible grid connection of various types of distributed energy; (ii) an Internet-based multi-energy trading system will go live; and iii) demonstration projects of multiple interconnected energy networks and energy sources will trigger the extensive use of Energy Internet technologies.
-
In 2021–25: (i) intelligent scheduling between diversified energy carriers will be possible and distributed power generation and storage systems widespread among end users; and (ii) smart and diversified urban energy networks will be established to allow accurate supply scheduling from different sources to meet fluctuations in demand.
-
In 2026–30: (i) new microgrids will be developed nationwide and an interconnecting network of non-fossil energy will be built to help reduce the share of non-fossil energy in primary energy to the target of 20%; and (ii) an open and sharing Energy Internet ecosystem will be formed to significantly improve energy efficiency.
-
After 2030: building on the achievements of the Energy Internet, the use of renewable energy will span many sectors—agriculture, industry, transport, commerce and households. The ecosystem supporting the fast and sound development of renewable energy will continue to improve and push renewable energy development firmly into the fast lane.
3.2.5 Natural Gas Should Play a Dominant Role in the Energy Revolution
According to China’s National Hydrocarbon Resources Assessment (2015), China’s geological gas resources are:
-
conventional gas, including tight gas: 90.3 trillion cubic metres, including 50.1 trillion cubic metres of recoverable reserves;
-
shallow shale gas within a depth of 4,500 m: 121.8 trillion cubic metres, including 21.8 trillion cubic metres of recoverable reserves; and
-
shallow coalbed methane within a depth of 2,000 metres: 30.1 trillion cubic metres, including 12.5 trillion cubic metres of recoverable reserves.
By the end of 2016, the cumulative proven geological gas resources were:
-
conventional gas, including tight gas:Footnote 9 11.7 trillion cubic metres, including 5.2 trillion cubic metres of recoverable reserves;
-
coalbed methane: 692.83 billion cubic metres, including 334.40 billion cubic metres of recoverable reserves; and
-
shale gas: 544.13 billion cubic metres, including 122.41 billion cubic metres of recoverable reserves.
Currently, the conversion rate of natural gas resources to reserves and recovery rate of proven reserves in China are all relatively low. The proven resource rate of conventional gas, coalbed methane and shale gas are 13.0%, 2.3% and 0.4% respectively, so there is a huge potential to recover more resources through technological innovation. In addition, China has made great progress in exploring for offshore natural gas hydrates, of which there is huge resource potential to be unlocked.
Before non-fossil energy technologies mature, natural gas (the cleanest burning fossil fuel) is the best replacement for coal and oil to reduce pollution and greenhouse gas emissions from energy consumption. Even after the technologies mature, natural gas—thanks to its flexibility as an energy carrier—still has great potential for extensive deployment. As unconventional gas resources are still being discovered, it makes sense to make natural gas a dominant energy carrier after coal and oil. This is also a key part of the energy revolution.
3.3 Analysis of Strategic Pathways for the Energy Revolution
3.3.1 Scenario Setting
(1) Strategic pathway design should follow the principle of “letting the targets be the guide”
China’s Strategy of Energy Production and Consumption Revolution is a clear strategic plan for energy development between 2016-30. Using the plan as a guide, this report looks at possible strategic pathways to implement the plan and achieve China’s energy revolution. The report is not about making predictions in multiple scenarios. Rather it focuses on the following three goals identified by China: first, aligning medium- and long-term economic and social development with the goal of building China into a great modern socialist country, as stated by President Xi in his address to the 19th National Congress of the Communist Party of China in 2017. Second, controlling greenhouse gas emissions and air pollution. And third, guaranteeing energy security.
(2) Strategic pathway drivers—economic development, energy security and environmental protection
Research on China’s Medium- and Long-Term Energy Development StrategyFootnote 10 summarises the main drivers of China’s energy development in the future—economic development, energy security and environmental protection—and proposes optimal energy development pathways by balancing the goals of those three drivers. In the traditional economy and energy system, the three drivers are independent rather than integrated: (i) rapid economic growth means more energy consumption, which traditionally means more fossil fuels—this leads to worsening environmental pollution and puts energy security at risk from greater dependence on oil and gas; (ii) the environment-first approach tends to slow down economic growth; and (iii) the security-first approach slows down economic growth and reduces demand.
However, in the new normal of China’s slowing economic growth, and as new energy technologies and business models appear, the integration of economic development, energy security and environmental protection significantly strengthens. In economic development, the traditional growth drivers of real estate and energy-intensive industries gradually slow down, and the new drivers—primarily the high-tech and service industries—begin to take over. This changeover gradually loosens the rigid coupling between economic growth and energy demand. As energy demand growth will mainly come from the service industries and households, the demand for cleaner energy and supply flexibility will grow. The more developed the economy, the greater the demand for clean energy and supply flexibility. This in itself represents a new challenge.
In energy security, the national government has identified electric vehicles (EVs) as the main means of road transport in the future. EV manufacturing and its upstream and downstream industries will see rapid growth. It is possible that the replacement of conventional petrol and diesel vehicles with EVs may escalate at a speed beyond expectation, triggering a rapid shift from oil to electricity as the predominant energy for transport. This will mitigate the long-existing energy security risk of oil import dependency and facilitate the switch to renewable energy in China’s power grids. China is also diversifying into natural gas, thanks to rapid growth in domestic shale gas production and successful pilot exploration of natural gas hydrates. This gradual strengthening of domestic supply capacity will support the substitution of gas for scattered coal at scale, and increase the capacity to use low-cost, high-quality natural gas resources in international markets.
In environmental protection, haze prevention is a major concern. China vigorously promotes measures such as replacing coal with electricity and gas and shutting down small coal-fired boilers. This not only reduces coal-induced pollution, it helps to unlock the market potential for cleaner alternatives like renewable energy, geothermal power and natural gas. Greater use of clean energy creates opportunities for the deployment of Energy Internet technologies, which spurs innovation and encourages new business models.
(3) Strategic pathway scenarios
Based on the above analysis, the scenarios developed in this study are as follows:
-
First, in alignment with the strategic goals set out in President Xi’s report to the 19th National Congress of the Communist Party of China in 2017, China’s socioeconomic development scenario for 2050 forecasts the economic aggregates, industry structure and development of major industries in 2020, 2030 and 2050, which are then used as external input variables to analyse China’s energy supply pathways.
-
Second, in light of China’s socioeconomic development trends, and in accordance with the Strategy of Energy Production and Consumption Revolution (2016–30), the recommended pathway scenario for China’s future end-use energy development is described, based on the present analysis.
-
Third, we present our research on the impact of scattered coal governance and EV development on end-use energy demand. Currently, haze prevention and control is the biggest uncertainty influencing China’s energy supply development pathway. Substituting electricity and gas for scattered coal (SEGFSC) and replacing the internal combustion engine (ICE) with EVs are the two most important ways to prevent and control air pollution. The level of success in both efforts will directly affect China’s future energy supply system. This report analyses both measures and uses the energy system analysis model we developed to conduct sensitivity research on their impacts on the energy system. We developed three scenarios for substituting electricity and gas for scattered coal—High, Medium and Low—and two scenarios for replacing ICE vehicles with EVs—the Recommended and Extreme.
-
Fourth, based on research into end-use energy demand, and in accordance with the need for low-carbon energy development, China’s future primary energy supply is forecast to follow the Recommended scenario for the energy supply revolution.
3.3.2 Socioeconomic Development and Demand for Energy Services
Research on China’s medium- and long-term macroeconomic development draws different conclusions. O’Neill and Stupnytska (2009) estimate that China’s GDP growth rate in 2011–20, 2021–30, 2031–40 and 2041–50 will be 7.9%, 5.7%, 4.4% and 3.6% respectively. In the rapid economic growth scenario where supply-side structural reform is implemented, Li and Lou (2016) believe that the potential average economic growth rate in the 13th Five-Year Plan (2016–20) and 14th Five-Year Plan (2021–25)—neither of which had been published at the time—would be 6.5% and 5.8% respectively. According to Xiao Lin (2016), China’s long-term economic growth will gradually slow down and approach the world average (currently around 3.5%) before settling at 3–4% in 2050. Based on these projections, this report forecasts population trends, growth drivers and development trends for major industries. It uses the SICGE model to make structural predictions and ensure there is consistency in macroeconomic trends, changes in energy demand and shifts in industry structure. It also provides input variables for the energy-environment system analysis model.
(1) China’s population trend
According to the latest statistics of the National Population and Family Planning Commission (NPFPC),Footnote 11 China’s population will peak at 1.45 billion in 2030, 30 million more than the 2015 forecast of the United Nations. At the same time, the number of people aged 65 or older will rise to 350 million in 2050, 2.4 times that of 2015. Those aged 65 or older made up 11% of the population in 2015, compared to a projected 25% in 2050. Correspondingly, future labour supply will decline absolutely, dropping to 830 million in 2050, down 170 million from 2015 (Fig. 44). Population and aging trends are crucial for China’s future economic development.

Source Extension of the predictions of the National Population and Family Planning Commission
Forecast trend of China’s total population and population aging.
(2) China’s growth in floor area
According to research by the Ministry of Housing and Urban-Rural Development, China’s floor space stock in 2015 was around 60 billion square metres. It comprised 17.6 billion square metres of urban residential floor space, 27.6 billion square metres of rural residential floor space, and 14.0 billion square metres of urban commercial floor space. In the experience of developed countries (see Fig. 45), when China’s floor space peaks urban residential floor space per person will be around 40 square metres and public floor space per person around 20 square metres (based on a conversion factor of 0.8 with the floor space per person in developed countries). To ensure steady and sustainable development of the real estate industry, this report suggests that the time-to-peak should be postponed to around 2040, in accordance with the population forecast for that year. Based on the projected population in 2040, the floor space peak will be about 92 billion square metres (see Fig. 46). In this pathway, the rapid expansion of the real estate industry has ended and the annual floor space will decrease from 3.2 billion square metres in the 13th Five-Year Plan (2016–20) to 2.3 billion square metres in the 14th Five-Year Plan (2021–25) and 1.7 billion square metres in the 15th Five-Year Plan (2026–30). As a result, the ability of the real estate industry to stimulate economic growth will continue to weaken.

Source The Standard Quota Department, Ministry of Housing and Urban-Rural Development (MOHURD) (2016)
Comparison of residential floor space per person in selected countries.

Source The Standard Quota Department, Ministry of Housing and Urban-Rural Development (MOHURD) (2016)
China’s floor space predictions.
(3) Trends for major industrial products
(1) Vehicle ownership is expected to increase
In the experience of developed countries, car ownership goes through three stages—slow growth, explosive growth and saturation—as GDP per capita increases. Currently, China’s GDP per capita exceeds $8,000. Judging by the growth in passenger car ownership in recent years, China’s car industry has entered a fast growth stage, which is expected to last until 2035. After which, it will gradually reach saturation and a sharp slowdown in growth. It is projected that China’s vehicle ownership will exceed 500 million in total by 2050 and 350 units per 1,000 people.
(2) Steel output is predicted to decline
Currently, more than 50% of crude steel in China is used in the building sector. As future annual average floor space continues to decline, the demand for crude steel will gradually decrease. It is predicted that crude steel demand will decline to 730 Mt in 2020, 600 Mt in 2030 and 200–250 Mt in 2040. The steel will be used mainly to make mechanical equipment, household appliances and cars. As China’s stock of steel products (equipment, appliances and cars) gradually increases, the recycling rate of scrap steel will also rise and is expected to reach 20% by 2025, 25% by 2030 (the same as in developed countries) and 40–70% by 2050.
(3) Energy use by the nonferrous metal sector is expected to grow steadily until 2030
An important basic raw material, nonferrous metals are widely used to make equipment and products for many industries: power, transport, machinery, electronics and aerospace. As the Made in China 2025 strategic plan is implemented, the nonferrous metal sector is expected to grow annually by around 3% until 2030, which will cause its energy consumption to continuously rise. After 2030, as the stock of equipment and products made of nonferrous metals increases and ore smelting is gradually replaced by recycled scrap metal, the sector’s energy consumption will fall sharply.
(4) Demand for traditional building materials will gradually decrease, while demand for new building materials will significantly increase
As demand diversifies and the low-carbon economy develops, the growth space for traditional building materials (bricks, wood, plaster and stone) gradually narrows. Demand for cement and wall materials is expected to peak in the present 13th Five-Year Plan (2016–20), before contracting. Cement output will gradually decrease from 2.35 Bt in 2015 to 1.8 Bt in 2030, and to 1 Bt in 2050. These traditional materials will be mainly used for the construction and maintenance of public infrastructure and buildings. As floor space continues to grow to 2040, the annual need for maintenance and decoration will also increase, which means growing demand for glass, ceramics, plastics and other new building materials.
(4) China’s economic development to 2050
The 19th National Congress of the Communist Party of China in 2017 identified the strategic goal of achieving the country’s modernisation by 2035 and developing China into a great modern socialist country by 2050. Compared with the previous goal of achieving modernisation by mid-century, the revised target is 15 years ahead of the original timeline. This shows that China has made greater progress than expected and that there is still huge development potential in the long term. By 2035, China’s GDP will reach $33.8 trillion (at 2015 prices), passing the USA to become the world’s largest economy. GDP per capita will be more than $20,000, rising to around $40,000 in 2050, which is above that of moderately developed countries. China’s share of global GDP will exceed 20%.
By 2050, China will have shifted from a production-led to a consumption-driven economy. Manufacturing’s share of the economy will continue to decrease, while that of the service sector will rise from 50.2% in 2015 to 58% in 2035 and around 70% by 2050 (at 2015 prices). In industry, equipment manufacturing and light industry’s share of the economy will increase from 46% in 2015 to 61% in 2035 and 65% in 2050.
3.3.3 Energy Demand to 2050, as Forecast by the Strategy of Energy Production and Consumption Revolution (2016–30)
The Strategy of Energy Production and Consumption Revolution (2016-30) uses the same socioeconomic development analysis as above to forecast China’s energy demand pathway to 2050. It is important to note that this is not a business as usual scenario, but an integrated one that takes such factors as the potential for energy efficiency in various industries, clean energy requirements and economic feasibility into consideration. The energy supply revolution should be carried out on the premise of meeting end-use energy demand (Fig. 47).

Trends in China’s major manufacturing sectors
(1) Agriculture
Agriculture is a low energy-consuming sector. Its share of total end-use energy consumption in 2015 was only 2% and energy consumption per unit of added value of RMB 10,000 ($1,600) was only 0.1 tonnes of coal equivalent (tce). China’s agricultural growth will remain stable for a long time. The one major factor that influences energy consumption in agriculture is mechanisation, which began to improve in 2005. By 2015, agricultural machinery used 1,120 GW of electricity, double that of 2005. As mechanisation and energy consumption rise, cumulative energy consumption per unit of added value falls—by 17% in the past 10 years. In the future, as agricultural mechanisation becomes saturated, modernisation will gradually shift to the use of biotechnology and information technology (IT), which will further reduce energy consumption per unit of added value. When it was adopted in 2016 the 13th Five-Year Plan (2016–20) predicted that agricultural mechanisation would continue to grow and that the amount of energy used in agriculture would approach 66 Mtce by 2020. As the efficiency of agricultural machinery improves and the energy efficiency benefits from biotechnologies and IT become evident, energy consumption in agriculture is expected to decrease to 51 Mtce in 2030, 43 Mtce in 2035 and 36 Mtce in 2050.
Eventually, the use of scattered coal in agriculture will completely disappear, and oil-fuelled machinery will be replaced by electric and biomass fuelled machines. The use of electricity and renewable energy will gradually grow, rising from 28% in 2015 to 54% in 2030 and 87% in 2050 (Fig. 48).

Energy consumption in Chinese agriculture
(2) End-use energy consumption in industry and buildings
In 2015, the industrial and building sectors consumed 88% of coal, 36% of oil, 55% of natural gas and 71% of electricity and heat. In this report, we assess the future energy consumption of industry and buildings. Our assessment is based on trends in high energy-consuming industries—including iron and steel, cement, glass, aluminium, ammonia, ethylene and methanol—and the future industrial development plans outlined in Made in China 2025. As shown in Fig. 49, China’s total energy use in industry and buildings is expected to peak in 2025-30 at about 2.3 Btce, slightly higher than the current level. It is then predicted to steadily decrease to 2.2 Btce in 2035 and 1.9 Btce in 2050. Energy consumption per unit of added value in industry and buildings will steadily decline—by 2050, it is expected to be 80% lower than in 2015.

Energy consumption in industry and buildings
In our scenarios, the assumption is that as the stock of scrap steel increases and the mainstream technologies in iron and steel gradually shift from predominantly long processes (steelmaking starts with iron ore and coke) to equal focus on long and short processes (electric furnace steelmaking starts with scrap steel), the share of short-flow steelmaking technologies will gradually increase to 60% by 2050. The replacement of small industrial coal-fired boilers and kilns will reduce the use of industrial scattered coal. However, as living standards improve and demand for consumer products increases, the use of chemicals in manufacturing will be the only high point in otherwise decreasing demand for coal and oil. Coal’s share of the energy mix will fall sharply from 55% in 2015 to 45% in 2030 and 29% in 2050. Correspondingly, the share of natural gas, electricity and heat will increase from 32% in 2015 to 55% in 2050.
(3) Transport
The energy consumption of the transport sector includes petrol and diesel used by households, wholesale and retail businesses and public services. Some of the petrol used by industry and buildings should also be included. In the future, as more and more families buy vehicles and air travel becomes more popular, energy consumption in the transport sector will grow. However, fuel economy is improving and public transport becoming more prevalent, which means energy consumption per unit will decrease. In our scenarios we have plotted vehicle ownership and unit energy consumption of road, rail, waterborne and air transport to forecast future energy demand. The most important results are as follows: by 2030, due to population growth and higher vehicle uptake, energy consumption in transport will continue to increase, peaking at around 700 Mtce in 2035. It will then slowly decline, reaching 640 Mtce in 2050. Petroleum-based fuels like petrol, diesel and kerosene will still play a dominant role. Demand for these fuels will be 410 Mtce in 2050, but their share of the transport fuel mix will gradually decline from 87% in 2015 to 65% at mid-century. In contrast, electricity and the natural gas and biofuels that replace petroleum will increase significantly to 200 Mtce in 2050, which is 35% of the sector’s fuel mix. Based on China’s medium- and long-term targets for electric vehicles (EVs), it is predicted that EV ownership will reach 3 million units in 2020, 80 million units in 2030 and 270 million units in 2050. The share of EVs in total vehicle ownership will exceed 50% by 2050, with annual electricity consumption reaching 400,000 GWh (Fig. 50).

China’s energy consumption in transport
(4) Services (excluding transport)
The development of the service industries will play an important role in optimising China’s industrial structure and shifting its growth drivers. As the service industries expand, so too will their energy consumption, although this will be constrained by the floor space they occupy. We estimate that energy consumption in services will increase to 350 Mtce in 2035 and 470 Mtce in 2050. Due to modernisation and the use of electricity and gas instead of scattered coal, coal’s share of energy consumption in the sector will rapidly decrease, falling to only 2% by 2030. Internationally, power demand in services is similar to that of households. As such, power consumption in China’s service industries is projected to reach 2.4 trillion kWh by 2050, which is 82% of the sector’s total energy use. As the natural gas distribution system develops, gas demand from large buildings is expected to rise steadily. By 2050, gas consumption in the service sector will reach 75 Mtce, 16% of its total energy use (Fig. 51).

China’s energy consumption in the service sector
(5) Households
As living standards improve, households use more energy. Household energy consumption is expected to reach 520 Mtce in 2035 and 660 Mtce in 2050. By replacing scattered coal with electricity and gas, coal consumption will rapidly decline, from 23% of the household energy mix in 2015 to 4% in 2030 and only 1% in 2050. Liquefied petroleum gas will be gradually replaced by natural gas, decreasing from 44 Mtce in 2015 to 14 Mtce in 2050, which is 14% and 2% respectively of the household energy mix. China’s household power consumption per capita will gradually increase from 540 kWh in 2015 to 1,100 kWh in 2030 and to 2,000 kWh in 2050. Electricity and heat’s share of the household energy mix will rise from 40% in 2015 to 69% in 2050. Natural gas use will reach 120 Mtce in 2050, which is 17% of household energy demand.
(6) Total end-use energy demand
In summary, China’s future energy demand in agriculture, industry and buildings, transport, services and households shows the following characteristics: (i) China’s energy consumption in these sectors will peak around 2040 at 3.8 Btce; (ii) energy demand in agriculture, industry and buildings, and transport will peak around 2020, 2025–30 and 2030–40 respectively, but not until 2050 in services and households; and (iii) the share of coal and oil in the sectors’ energy mix will decrease from 42% and 24% respectively in 2015 to 15% and 20% respectively in 2050. Use of electricity and heat will almost double, from 810 Mtce in 2015 to 1.61 Btce in 2050, and their share of the sectors’ energy mix will increase from 26 to 43%. Electricity demand is expected to reach 7 trillion kWh in 2020, 9 trillion kWh in 2030 and 11.7 trillion kWh in 2050, equivalent to 25.6%, 30 and 38% of the sectors’ energy use (Figs. 52 and 53).

China’s energy consumption by households

China’s overall energy use by sector and type
3.3.4 Analysis of Three SEGFSC Scenarios
The China Energy Statistical Yearbook 2016 estimates that China’s scattered coal consumption in 2015 was 617 Mt: including 120 Mt in coal mining, 93 Mt in households, 90 Mt in chemical production and 260 Mt in services and light industries like food, textiles and equipment manufacturing. Scattered coal accounts for 50–70% of the air pollutants emitted by coal in China (the emissions from burning 1 tonne of scattered coal are equivalent to those from burning 5–10 tonnes of thermal coal in a power plant).Footnote 12 Substituting electricity and gas for scattered coal (SEGFSC) is, therefore, the first measure to prevent and control air pollution. According to China’s Action Plan for the Prevention and Control of Air Pollution and other relevant local policies, the measures for reducing scattered coal use in residential heating include central heating with gas-fired boilers, geothermal heating or waste heat recovery; and using electricity instead of scattered coal in areas where central heating is not possible. The measures for replacing scattered coal with electricity and gas in industry and commerce include shutting down small coal-fired boilers and using waste heat recovery and other energy-efficient technologies (Fig. 54).

China’s use of scattered coal by sector in 2015
Given the gap between China’s Class 2 air quality (35 parts per million, ppm) and the current average air quality in major cities (50 ppm), this report predicts that more than 35% of scattered coal will be displaced by 2020 and about 70% by 2030.
To understand the impact of varying degrees of SEGFSC on primary energy, we made the following sensitivity analysis in three different scenarios: in the High SEGFSC scenario, if scattered coal is to be completely replaced by 2030, more than 35% and about 70% will have to be substituted by 2020 and by 2030 respectively. In the Low SEGFSC scenario, and if there are no additional policy measures after 2017, 20% and 50% of scattered coal should be substituted by 2020 and by 2030 respectively.
Scattered coal consumption in the High, Medium and Low SEGFSC scenarios is shown in Fig. 55: (i) in the Medium SEGFSC scenario, scattered coal use will decrease to 400 Mt in 2020, 180 Mt in 2030 and 60 Mt in 2050; (ii) in the High SEGFSC scenario, scattered coal consumption will decline to 300 Mt in 2020, 60 Mt in 2030, and if the almost complete replacement of scattered coal is achieved, to 10 Mt in 2050; and (iii) in the Low SEGFSC scenario, scattered coal consumption will decrease gradually to 500 Mt in 2020, 300 Mt in 2030 and 200 Mt in 2050.

China’s scattered coal consumption in three SEGFSC scenarios
Based on the assumption that electricity and natural gas each have a 50% share in SEGFSC, and that the efficiency of gas-fired boilers is 90% and the energy efficiency ratio of electric heating is 3.2, demand for electricity and natural gas in the three SEGFSC scenarios is calculated as shown in Table 10.
3.3.5 Analysis of Two EV Development Scenarios
The development of electric vehicles (EVs) is of great importance for China. First, EVs can help reduce fossil fuel consumption in transport and lower CO2 emissions and environmental pollution; second, EVs can alleviate oil supply and demand pressure, reduce China’s dependency on oil imports and improve energy security; and third, as one of the strategic emerging industries, EVs are expected to become a pillar of China’s future economic development.
According to the Strategy of Energy Production and Consumption Revolution (2016–30), China’s EV ownership will reach 3 million units in 2020, 80 million units in 2030 and 270 million units in 2050. From the current industry development trend, however, the possibility of accelerated EV development cannot be ignored:
(i) there is a global boom in EV R&D—mainly around such critical technologies as batteries, automated driving systems, charging infrastructure and support systems—and in issues like leasing, financial services and shared business models. All these factors can speed up the current development trend even more;
(ii) as artificial intelligence technology evolves, automated driving and EVs could become a standard means of future transport, extending vehicles from a travel tool to a home on wheels. Such new travel experiences can help speed up the transition from conventional vehicles to EVs in the medium and long terms; and
(iii) EVs can serve as both a means of transport and a distributed energy storage facility linked to smart grid technologies. They can play an important role in making the most of installed renewable energy capacity and supporting China’s long-term development of renewable energy.
In addition to the Recommended scenario, our report uses an Extreme scenario based on accelerated EV development and the impacts it has on China’s energy supply system (Table 11).
The two EV development scenarios are illustrated in Table 11.
If vehicle ownership remains unchanged and EVs replace mainly diesel and petrol vehicles but not gas-powered vehicles, vehicle energy demand in the Extreme scenario is estimated to be as follows (see Fig. 56): annual consumption of petrol and diesel will decrease by 100 Mt by 2030 and by 130 Mt by 2050, whereas annual electricity demand will increase by 200,0000 GWh by 2030 and by 340,000 GWh by 2050, compared with the Recommended scenario.

China’s total energy use by vehicles in two EV development scenarios
3.3.6 Strategic Pathways for China’s Energy Revolution
(1) Total end-use energy demand
Based on the analysis of China’s energy demand above, our predictions for China’s future end-use energy demand in the SEGFSC, Recommended and EV Extreme scenarios are in Table 12.
In the Recommended scenario, the share of electricity in end-use energy demand will steadily increase from 23% in 2015 to 26% in 2020, 29% in 2030, 32% in 2035 and 38% in 2050. The share of clean energy, including electricity and natural gas, will increase from 30% in 2015 to 50% in 2030, 54% in 2035 and 62% in 2050.
Thanks to the higher efficiency of using electricity and gas instead of coal and oil, end-use energy demand will decrease in the SEGFSC scenarios, though not drastically. Even by 2050, the largest decline will not exceed 4%.
Although faster replacement of scattered coal with electricity and gas will increase demand for both alternatives, the pressure this will create in the energy system is not excessive. In the High SEGFSC scenario, demand for natural gas and electricity in 2030 will be 24 billion cubic metres and 80,000 GWh higher than in the Recommended scenario. Such increases make up only 4% of end-use natural gas demand and 0.9% of end-use electricity demand in 2030, so the pressure they create is relatively small. However, regional and peak-hour supply shortages in the colder months and regions, caused by greater use of electricity and gas instead of scattered coal, should not be ignored.
In contrast, the rapid development of EVs will lead to significant growth in electricity demand. In the Extreme scenario, electricity demand in 2050 will be 0.34 trillion kWh higher than in the Recommended scenario, which increases total electricity demand from 11.7 trillion kWh to 12 trillion kWh. Electricity’s share of end-use energy demand is expected to rise to 40.5%, 2.7 percentage points higher than in the Recommended scenario. Such an increase in electricity demand will require the power system to have sufficient backup capacity or better demand-side management to address the uncertainties in demand from electric vehicles.
(2) Electricity supply
In the Recommended scenario, electricity demand is divided into peak load and ancillary services, intermediate load, base load and distributed load. To ensure the future power supply system is optimised, the following principles should be observed: (i) non-fossil energy power generation should be prioritised in scheduling, but wind power should not be used to address peak load; (ii) gas power generation should mainly be used for peak shaving and for building distributed energy stations; and (iii) coal power should be considered the last resort in the entire power supply system and gradually shift to flexible sources of supply.
As shown in Table 12, the share of clean power (i.e. not coal- and oil-fired generation) will gradually increase from 30% in 2015 to 38% in 2020, 52% in 2030 and to around 80% in 2050. Of this, the share of wind and solar power is expected to increase from 4.9% in 2015 to about 15% in 2030 and more than 25% in 2050. The share of nuclear power will increase steadily from 3% in 2015 to more than 10% in 2030 and more than 20% in 2050. The share of gas-fired power generation will increase from 3% in 2015 to 9% in 2030 and around 10% in 2050. Despite continuous growth in hydropower capacity, its share will gradually decrease from 17% in 2015 to 14% in 2030 and 13.5% in 2050.
In terms of installed capacity, coal-fired power generation in 2020 will be 1,100 GW, after which there will be a flat-growth period until 2030. Installed capacity will gradually decrease to 800 GW in 2050, as decommissioning of coal-fired generating units progresses. Average operating hours of coal-fired generating units will also gradually decrease from about 4,400 h per year in 2015 to 4,000 h in 2020-30, and 3,000 h in 2050. The installed capacity of hydropower (excluding pumped storage) will reach 300 GW in 2020, after which growth will slow down, reaching 350 GW in 2030 and 450 GW in 2050. Gas-fired power generation and nuclear, wind and solar power will grow rapidly. Their installed capacity will reach 220, 136, 420 and 400 GW respectively in 2030, which equates to new installed capacity of 10, 7, 19 and 24 GW annually. By 2050, their installed capacity will have grown to 340, 350, 1,000 and 1,000 GW respectively, which requires new installed capacity of 6, 10, 30 and 30 GW respectively per year (Tables 13 and 14).
In the SEGFSC and accelerated EV development (Extreme) scenarios, China needs to increase the deployment of new renewable energy capacity. In the Extreme scenario, we estimate that 340,000 GWh of additional power will be needed by 2050. Although such an amount could be supplied by an additional 425 operating hours of 800 GW of coal-fired power generating units, this contradicts the goal of promoting renewable energy. If the installed capacity and operating hours of coal-fired and gas-fired power generating units remain unchanged, an additional 260 GW of solar power or 190 GW of wind power will be needed by 2050 to support the development of EVs (Fig. 57).

China’s total power consumption in three scenarios
(3) Demand and supply of primary energy
China’s total demand for primary energy in the Recommended scenario is shown in Table 15. The country’s total primary energy demand is expected to increase continuously from about 4.8 Btce in 2020 to around 5.4 Btce in 2030 and some 5.8 Btce in 2050. Coal demand will flatten by 2020 and decrease thereafter. The share of non-coal fuels is expected to increase gradually from 35.7% in 2015 to 55% in 2030 and 73% in 2050. Oil demand growth will flatten by 2030, and gradually decrease as EVs replace the internal combustion engine. Clean energy will play an increasingly important role in meeting energy demand. The share of non-fossil energy will increase from 11.8% in 2015 to 22.5% in 2030 and to more than 40% in 2050. In addition, increases in electrification will raise power generation’s share of energy supply from 40.9% in 2015 to 48.5% in 2030 and 54.8% in 2050.
Compared to the Recommended scenario, in 2030 total primary energy consumption will be 30 Mtce lower in the SEGFSC scenario and 90 Mtce lower in the accelerated EV development (Extreme) scenario. By 2050 the decrease will be more gradual: 10 Mtce in the SEGFSC scenario and 100 tce in the accelerated EV development scenario. The share of non-fossil energy power generation will increase to 43% in the SEGFSC scenario and 45% in the accelerated EV development scenario in 2050 (Fig. 58).

China’s total primary energy demand and share of non-fossil energy in three scenarios
(4) Fossil energy supply by energy source
Total energy supply by energy source (coal, oil and natural gas) in the three scenarios is as follows:
(1) Coal supply
Coal demand shows a clear decline in all three scenarios, dropping to 3.5 Bt in 2030 and 2.2 Bt in 2050. Correspondingly, coal supply is expected to reach 3.8 Bt in 2030 and 2.4 Bt in 2050. If China’s annual coal imports are 200 Mt, its domestic coal capacity will be 3.6 Bt in 2030 and 2.2 Bt in 2050. As China’s current coal capacity exceeds 5.0 Bt, the major task facing its coal sector is steady capacity cutting. Meanwhile, coal mining safety and production efficiency should be improved.
(2) Oil supply
Although EVs can significantly reduce future oil demand, in the Recommended scenario China’s oil demand and oil processing capacity peak at more than 650 Mt and 720 Mt respectively in 2030. Even in 2050, China’s oil demand will still be around 650 Mt. Demand control and structural adjustment are the major tasks ahead, in particular: improving chemical refining capacity to speed up the shift from oil refining to chemical production.
(3) Natural gas supply
In 2016, China’s domestic natural gas, conventional natural gas and shale gas production was 136.9 billion cubic metres, 123.0 billion cubic metres and 7.9 billion cubic metres respectively, and the volume of coalbed methane surface extraction was about 4.4 billion cubic metres. Natural gas imports in 2016 were 72.1 billion cubic metres, which is 35% of the country’s total gas consumption. China’s natural gas demand is expected to grow rapidly, largely from replacing scattered coal with gas. To ensure that demand can be met, supply capacity needs to improve significantly. If China’s import dependency is consistently controlled at around 35%, then 260 billion cubic metres, 450 billion cubic metres and 490 billion cubic metres of natural gas will be needed in 2020, 2030 and 2050 respectively. Therefore, China still needs to vigorously explore and exploit conventional gas, tight gas, shale gas and coalbed methane. It also needs to drive research on how to exploit natural gas hydrates (Table 16).
4 China’s Energy Revolution: Changes in Primary Energy
4.1 Characteristics of Fossil Energy Supply
4.1.1 Coal: Secure, Clean and Efficient
For a long time, coal has been the dominant source of energy supply in China. Coal makes up more than 70% of China’s total primary energy production and more than 70% of its total power output. However, extensive development of coal resources over a long time has caused severe pollution and environmental damage, and the major coal-producing regions are faced with daunting challenges. Although China’s coal demand is about to peak—in some regions it is already in decline—in the long term, coal will remain a major source of energy. Without a revolution in coal production, the energy revolution will be nothing but empty talk.
Developing coal into a secure, economic, clean and efficient resource is, therefore, an effective way to drive the energy revolution.
(1) Effective control of coal capacity
Low-carbon energy and decarbonisation are the megatrends in energy development worldwide. As the long-term extensive use of coal has caused severe pollution, environmental damage and climate change, a reduction in coal use is inevitable. This will present coal-producing regions with a formidable challenge. The fundamental idea behind China’s coal production revolution is to minimise production. In the next decade, China’s coal capacity will be effectively controlled to no more than 4.5 Bt and 4.2 Bt respectively in 2020 and 2030.
(2) Significant increase in scientific coal
To solve the environmental problems caused by coal extraction and use, coal mining needs to take into consideration production conditions in the various coal-producing regions to enable scientific coal production. Geology, coal quality, reserves, water resources and ecology in each coal-producing region should be assessed. From this, we expect a third of China’s coal mines to meet the criteria for scientific coal production. A further third will fail to meet the criteria but will be upgraded, and a third will be too far behind criteria requirements to warrant upgrading and will gradually be shut down. As a result of these measures, scientific coal capacity will increase. By 2020, forecasts expect scientific coal capacity to reach 3.5 Bt, which is more than 80% of total coal production capacity. By 2030, scientific coal capacity will be 4.2 Bt, or 100% of total coal production capacity. By 2050, coal production will decline, but scientific coal will still make up 100% of total coal production capacity.
(3) Mechanised, smart coal mines will minimise environmental impact and safety incidents
By 2020, the rehabilitation rate of old incidents of collapsed land caused by coal mining in China will be more than 80%, and that of recent ground collapses will be more than 90%, which is more than in developed economies. China’s mechanisation of coal mining will reach 90% and the reuse of coal mine gas and mine water will reach 85% and 100% respectively. The reuse of currently stockpiled and newly added coal gangue (solid waste) will be 90% and of associated minerals 70%. China’s raw coal washing rate will be 90%. The mortality rate per million tonnes of coal mined will be 0.03, which is close to that of developed economies. The number of major accidents will be less than five and the number of fatalities below 100, which although high is considerably below current levels.
By 2030, the rehabilitation rate of all collapsed land from coal mining in China will be 100%. Mechanisation will approach 100% and in large- and medium-sized mines reach 100%. Reuse of coal mine gas and mine water will be 100%, as will the reuse of currently stockpiled and newly added coal gangue and associated minerals. China’s raw coal washing rate will also be 100%. The mortality rate per million tonnes of coal mined will be less than 0.02, the most advanced level internationally, and annual fatalities will not exceed 60.
By 2050, all of China’s coal mines will be automated and smart. The fatality rate per million tonnes of coal mined will be less than 0.01, and there will be no major accidents during mining. Coal mining will be safe and green, with near-zero environmental impact and casualties.
(4) New business models will transform coal-dependent cities
New business models are continuously emerging. Cross-industry combinations in the form of mergers and acquisitions between coal and power companies will spread.
Traditional coal companies and coal-dependent cities in mining regions will successfully transform. As mechanisation and mine intelligence improve, the number of coal mine workers will rapidly decrease, especially those working in the mines. Many coal-dependent cities will make vigorous efforts to implement innovative reforms and successfully complete their transformation. Through the coordinated development of strong industries, support infrastructure and social programmes, these once coal-dependent cities will evolve into integrated regional centres that are modern, sustainable, liveable and business-favourable.
4.1.2 Oil and Gas
China’s focus on oil and gas exploration and production will shift from predominantly conventional resources to an equal mix of both conventional and unconventional resources—onshore and offshore, and at different depths, from shallow to ultra-deep.
Increasing its exploration and extraction of oil and gas resources will strengthen supply capacity and help safeguard national energy security. Following long-term intensive development, China sees limited production growth potential in onshore conventional oil and gas. However, China has abundant unconventional oil and gas resources, including 19–22 billion tonnes of recoverable unconventional oil resources and nearly 40 trillion cubic metres of recoverable unconventional gas. China’s production of deep-sea oil and gas resources is low. In recent years, China’s exploration of deep and ultra-deep oil and gas has made continuous breakthroughs. China must continue to make major adjustments in oil and gas exploration and production to achieve the equal mix of conventional and unconventional resources it strives for to achieve energy security. By 2030, China’s unconventional crude oil output will be 50 Mt, which is 20% of its total oil production. By 2030, natural gas production will quadruple, with unconventional gas (including tight gas) increasing to two-thirds of total production. In addition, offshore oil and gas production will exceed 100 Mt and dependence on oil and gas imports will fall to 40–45% of total consumption.
(1) Unconventional oil and gas is the key to increased production and reserves
Tight oil and gas is an effective supplement to conventional oil and gas. China will focus on Ordos, Sichuan and the Tarim Basin to ensure speedy scale development of medium- and low-grade tight gas resources and difficult-to-recover oil reserves. By 2030, the output of tight oil and tight gas will be 50 Mt and 100 million cubic metres respectively.
As the exploration and development of shale gas resources accelerate, the technologies and equipment needed to exploit them will improve. Seismic measurement and interpretation during drilling, rotary steering drilling, hydraulic fracture monitoring, horizontal well drilling and downhole micro-seismic monitoring will all progress. Breakthroughs will be made in the exploration and development of organic-rich marine shale in south China and organic-rich mudstone in the north. By 2030, China’s shale gas production will exceed 100 billion cubic metres.
Coalbed methane (CBM) production will grow. Technologies like CBM reservoir engineering and dynamic evaluation, underbalanced drilling, fracturing stimulation and extraction, and the recycling of low-concentration coal mine gas will all advance as CBM extraction shifts from high-quality reservoirs to deep and complex strata. By 2030, China’s CBM production will reach around 50 billion cubic metres.
(2) Unconventional oil and gas will replace conventional
As breakthroughs are made in exploration and extraction technologies, the challenges in exploiting China’s oil and gas resources in reservoirs deeper than 3,500 m onshore and 500 m offshore will be addressed, enabling production at scale. In deep onshore shale, technical difficulties such as identifying deep-strata targets and fracturing at high earth temperatures, at high pressure and in complex lithology will be solved. Innovation will enable oil and gas resources to be exploited in deep carbonate rock, clastic rock and volcanic rock. This in turn will allow China to develop at scale its deep shale oil and gas resources in the Tarim Basin, Sichuan, Ordos, Bohai Bay, Songliao Basin and Junggar Basin. Offshore, breakthroughs in deep-water technologies like deep-water drilling, subsea processing, subsea pipeline transmission and semisubmersible production will accelerate exploration and development in the East China Sea, the South China Sea and the Huanghai Sea.
(3) The shift to clean and green production
Oil and gas fields should be developed in an optimal and integrated way to ensure that production, refining and waste disposal are centralised. This will minimise the production footprint and oil and gas losses. Drilling technologies like multilateral well, horizontal well, slimhole drilling and air drilling will be widely deployed and the waste produced from oil and gas field construction effectively controlled. The use of non-toxic or slightly toxic chemicals in oil and gas fields will increase significantly, and oil spills will be avoided to ensure maximum recovery and safeguard the environment. The well liquid recycling rate will exceed 95%. The wastewater produced in the drilling process will be completely recycled and acid residual liquids, fracturing residual fluids and flow-back fluids fully recycled or disposed of in a harmless way. When a field is decommissioned, the production platform and infrastructure will be completely recycled. Potential environmental risks in shale gas development will be identified and avoided, and the whole-process supervision system will continuously improve to ensure environmentally friendly development.
4.2 Characteristics of Non-fossil Energy Supply
4.2.1 Hydropower: Continuous Growth in Capacity, Within Ecological Red-Line Regulations
Large hydropower projects will continue. By 2020, the construction of large hydropower plants in the middle and lower reaches of the Jinsha, Yalung, Dadu and Lancang rivers, and the upper reaches of the Yellow River, will be under way. Total hydropower capacity will reach 370 GW in 2020, which is more than 50% of China’s clean and low-carbon power generation capacity. By 2030, hydropower development will focus on the upper reaches of Jinsha River, the upper reaches of Lancang River, and Nujiang River. Newly constructed hydropower projects will reach 80–100 GW in 2020–30 and 400–450 GW in 2050.
Hydropower development and ecological protection will be taken into equal consideration to minimise the species affected. Fish pass structures will be developed, demonstrated and implemented, and rare animals, plants and ancient trees will be well protected. The land requisition compensation system will be continuously improved to ensure reasonable compensation for those displaced by hydropower projects. Centralised and decentralised relocation will be combined to provide an optimal solution to any resettlement or employment problems facing those required to move.
4.2.2 Renewable Energy: Increasing Share of the Energy Mix
(1) Wind power: Equal focus on onshore and offshore to ensure coordinated development
By 2020, onshore and offshore wind power will play a dominant and complementary role. Wind power projects in the north, north-east, north-west, eastern coastal China and areas with medium and low wind speed, will be developed. By 2020, cumulative installed wind power capacity will reach 250 GW, which is 12% of China’s total installed power generation capacity. Wind power will meet 6.5% of electricity demand, at parity with conventional coal-fired generation.
In 2020–30, equal focus will be put on onshore and offshore wind power development, with new installed capacity close to 20 GW annually. In 2030, cumulative installed wind power capacity will exceed 400 GW, which will be 8.6% of China’s total power output. The share of wind power in the energy source mix will increase to about 15%.
In 2030–50, offshore wind power development close to load centres will take off. In 2050, cumulative installed wind power capacity will exceed 1,000 GW, or 14.6% of China’s total power output. The share of wind power in the energy source mix will increase to about 25%.
(2) Solar power: Deploy the right solar technology for local conditions
In desert areas with abundant sun like west and north China, Gansu, Qinghai and Xinjiang, solar power will be prioritised. In medium and large cities in east and central China, building-integrated PV systems will rapidly develop and be widely deployed. In regions that feature good sunshine conditions, large areas of available land and abundant water resources, solar thermal pilot projects will be built to test different solar thermal technologies. Installed solar power capacity will reach 140 GW in 2020, 400 GW in 2030 and 1,000 GW in 2050.
Solar power will speed up the process of addressing access to electricity issues and poverty alleviation in areas that large grids don’t reach. Poverty alleviation projects will be started in those areas to help provide people in need with a stable source of income.
(3) Liquid biofuels: A substitute for oil
In the heavy-duty truck, aviation and shipping sectors, non-food liquid biofuels will be gradually commercialised and used at scale. In the short and medium terms, the production cost of non-food liquid biofuels will drop sharply, with production reaching 10 Mt in 2020. As breakthroughs are made in second and third generation biomass technologies—like cellulosic ethanol and algae-based biofuel—liquid biofuels will gradually replace petrol, diesel and kerosene in heavy-duty trucks, aviation and shipping. The production of liquid biofuels for transport will reach 20 Mt and 60 Mt in 2030 and 2050 respectively, replacing about 50 Mt of petroleum-based fuels.
(4) Renewable heat will grow extensively
Solar thermal energy will play an important role in heating and cooling buildings and heating water for homes, businesses and industry. By 2020, solar-powered water heating systems will be extensively deployed to ensure that the heating capacity of solar thermal applications reaches 800 million cubic metres, and that solar thermal energy replaces 87 Mtce of fossil fuels annually. In 2020–30, solar thermal capacity will be 1.2 billion cubic metres, replacing 120 Mtce of fossil fuels per year. In 2030–50, as medium- and high-temperature solar application technologies are developed, solar thermal will extend to heating and cooling medium- and high-temperature commercial and industrial applications. The production capacity of solar thermal applications will grow to 1.4 billion cubic metres, replacing 150 Mtce of fossil fuels annually.
Biogas and biomass briquettes will help meet heat demand for cooking and boilers. By 2030, biogas purification technology will be close to maturity, and the industrial biogas production sector will begin to take shape. Intensive agriculture and compact biomass briquette technology will be developed in suitable areas at scale to achieve an annual production target of 30 Mt of briquettes. Centralised geothermal heating will become predominant in the north, north-east, east and south-west, and ground source heat pumps will be deployed at scale in regions that are hot in summer and cold in winter, like the middle and lower reaches of the Yangtze River. In 2030–50, biogas technology will be widely used in urban and rural areas, and annual production of biogas will reach 50 billion cubic metres. As the reliability and lifespan of biomass briquette production equipment improves, markets will be extensively developed and suitable areas will see the large-scale development of biomass briquette manufacturing. As geothermal heat technologies mature, applications will be promoted extensively in China. By 2050, geothermal energy will heat or cool 1 billion square metres of floor space, replacing 60 Mtce of fossil fuels per year.
4.2.3 Nuclear Power: Safe Development and Larger Share of China’s Power Output
(1) Installed nuclear power capacity will significantly increase with third-generation pressurised water reactor (PWR) technology
A well-proven and safe technology, third-generation PWR is the mainstream technology in nuclear power plants across the world and for China’s future nuclear power development. China will increase its investment in nuclear power plants in eastern coastal areas and build a nuclear power belt in east and central China, all using third-generation PWR. In 2020, the installed capacity of nuclear power plants, built or under construction, will be 58 GW and 30 GW respectively, and nuclear power’s share of China’s total power output will be more than 5%. In 2030, the installed capacity of nuclear power plants built or under construction will grow to 120–150 GW and 30 GW respectively, which will increase nuclear’s share of China’s total power output beyond 10%. In 2050, the installed capacity of nuclear power plants built will reach 350 GW, and nuclear’s share of China’s total power output will top 20%, becoming one of the main pillars of the power sector.
(2) China will become a nuclear power hub
Alongside nuclear power development in east and central areas of the country, China’s nuclear power equipment manufacturing, and project construction capability will significantly improve. The CAP1400 and Hualong 1 nuclear power demonstration projects will become a national brand, enabling China’s nuclear power technologies to go global. By 2020, China’s nuclear power technology and equipment export framework will have taken shape. By 2030, the level of exports will be an important indicator of China’s international competitiveness in the nuclear power sector, helping China to become a nuclear power equipment manufacturing hub for the world.
(3) Nuclear power development will be based on informed decision-making and public acceptability
Acceptability has restricted nuclear power development. In the future, the decision-making process will be more scientific and consistent to ensure nuclear development strategies and plans are clearly defined and implemented. Laws and regulations will be improved to ensure all activities have a legal basis. Positive publicity and public guidance will ensure better information and improved public acceptability of nuclear power.
4.3 Potential Energy Production Technologies
4.3.1 Natural Gas Hydrate: A Strategic Alternative to Natural Gas
China has abundant natural gas hydrate (NGH) resources, with reserves estimated at 83.7 trillion cubic metres. There are large NGH deposits in polar tundra sandstone in the Qinghai-Tibet Plateau and in seabed sandstone in the South China Sea. However, large-scale NGH extraction technology has yet to be developed, as there are environmental and safety production risks like methane leakage and submarine landslides.
China has made considerable breakthroughs in NGH development. Bluewhale 1, the world’s most advanced semi-submersible drilling rig, has been charted to explore for NGH off the China coast. China has also innovated 20 critical NGH technologies and conducted safe and controlled trial mining of muddy silt-type combustible ice, which is a world-first. For the past two decades, the USA has led the world’s shale oil and gas revolution through wide deployment of horizontal drilling and hydraulic fracturing technologies. Like the USA, China will also rely on continuously improving technologies and equipment to make extraction of NGH commercially viable. China should also strengthen research so that it can assemble a complete range of support technologies for NGH exploration and production. These should include predicting, targeting and evaluating NGH deposits; drilling and wellbores; well pattern design; environmental impact assessment of extraction; and safety. In addition, China will accelerate its NGH surveys and screening of potentially profitable exploration areas. After 2030, as commercial mining of NGH becomes possible, China will strive to sharpen its international competitiveness in NGH exploration and production, to lead a new revolution in oil and gas production.
4.3.2 Advanced Nuclear Power Technologies: Research on Fourth-Generation Reactor and Fusion Technologies
China’s research and development of fourth-generation reactor technology will drive the nuclear power revolution. China will conduct experimental research into the technology’s application and will complete demonstration projects of high-temperature gas-cooled reactors as soon as possible. China’s short-term and long-term targets for outlet temperature are 700–950°C and above 1,000°C respectively. Research on critical technologies will be completed by 2025 and pilot demonstrations by 2030.
China will strive to speed up the design and certification of small reactors by 2020 to enable wide deployment in applications such as floating nuclear power plants; naval vessels; neutron source; power supply for remote areas, households and industrial heating; offshore oil exploitation; and sea water desalination. In addition, following the fast reactor development strategic pathway of “test-demonstrate-commercialise”, China will strive to build fast-reactor demonstration projects by 2025 and large commercial fast-reactor demonstration projects by 2030.
China will also focus on basic research and design concepts for such advanced technologies as nuclear fusion reactors, very-high-temperature reactors, supercritical water reactors, thorium molten salt reactors and travelling wave reactors. China will also carry out long-term R&D and demonstration projects on basic and critical technologies to enable the wide deployment of mature technologies after 2030.
4.3.3 Marine Energy: Research for the Future
Marine energy refers to the energy generated by tides, waves, currents and temperature differences. It is renewable, abundant and environmentally friendly. The world’s oceans contain the energy equivalent of double the current global energy consumption. But ocean energy has disadvantages as well, such as instability, low energy density, harsh operating conditions and poor commercial viability.
China has a vast coastline, which means abundant marine energy. Currently, marine power generation technology is still under research and experiment, in particular how to transform marine energy into reliable and easily accessible energy carriers like electricity. As marine energy technologies progress, it is expected to become an important component of China’s future energy system.
4.3.4 Space-Based Solar Power: Exploration
The sun is the original source of most types of energy developed and used by humans. Solar energy radiates from the sun into space, mainly in the form of electromagnetic waves. Only a very small fraction (1/2,200,000,000) of this energy reaches Earth. If the solar power in space can be harnessed, the world could have an inexhaustible supply of energy. Space-based solar power has many benefits, including 24-hour uninterrupted supply and the possibility of transferring the energy to ground-receiving stations on Earth, which could then distribute it to where it is needed.
Space-based solar power is still at the design and exploration stage. Building solar power stations in space will present many challenges, including the development of large-scale space delivery systems and special materials for solar panels and other equipment, performing maintenance while in orbit, and avoiding other spacecraft and space debris.
With space exploration increasing, aerospace technologies advancing, and major innovations in new forms of energy and materials taking place, space-based solar power may soon become reality. When it does, it will be a new and better way to harness solar energy.
5 China’s Energy Revolution: The Transition to Secondary Energy
5.1 Characteristics of Secondary Energy Supply
5.1.1 Electricity
(1) Electricity is becoming more important
Economic development increases the need for energy and changes the end-user demand structure. High-quality energy carriers like electricity will gradually replace high-pollution, non-renewable fossil fuels. According to BP Energy Outlook 2017, by 2035 about two-thirds of new global energy consumption will be power generation. Electricity will also play a major role in China’s future energy system. Electricity’s share of China’s end-user energy demand is forecast to increase from 20% in 2015 to 25% in 2020, 32% in 2030 and more than 50% in 2050.
Replacing coal and oil with electricity and increasing the capacity of long-distance power transmission are two important changes in China’s future energy system. Electricity will replace coal fuel in industry, agriculture, buildings and homes, specifically in industrial boilers and kilns and in household heating and cooking. This will reduce the use of scattered coal across sectors and significantly increase the conversion of coal into electricity. The electrification of vehicles, rail and irrigation will be vigorously developed to reduce oil dependency. Ultra-high voltage power transmission lines will be built to transmit thermal, wind and solar power in west and north China, and hydropower from south-west China, to east and central China at scale. This will help optimise the energy mix, improve power availability across regions, control thermal power construction and pollution emissions in east and central China, and reduce haze in eastern parts of the country.
(2) Clean and efficient coal-fired power generation
The share of installed coal power capacity and coal power output will continue to fall. Taking into account China’s economic and social development, energy source endowment, and the requirements of the energy revolution, China’s power and coal power sectors still hold great growth potential. Installed power capacity is predicted to reach 2,000 GW and 3,170 GW in 2020 and 2030 respectively, and power output will be 8.5 trillion kWh and 12 trillion kWh respectively. Installed coal power capacity will reach 1,100 GW in 2020, up 33% from 2014, and 1,450 GW in 2030, up 76% from 2014. Coal power’s share of installed capacity is expected to decline from 60.7% in 2014 to 55% in 2020 and 46% in 2030, and coal power output to decrease to 66% and 56% in 2020 and 2030 respectively.
The efficiency of coal-fuelled power generation will improve. The amount of coal consumed per unit of electricity will fall sharply, thanks to energy-efficiency technologies, upgrading existing plants to ultra-low emission status, and shutting down outdated units that do not conform with mandatory standards. According to the Action Plan on Upgrading and Reconstructing Coal-Fired Power Plants for Energy Conservation and Emissions Reduction (2014–20), in 2020 the amount of coal consumed per unit of electricity should be: (a) lower than 300 grams coal equivalent per kilowatt-hour (gce/kWh) in newly built coal-fired power generating units; (b) lower than 310 gce/kWh in upgraded coal-fired power generating units; and (c) lower than 300 gce/kWh in upgraded coal-fired generating units of 600 MW or more.
Pollutants and greenhouse gas emissions from coal-fired power plants will gradually decrease. The key targets for coal-fired power generation include clean production, reducing emissions of soot, CO2 and NOx, and controlling wastewater discharge. By 2030, emissions of soot, CO2 and NOx per kWh will decrease to 0.04 g, 0.15 g and 0.2 g or lower respectively. China has set the goal of reaching a peak in CO2 emissions by around 2030, which makes carbon emissions reduction the biggest challenge facing coal-fired power generation. Deployment of carbon capture, utilisation and storage (CCUS) technology at scale will become an important option for reducing greenhouse gas emissions.
Coal-fired power generation technologies and equipment will significantly improve. China will increase support for the development of emission reduction technologies for coal-fired power plants. It will back the development of advanced dedusting, desulphurisation and denitration processes and innovate new ways to save energy, water and land. Advanced coal power technologies like ultra-supercritical will be deployed to achieve the highest efficiency and lowest emissions. The combination of clean coal gasification and combined cycle power generation in integrated gasification combined cycle (IGCC) technology turns coal into pressurised gas that can be used to generate power with lower emissions, thus opening another way to use clean coal efficiently.
(3) Distributed energy resources encourage local consumption
Distributed solar photovoltaic (PV) systems. Distributed solar PV power systems could become the main component in distributed renewable energy. According to China’s 13th Five-Year Plan for Energy Development (2016–20), installed solar power capacity is expected to be more than 110 GW in 2020. This will include 60 GW of distributed solar power, which is more than the 45 GW installed capacity of centralised solar power plants. The installed capacity of distributed solar power is expected to make up 56% of total installed solar power capacity in 2020. In accordance with China’s 13th Five-Year Plan for Solar Power Development, 100 distributed PV demonstration plants will be built by 2020.
Gas-fired distributed generation. Gas-fired distributed generation is an important part of China’s energy strategy. According to China’s 13th Five-Year Plan for Energy Development (2016–20), China will vigorously promote gas-fired distributed generation, focusing on the development of combined cooling, heat and power (CCHP) plants and include gas-fired distributed generation in national energy development strategies. China’s installed capacity of gas-fired distributed generation will be more than 110 GW in 2020, including 15 GW of CCHP plants. According to the 13th Five-Year Plan for Natural Gas Development, China will encourage the development of efficient gas projects like gas-fired distributed generation, constructing peak-shaving gas-fired power plants and adapting CCHP plants to local conditions.
Distributed wind power. According to China’s 13th Five-Year Plan for Wind Power, China will proactively explore business models suitable for the development and deployment of distributed wind. China will also promote the development of microgrids that combine wind, solar and energy storage. Small- and medium-sized wind power systems have unique advantages. Northern China has excellent wind resources, as do other parts of the country. These resources are often more suitable for small- and medium-sized wind power solutions than for large wind parks. Distributed wind power provides local grid connections, eliminating the need for long-distance transmission. Local distributed wind systems can also relieve power supply pressure, especially in load centres in east China.
5.1.2 Heating and Cooling
(1) Growing demand for heating
According to forecasts in Market and Policy Research on Renewable Heat, total demand for heating will reach around 1.67 Btce in 2020 and about 2.24 Btce in 2030, an increase of 34%. There are four main types of demand in the market: household water heating, building heating, building cooling and industrial heat. The combined share of building heating and cooling will exceed 70% in 2020 and 2030.
Household water heating. In 2020, the energy used to heat household water will be around 152 Mtce. In 2030, the energy needed to heat public buildings will be about 189 Mtce. Energy consumption for residential and public building water heating will be about 145 Mtce and 7 Mtce respectively in 2020, and 178 Mtce and 11 Mtce respectively in 2030. Household water is a major application for renewable heat, with thermal the biggest application for solar, geothermal and biomass water heating technologies.
Building heating. Buildings are the largest and most important application in heating. Heat generated for buildings will reach 631 Btce in 2020 and 794 Btce in 2030, which equates to 38% and 36% respectively of the total heat market. Rural building heating in cold regions will account for 40–45% of total building heating demand in 2030. Currently, building heating in rural areas relies mainly on scattered coal, and the coal-fired heaters used are often inefficient and pollute severely. Renewable heat is, therefore, a good clean energy alternative to coal-fired heating.
Building cooling. Demand for building cooling will reach 612 Btce in 2020 and 903 Btce in 2030, which is roughly the same as for building heating. Electric air conditioning systems are the main cooling technology for buildings now and will remain so in the future. In renewable cooling, ground source and water source heat pump cooling technologies are well proven. Solar air conditioning is expected to deliver technical breakthroughs by 2020.
Industrial water heating. Industrial heat demand is expected to reach 274 Mtce in 2020 and 355 Mtce in 2030. Biomass-fired boilers can replace coal-fired boilers to heat industrial water, but other renewable heat technologies need to operate with conventional heating technologies to meet industrial water heating demand. Renewable heat technologies can replace fossil energy in certain parts of the heating process, for instance in preheating and heat tracing, helping to increase the use of clean energy in industrial water heating.
(2) Strong potential for renewable heat
Renewable heat is generated mainly by solar, biomass and geothermal energy. Renewable heat production is forecast to reach 1.84 Btce in 2020 and 3.59 Btce in 2030. Given the huge potential of solar and geothermal energy, renewable heat could grow even faster than forecast, which would increase the share of clean and low-carbon energy in the heating market.
Solar heating. According to China’s 13th Five-Year Plan for Solar Energy, the surface area of solar thermal collectors will reach 800 million square metres in 2020. Converted into tce/m2, solar thermal applications could replace 96 Mtce of energy. As medium- and high-temperature solar technologies mature, the growth potential of solar heating increases. If solar heating maintains the same growth rate as envisaged in the 13th Five-Year Plan, the surface area of solar thermal collectors will reach 1.2 billion square metres by 2030, replacing 144 Mtce of energy.
Biomass heating. The use of agricultural and forestry waste will gradually shift from power generation to biomass-fired combined heat and power (CHP) and biomass heating. Biomass heating will be fuelled mainly by biomass briquette-fired boilers, thereby helping to displace industrial coal-fired boilers. According to the China Biomass Energy Technology Development Roadmap 2050, China’s installed capacity of power generation from agricultural and forestry biomass will reach about 5 GW in 2020 and around 8 GW in 2030, equivalent to 4.2 Mtce and 8.96 Mtce respectively.Footnote 13 The heat supplied from biomass briquette-fired boilers will be 600 petajoules (PJ) in 2020 and 1,000 PJ in 2030, enough to replace 20.5 Mtce and 34.2 Mtce of conventional energy in the heating market. Based on the above, biomass heating will amount to 24.7 Mtce in 2020 and 43.16 Mtce in 2030.
Geothermal heating. Given the current state of geothermal energy and technology development, China’s future geothermal heating strategy will focus on shallow geothermal energy (the upper few metres of the ground), which can be developed to heat the cold areas of north China. If geothermal heating maintains an annual growth rate of 12% in 2016-20, the surface area heated by geothermal energy will approach 900 million square metres in 2020, replacing 13.2 Mtce of conventional energy. If it maintains annual growth of 15% in 2021-30, the surface area heated will be close to 3.6 billion square metres in 2030, replacing 53.5 Mtce of conventional energy.
5.1.3 Oil Products
(1) Oil product marketisation will accelerate
Marketisation of oil products will accelerate in the future, resulting in the following changes in policy: (i) the oil product import and export market will be deregulated; (ii) oil product pricing will be deregulated; (iii) mixed ownership will be initiated to encourage and attract private capital in the upstream, midstream and downstream oil and gas industry, thereby promoting diversification of market participants; and iv) the introduction of oil product futures will be accelerated. The aim is first to meet demand in the oil refining sector before deregulating the oil product import and export markets. This will benefit downstream users and facilitate the orderly development of crude oil and oil product markets. Full oil product marketisation will be possible by 2030.
(2) Demand growth for petrol and diesel will gradually slow down
Petrol and diesel in China are mainly used by motor vehicles, so vehicle ownership numbers directly determine the amount of petrol and diesel consumed. The CNPC Petrochemical Research Institute has forecast that vehicle ownership will maintain an annual growth rate of about 12% to 2020. The number of vehicles owned is expected to rise from 173 million in 2015 to 266 million in 2020 and 300 million in 2030. By 2050, the share of EVs in passenger vehicle ownership will exceed a third.
(3) Diesel demand will flatten
China is still a developing economy. As such, its economy is still growing rapidly and so too is its need for energy. Diesel consumption in China has yet to peak. According to the scenarios of Zhang Hailing of the Institute of Policy and Management of the Chinese Academy of Sciences, in the High Regular Consumption scenario,Footnote 14 diesel use will peak in 2020–25 at 174 Mt and decline slowly thereafter. Alternative energy carriers like electric and hydrogen vehicles will develop slowly. In the Low Energy Revolution scenarioFootnote 15—characterised by strong economic and social development, optimised industrial structures, improved vehicle fuel economy and fast-growing alternative fuels—diesel consumption will peak at 170 Mt in 2015–20. After 2020, as vehicle ownership slows down and alternative energy carriers grow, the decline in diesel consumption will speed up.
(4) Kerosene demand will grow rapidly
One of the effects of higher income per capita is growth in air travel and air cargo, which means greater demand for aviation fuel. In 2016–20, the annual average growth rate in aviation fuel will be 9.2%. Use of kerosene-based aviation fuel is expected to reach 40 Mt in 2020, after which growth will slow down, reaching 53 Mt in 2025 and 64 Mt in 2030. Air cargo will grow at a similar rate as air travel, but will gradually slow down after 2030. The average flight length in air travel will increase from 1,669 km today to 1,900 km in 2050. That of air cargo will increase from 3,312 to 4,200 km. Longer aircraft range and better fuel economy will cause growth in kerosene demand to decline. It will increase from 64 Mt in 2030 to 72 Mt in 2040, and then flatten after 2040.
(5) Liquefied gas use will be driven by industrial demand
In recent years, industry’s increasing use of liquefied gas is the main reason for the fuel’s rapid growth. Growth in household liquefied gas demand will slow down, although not in rural areas where growth potential remains. Industry’s share of total liquefied gas demand will continuously increase. Use of liquefied gas in transport will also grow, due to it being more economical than petrol. End-user liquefied gas demand is forecast to reach 44 Mt in 2020 and 50 Mt in 2030. After 2030, household demand for liquefied gas will remain flat before gradually declining, due to natural gas replacing fossil energy and slower growth in demand in rural areas. The production capacity of propane dehydrogenation plants, where liquefied gas is made, will be saturated by 2030. As the future deployment rate of new technologies and plants isn’t clear, liquefied gas demand in the chemical sector is expected to remain stable after 2030.
5.1.4 Hydrogen Energy
Hydrogen has been included in China’s energy plan as a strategic option to optimise energy consumption and safeguard national energy security. China produces hydrogen energy from a variety of sources, including fossil fuels, renewables and industrial gases. Hydrogen production technologies and processes, like water electrolysis and hydrogen purification by pressure swing adsorption, are mature. Hydrogen safety technologies in China are almost in line with internationally advanced levels, and breakthroughs have been made in developing safe high-pressure hydrogen cylinders and tanks. China’s hydrogen fuel infrastructure is behind that of developed economies like the USA, Japan and Germany, but is growing fast. In addition, China has completed a standards system for hydrogen and fuel cell technologies. Based on international standards, the system will play an increasingly important role in driving the development of the hydrogen energy industry.
(1) The hydrogen energy industry will grow rapidly
According to the report on China’s Hydrogen Energy Industry Infrastructure Development, China will make major progress in hydrogen energy infrastructure development by 2020. Hydrogen energy production capacity will reach 72 billion cubic metres, supplying 100 hydrogen refuelling stations, 10,000 fuel cell vehicles and 50 hydrogen-powered railway trains by the end of this decade. The gross output value of the hydrogen energy industry will amount to RMB 300 billion ($43.5 billion).
By 2030, the hydrogen energy industry will be an integral part of China’s new energy strategy, and its output value will exceed RMB 1 trillion. There will be 1,000 hydrogen refuelling stations serving 2 million fuel cell vehicles, supported by 3,000 km of high-pressure hydrogen pipelines. In addition, China will develop a technical standards system for hydrogen energy infrastructure to match those in developed economies. And it will innovate hydrogen and fuel cell technologies and services to support the continued development of the hydrogen energy industry.
In the next 3–5 years, the hydrogen energy industry will see massive growth thanks to extensive production, safe and large-scale storage, continuous supply, long-distance transmission and fast replenishment. Hydrogen fuel cells and lithium-ion batteries are the two pillars of the new energy vehicle industry. Fuel cells are being vigorously promoted across China. For instance, Shanghai released a development plan for fuel cell vehicles in September 2017, which forecast that the city will have more than 100 fuel cell vehicle related companies by 2020 and build 50 hydrogen refuelling stations by 2025. Fuel cell vehicle technology and manufacturing will match international levels by 2030, and the annual output value of Shanghai’s fuel cell vehicle industry will exceed RMB 300 billion ($43.5 billion).
(2) Coal-to-hydrogen and carbon capture and storage will become mainstream
China has abundant and relatively inexpensive coal resources, so coal-to-hydrogen will probably become the main method for large-scale hydrogen production. However, the coal-to-hydrogen process emits large amounts of CO2, so the use of carbon capture and storage (CCS) technology is necessary to reduce emissions. Currently, CCS technology is mainly deployed in thermal power generation and chemical production. According to the U.S. Environmental Protection Agency (EPA), CCS technology can help reduce 80–90% of CO2 emissions in thermal power plants. China Shenhua Group began development of a CCS project in Ordos in 2009 and has successfully developed 300,000 tonne CCS demonstration projects. As CCS technology gradually matures, the coal-to-hydrogen plus CCS method of hydrogen production will predominate, providing sufficient hydrogen for the medium- and long-term development of China’s hydrogen economy.
5.2 Secondary Energy Infrastructure
Energy infrastructure is the core of China’s energy transition. It is where change in the energy system is perhaps at its greatest, driven by deep integration, digitalisation and Internet technologies. China’s energy system will focus equally on centralised and distributed energy production. Energy sources, networks, loads and storage will be integrated into a single system using multiple types of energy, which will gradually evolve into a low-carbon, smart, secure and efficient national energy system.
5.2.1 General Characteristics
(1) A combination of centralised and distributed energy systems
China’s future power system will comprise centralised smart grids and distributed low-carbon energy networks. Historically, centralised production has been the dominant energy supply mode in China. By optimising resource allocation and improving energy use efficiency, centralised supply will still play an important role in driving China’s energy system and socioeconomic development. However, as distributed energy systems have distinct advantages like low transmission losses, efficiency and environmental protection, China’s energy supply mode is shifting from a predominantly centralised mode to a combination of centralised and distributed energy supply. This is an irreversible trend in China’s energy system, and the only way to ensure an optimised and clean energy system.
Centralised smart grids will be the platform for optimising power resource allocation in the long term. From the beginning, China developed large centralised power generation facilities, connecting them with end users through transmission and distribution systems. Thanks to economies of scale and supply reliability, centralised power systems generally succeeded. However, as China’s energy sources are often located far from load centres, smart grids are needed to optimise supply and demand. According to China’s Strategic Action Plan for Energy Development (2014–20), 14 large 100 Mt coal bases and nine large 10 GW coal power bases will be formed, mainly in the north, north-west and south-west of the country; and nine large wind power bases will be created, mainly in the north, north-east and north-west. The installed capacity of solar power in the north, north-east and north-west will reach 37 GW, 37% of China’s total installed capacity in solar. Given the distance between energy production in the north and west and load centres in the east and south, China’s priorities include the continued development of long-distance high-capacity power transmission, expansion of the West-to-East power transmission project, and implementation of the North-to-South power transmission project.
Secure, clean and efficient distributed energy is an important part of China’s future energy system. Distributed energy is a network that connects low-carbon energy producers with consumers. It is capable of effectively integrating different types of energy and making energy use more efficient. As such, it is an important tool to counter energy shortage and environmental pollution. A distributed energy network can comprise multiple renewables like building-integrated photovoltaics, rooftop solar, waste-to-energy, biogas, geothermal, energy storage, and small wind farms. Each network can operate as an independent microgrid serving a village, organisation or community, or be connected to the centralised grid for regional integration, leveraging technologies such as artificial intelligence and big data.
Distributed energy offers efficient and flexible grid connection. This enables the grid to operate optimally by combining centralised and distributed energy resources. Generally, distributed energy networks need to be connected to the grid to import or export power during periods of surplus production or deficiency or network outages. During normal operation, the grid can provide distributed energy networks with services like voltage and frequency support and system backup. These can help optimise power distribution and safeguard grid operation. Distributed energy will be mainly connected to power distribution systems and microgrid/micro energy networks, resulting in multi-directional energy flows. This is detrimental to network protection and control. To offset such negative effects, active power distribution and smart microgrid/energy network technologies can be developed to ensure grid connection of all distributed energy and safe and stable grid operation.
(2) A digital platform for smart energy services
Digitalisation, the Internet and advanced information software are changing the way energy is produced, distributed and used. Together, they are refashioning the energy landscape, creating new business models and driving economic and social development.
Smart, digitalised energy infrastructure creates a platform for sharing energy and information. Whereas the traditional grid is a pure power transmission and distribution system, the smart grid is an integrated energy and information carrier. This enables the grid to function as a central platform for wide-area optimisation and to coordinate distributed energy infrastructure. In time the strength of the grid’s information and communication resources can help build a public data-sharing platform that can improve energy production and consumption, and better serve people’s needs.
The integration of energy networks with the Internet triggers the emergence of new business models and energy service players. It connects decentralised users, diversified energy carriers and different service providers in the energy system, expanding the scope and frequency of market interaction and lowering transaction costs. Business model innovations will initially target power trading and new energy vehicles, and then extend to other parts of the energy system like energy demand consulting, energy efficiency products and online-to-offline services. Many innovative energy service companies will also start up, driving the development of the energy Internet industry into value-added services.
(3) Complementary energy systems from multiple sources
A smart energy system comprises multiple energy sources. It consists of various energy conversion technologies that enable subsystems like power, heating, cooling, gas, oil and transport to deliver complementary benefits along the entire value chain, from production and transmission to conversion and use. In this way, the entire energy system is interconnected and complementary. In addition, coordinated planning and development of the energy subsystems—power, heating, etc.—can reduce resource waste and improve the economic benefits of the entire energy system.
Large-scale transmission, energy storage, wind and solar, and power-to-hydrogen and power-to-methane projects will be developed to build an energy network of complementary sources that reduce volatility in renewable energy and allow it to be used efficiently.Footnote 16 Energy bases should identify a suitable multi-energy complementary model for their region based on local energy sources, land resources, transmission corridors, grid strength and other variables. For example, hydropower complemented by wind and/or solar power in an energy base focused on hydropower and new energy; or wind, solar and energy storage complemented by thermal power in a base integrating new energy and thermal power. Energy bases of this kind can help increase the use of renewable energy.
Multiple types of complementary energy provide end users with options, enabling them to customise their energy supply in power, heating, cooling and gas. This can be achieved with natural gas-fired combined cooling, heat and power plants, distributed renewable energy systems and smart microgrids. Complementary energy systems enable energy demand-side management and improve energy efficiency.
(4) Coordinated development of energy sources, networks, loads and storage
Energy supply loads and energy storage will be integrated to form an open and coordinated platform that connects generation, transmission and distribution with demand and consumption. In this way, deep integration and the bi-directional flow of power and information will improve efficiency and the share of clean energy in end-user consumption.
The coordinated development of energy sources, networks, loads and storage is not limited to one energy carrier, it applies to the entire energy system. Energy sources include oil, natural gas, electricity and other carriers. Networks means oil pipeline networks, heating networks, power grids and other energy networks. Loads refers to power load and other energy demands of users. Energy storage includes batteries, pumped storage, thermal (molten salt) storage and others.
Various energy conversion, information and integration technologies will be deployed to coordinate the development and production of energy sources and their transport or transmission in the energy system. First, energy sources will be combined in a flexible and efficient way to ensure coordination between new types of power generation and the grid. This will improve the grid’s self-regulating capacity and reduce the impact of intermittent renewable energy on grid stability. Second, networks, loads and energy storage will be integrated, enabling multidirectional interaction between the grid, energy storage and demand-side resources like energy efficiency and load management. This will connect energy storage with grid control and allow operators to track fluctuations in renewable energy output and respond with orderly (smart) charging and discharging of energy storage resources, thus strengthening grid security and stability.
User demand can be connected to the system to enable integrated energy demand management across the entire energy system. Users’ overall energy demand and energy storage resources are controllable, allowing information and energy to flow between demand, storage and supply. In this way, a highly automated and controllable energy supply and demand system will take shape, improving the efficiency, security and stability of the entire energy system.
5.2.2 The Power Grid of the Future
According to Zhou Xiaoxin, China’s renowned power system expert and his research team, China’s grid will evolve from the second to the third generation by 2050. Building on more than 100 years of first- and second-generation grid technologies, the third-generation grid supports large-scale new energy power generation, significantly reduces grid security risks and integrates a wide range of information and communications technologies. It is the smart, sustainable power grid of the future. The overall trend of grid development is to build a flexible, efficient and integrated smart energy system comprising a network of national transmission systems, local transmission and distribution systems, microgrids with distributed energy resources, energy storage facilities and energy utility systems.
The power grid of the future will be a combination of conventional grids and microgrids. China’s West-to-East and North-to-South power transmission projects will remain the backbone of the system, transporting a mix of hydropower, coal power, large-scale wind power and desert-based solar power to load centres.Footnote 17 Distributed power generation systems that use local energy sources and regional grids and microgrids will be developed, and the number of electric vehicles and other energy storage facilities will substantially increase. The future power distribution system will probably be divided into several independently operating zones, which can connect with virtual power plants and microgrids of varying sizes.Footnote 18
AC and DC power links will form the spine of the national transmission system. Ultra-high voltage AC (UHVAC) transmission systems are synchronous, providing instantaneous response and adjustment to regional changes in demand. Ultra-high voltage DC (UHVDC) point-to-point transmission systems transfer large amounts of power at very high voltages over very long distances, with low electrical losses. UHVDC and UHVAC systems complement each other, and a mix of the two is where the future of UHV transmission in China lies. Flexible HVDC and DC power systems will be effective supplements, delivering technical and cost-efficient advantages. As the manufacturing technologies of cut-off devices and DC cables continuously improve, flexible HVDC will become the most important transmission mode in DC power systems.
Advanced information and communications technologies will be deployed across the entire power system value chain to increase automation, digitalisation and intelligence and provide deeper and better information on system operations. Artificial intelligence, the Internet of things, big data, cloud computing, deep learning and blockchain will be deployed in asset management, system control, and energy management and trading to improve security, cost-effectiveness and reliability.
Diverse sources of energy will be integrated to enable interactive supply and demand. The power grid of the future will support large volumes of renewable energy and enable smart operation and integrated information management. It will become an Energy Internet that integrates energy, information and business to balance supply and demand, provide users with flexible options and the ability to conduct real-time transactions. The Energy Internet will dynamically manage and optimise multiple energy sources, delivering grid reliability and maximising financial returns.
5.2.3 Distributed Energy
China’s structural transformation of the economy and energy system is accompanied by cheaper distributed energy and digitalisation. China’s distributed energy prospects are highly promising. According to research on China’s energy system evolution by Professor Li Liying of South China University of Technology and his team, the pathways of distributed energy development are as follows: first, in the short term (up to 2020), centralised energy supply will remain dominant, supplemented by distributed energy. Natural gas-fired combined cooling, heat and power (CCHP) systems will be extensively deployed, and the development and use of renewables, like wind and solar, will switch from centralised to distributed mode. Second, in the medium term (by 2030), the share of distributed energy in the energy system will increase, as will energy diversification. Third, in the long term (by 2050), distributed energy will be everywhere and comprise a major component of the energy supply system. Energy producers and consumers will make free transactions via Internet-based energy trading platforms. The International Energy Agency, in its Prospects for Distributed Energy Systems in China, explains the trends driving distributed energy development. These include making consumers an active part of the energy system, providing innovative services, and Internet-based business models.
Making consumers an active part of the energy system. In distributed energy systems, consumers have the opportunity to play an active role in the energy system. They can have their own generator, energy storage device and smart equipment, enabling them to be both an energy consumer and a producer. More and more house owners, businesses and organisations like local government can all be part of distributed energy solutions. This provides a way for them to express their values, such as using renewable energy only or a desire to use smart technology.
Integrating multiple energy sources to provide innovative services. Deep integration of distributed and centralised energy with intelligent control, information management and user terminals enables energy providers to offer innovative services. First, they can provide energy optimisation services for end users. The production and consumption of different energy sources like heat, gas and electricity will be automatically measured and stored, providing useful information to help optimise energy production and consumption. Big data, data mining, and the analysis of users’ energy consumption and production data will provide a deep understanding of user characteristics. Second, they provide value-added services within the energy system. Most distributed energy systems will be connected to centralised power distribution systems, exchanging energy and information. Distributed energy systems can provide value-added services for centralised systems, including peak shaving, frequency adjustment, system backup and better power quality.
Internet-based development of distributed energy business models. Innovative technologies like information and communications, cloud computing and big data analytics allow digital technologies to penetrate each part of the energy system and connect them all in an intelligent way. For instance, by analysing the operating hours of different distributed energy systems and the data from demand-side response and energy storage systems, supply and demand can be coordinated to reduce costs and consumer prices. Second, by using energy storage and demand-side response, generation and consumption in centralised and distributed energy systems can be coordinated to deliver an optimal energy system. Microgrids will be developed in remote areas to reduce the cost of constructing power transmission and distribution systems.
5.2.4 Energy Storage
Energy storage is of strategic importance for the energy transition and for changing the way power is generated and consumed. It can boost supply at peak times and improve grid operations and the use of grid equipment. Energy storage holds great potential for the future. According to the International Energy Agency, by 2050 the global installed capacity of energy storage will exceed 800 GW (equal to 10–15% of total installed power capacity) and be worth several trillion dollars. China’s installed capacity of energy storage will reach 200 GW in 2050 and be valued at more than RMB 2 trillion. This shows that China has massive and urgent demand. In the context of the Energy Internet, energy storage technologies like electrochemical, thermal, hydrogen and electric vehicles, will be gradually deployed at scale, accelerating the development of centralised renewable energy, distributed power generation and microgrids.
Provides grid support and makes large-scale centralised renewable energy more efficient. Energy storage allows renewable energy to have the same attributes as conventional energy, making it schedulable, predictable and controllable. Large-scale centralised renewable energy storage shows two key trends: the first is to enable local renewable energy to be used as a reliable source of power in a national or regional grid. Energy storage can offset the effects of intermittency by releasing energy when needed, increasing the acceptability of renewables as an important contributor to grid operations. The second is a shift from single-point and single-type energy storage to multi-point and multi-type storage. As energy storage evolves into a system, it can control, schedule and optimise multiple types of energy storage from different grid connection points in a holistic manner.
Energy storage drives the development of distributed renewable energy. Energy storage is a critical support technology for distributed generation and smart microgrids. It plays an increasingly important role in integrating, coordinating and managing multiple energy sources. Energy storage units are becoming more compact, modular and fast responding. As energy demand diversifies, and users of AC and DC power at different voltages coexist, energy storage will be the mainstream technology to enable end users to switch roles from power consumer to producer. Energy storage will be a buffer and an enabler of flexible and smart interactions.
Coordinated development of energy storage and electric vehicles. Electric vehicles (EVs) will be part of the future grid as an important means of energy storage. EVs have two main energy storage applications—they can transfer power from a secondary battery located outside of the vehicle, or the vehicle can act as an energy storage unit itself. As sales of EVs increase, the energy storage potential of a secondary battery will remain at around 15% of the capacity of the on-board battery. By 2020, the total energy storage capacity of EVs in China is expected to reach 3.766 GW/13.749 GWh, with 2.1 GW/10.4 GWh from secondary batteries.Footnote 19 In the future, the interaction between EVs and the grid will be two-way instead of one-way. EVs will feed energy into the grid and also function as a distributed energy storage source. In addition, they will provide many ancillary grid services, help consume distributed new energy and improve the cost effectiveness and security of grid operations.
The cloud will become a new type of energy storage in the future. According to research by scientists such as Kang Chongqing, cloud energy storage will be a grid-based service that allows consumers to use a shared energy storage pool at anytime and anywhere. It would lower the cost of providing energy storage services sharply. Cloud energy storage is part of the sharing economy in which assets, resources and services are shared by a group of individuals or companies. Cloud energy storage can be either a grid-scale centralised facility or a fleet of smaller distributed units, operated and managed by cloud energy storage providers.
6 The Implications of China’s Energy Revolution
Vigorous development of clean energy and building a diversified supply system are the foundations and goals of the energy revolution. International experience shows that changes in energy supply require policy support, innovation in production and supply technologies, the transformation of industry, and optimised allocation of investment and employment resources. This section of the report will analyse the implications of China’s energy supply revolution in four areas: energy supply, the transformation of industry and energy capacity, investment, and employment.
6.1 Energy Supply
As a result of the energy revolution, China’s future energy supply system will be diversified, comprising the clean and efficient use of coal and the robust development of other types of energy—oil, gas, nuclear power, new and renewable energy—as well as stronger transmission and distribution networks and the widespread use of energy storage. This will require changes in the way energy is produced and innovation in energy supply technologies.
6.1.1 Energy Supply Structure: The Energy Supply System Will Prioritise Non-fossil Energy and Conversion to Electricity
In the Recommended scenario of the energy revolution, fossil fuels’ share of primary energy will decrease annually, and non-fossil energy will gradually replace oil and coal to become the number-one energy source. Coal consumption will decrease sharply, and its share will drop to 27% in 2050 from 64% in 2015. Oil consumption will rise and then decline, although its share will remain steady at around 16% through to 2050. Natural gas, a cleaner energy carrier, will grow rapidly in the medium term, reaching 15% of the primary energy mix in 2030 and remaining stable thereafter. Non-fossil energy will increase substantially. In 2030, its share of the energy mix will exceed 20%, making it the second largest energy source after coal. In 2050, its share will be more than 40%, replacing coal as the number-one energy source (Fig. 59).

China’s primary energy supply system in the Recommended scenario
In the end-user energy supply system, electricity’s share will gradually increase from 22% in 2015 to 30% in 2030 and 38% in 2050. This will be made possible by the rapid development of clean energy and the use of clean coal. The share of renewable energy (wind, solar and biomass) and nuclear power will significantly increase. In 2030, the share of non-fossil energy will increase to 50.5%, exceeding that of fossil energy and becoming the main power source. By 2050, the share of non-fossil energy (installed capacity) will be more than 70% and the share of non-fossil energy output will be 66%. In the medium term, the total consumption of coal as primary energy will not change greatly; but its share of end-user energy supply will fall, even though installed coal power capacity will slightly increase. This shows that the energy supply revolution shifts from direct coal use to the conversion of clean and efficient coal into electricity (Fig. 60).

China’s end-user energy system in the Recommended scenario
6.1.2 Energy Production: A Combination of Centralised and Distributed Clean and Conventional Energy
One of the main goals of the energy revolution is to increase the use of clean, renewable energy. China’s clean energy sources and load centres are separated, in west and east China respectively. To achieve the goal of the energy revolution, the development of clean energy in these two regions needs to be coordinated. Coordination will result in an optimised energy system comprising large centralised renewable energy plants and outgoing transmission systems in west China and distributed energy systems in east and central China. These smaller distributed energy systems will consist of small wind farms, solar power, gas-fired combined cooling, heat and power (CCHP) and ground-source heat pumps (GSHP) connected to microgrids or local power distribution systems.
Coal will remain the main energy source in China in the longer term. To meet the targets of the energy revolution, coal needs to follow the principles of safe production, efficient development and ecological priority. At the exploitation stage (as primary energy), coal will change from extensive development to intensive and green production. In conversion (as secondary energy), coal-fired plants will be upgraded to ultra-low emission units using clean coal and high efficiency generating processes.
6.1.3 Energy Supply Technology: The Energy Internet and Demand-Side Response Will Optimise Supply from Multiple Energy Sources
Lateral multi-energy interconnection and vertical supply- and demand-side coordination will be an important way to implement the energy revolution. To integrate and coordinate multiple energy sources, networks, loads and energy storage, new energy supply technologies like the Energy Internet and demand response are needed.
The Energy Internet will enable deep integration between different energy sectors (coal, gas, renewables, etc.) and between the energy industry and other industries. It will also improve fossil energy use efficiency across all industries through digitalisation and the use of big data. Moreover, the Energy Internet will harness the full potential of the power system by increasing the share of clean energy in end-user energy consumption. This represents a shift in China’s long-established way of supplying and using energy, and a transformation of the link between socioeconomic development and energy consumption.
The Energy Internet can incorporate the different requirements of energy users and extend power demand-side management into integrated energy demand management, spanning the entire energy industry. It enables bidirectional flow and allows energy consumers to become energy producers, transforming the traditional way of meeting growing demand with increased energy supply.
6.2 Industry and Energy Capacity Transformation
In essence, the energy revolution is about changing the energy system, enabling it to shift from quantity-based to quality-based supply. It includes the development of low-carbon energy from high-carbon sources and the green development of black coal and oil, made possible by energy system reform and technology innovation. The energy revolution is continuously fostering new types of energy and making conventional types cleaner and greener. To slow down energy consumption growth, China’s energy industry needs to switch from extensive mode to efficient, high-quality development.
6.2.1 Industry Trends
The goal of energy supply is to build a secure, efficient, cost-effective, clean and low-carbon energy production and transmission/distribution system. To achieve this goal, energy sectors like coal, oil, natural gas and renewable energy need to urgently transform their current development mode into one that is green, efficient and cost-effective.
(1) Clean, efficient coal
Coal will remain dominant in China’s energy mix for a long time to come. Clean and efficient coal use is, therefore, an indisputable requirement for the coal sector. China identifies four priorities in coal: (i) shift development from resource-driven to innovation-driven; (ii) shift coal use from a fuel-only focus to one centred equally on fuel and the quality of the raw material; (iii) shift coal production from extensive to intensive green production; and (iv) shift coal utilisation from high-emission to low-emission, clean and efficient use.
(2) Green development of conventional and unconventional oil and gas resources
China’s onshore and conventional oil and gas production holds limited growth potential, and its exploitation of deep-sea oil and gas is low. However, China has abundant unconventional oil and gas resources. It should therefore adjust its oil and gas development strategies, switching focus from: conventional resources to an equal focus on conventional and unconventional resources; from onshore to an equal focus on onshore and offshore; from shallow reservoirs to middle and deep reservoirs; and to proactively develop clean and green oil and gas.
(3) Low-cost distributed clean energy
China’s clean energy development of wind, solar and biomass is still at an early stage. Renewables do not have a cost advantage over conventional energy, and their development relies on national policy support and price subsidies. To deliver the energy revolution goal of more clean energy, while remaining competitive and relieving the fiscal pressure on national government, China urgently needs to increase investment in clean energy technologies, reduce clean energy costs and encourage the development of distributed systems to use clean energy efficiently.
6.2.2 Energy Capacity Transformation
Replacing fossil energy with clean energy and substituting electricity for coal and oil is the key to addressing energy security, environmental pollution and climate change, and to achieving the energy revolution. In primary energy, the goal is to shift from predominantly fossil energy to predominantly clean energy. In secondary level conversion, the objective is to replace coal and oil with electricity and promote the deployment of electric boilers, electric heating systems and e-mobility to increase the share of electricity in end-user energy consumption and reduce fossil energy use and environmental pollution.
(1) The transformation of primary energy—substituting clean energy for fossil energy
This transformation is about substituting non-fossil energy for fossil fuels in the primary energy system. It requires replacing coal with cleaner natural gas in the fossil energy supply system, using clean coal in the coal supply system and accelerating the shift in coal from its extensive use as an all-purpose fuel to an emphasis on clean coal and raw material quality. The energy revolution will reduce coal production capacity by 115 Mt in 2030 and 153 Mt in 2050, a drop of more than 50% compared to 2015. Greater use of natural gas can offset 16% of this reduction, with the remainder met by non-fossil energy (Table 17).
(2) Secondary energy—substituting electricity for coal and oil
In the energy revolution, secondary energy conversion has two objectives: the first is to substitute electricity for coal and oil to increase the share of electricity in end-user energy consumption; and the second is to replace coal in power generation with clean energy like natural gas, wind, solar, hydropower and biomass. As the revolution progresses, new clean thermal power generating units will be built and existing outdated ones shut down. Some thermal power generating units will be transformed to gas-fired ones, and others upgraded to ultra-low emission status to reduce emissions of air pollutants. This will help achieve the shift to efficient, clean coal. As renewable energy expands, thermal power will be used increasingly for peak shaving. Gas-fired generating units will be used mainly for heating and as peak shaving for renewable energy (Table 18).
6.3 Investment
To deliver the energy revolution goal of transforming the energy supply system and greatly increasing the share of clean energy, China’s energy industry needs to invest more in both clean energy and the clean use of fossil fuels. In recent years, China’s investment in clean energy has prioritised renewables. However, with the energy revolution, China will also invest in building clean energy transmission systems, R&D and skills development. As the marketisation of the energy industry improves, its investment targets will diversify and more private capital will finance transmission system construction and equipment manufacturing, where previously state funding was predominant.
6.3.1 Diversification of Investment Priorities
In the energy revolution, investment will focus on clean energy, energy infrastructure, primary energy exploitation and secondary energy conversion. To deliver the energy system described in the Recommended scenario, by 2030 new investments in primary energy exploitation, installed power capacity and energy transmission systems need to be RMB 10.9 trillion in total. In 2030–50, new investments in the same three categories need to reach RMB 35.37 billion, RMB 12,194.87 million and RMB 4,057.3 billion respectively, amounting to RMB 16,287.55 billion in total. In the medium and long terms, the energy revolution will stimulate a total of RMB 27.2 trillion of investments, of which renewable energy like wind and solar power will take the largest share (Tables 19, 20, 21 and 22).
6.3.2 Diversified Investment Sources
In accordance with China’s Strategy of Energy Production and Consumption Revolution (2016–30) issued by the State Council, China will reform the administrative approval system for the energy industry. It will also revise the negative list restricting foreign investment and market access and encourage and guide market participants to legally and equally invest and operate in those energy fields not on the negative list.
Currently, state-owned capital dominates investment in China’s energy industry, although there is some private capital invested in renewable energy like wind and solar. However, most investment in distributed energy resources is by users. As development of renewable energy, distributed energy-based microgrids and the Energy Internet gathers pace, the amount of private capital invested in these areas will increase.
Marketisation of the energy industry will also diversify investment sources. Currently, the new round of power market reforms has deregulated the additional power distribution and sales businesses, allowing private capital to take part. Oil and gas market reforms have deregulated unconventional oil and gas exploitation, oil and gas pipelines and crude oil reserve storage. As energy sectors are further deregulated, investors in energy production, transmission system construction and equipment manufacturing will also diversify.
6.4 Employment
Currently, China’s energy supply-side reform focuses on five issues: cutting overcapacity, reducing excess inventory, deleveraging, lowering costs and strengthening weaknesses. Cutting overcapacity will result in large-scale outflows of personnel from conventional energy sectors like coal, causing severe unemployment and reemployment difficulties. On the other hand, the rapidly developing clean energy sector urgently needs a large number of highly qualified people, creating considerable employment opportunities for those with the right skills.
As the energy revolution deepens, China’s modernised and technologically more advanced energy industry will place higher demands on the labour force. In short, more quality and less quantity will be required. Moreover, industrial, regional and structural imbalances in the workforce will become evident.
6.4.1 Industrial Structure of Employment
Cutting overcapacity will have a negative impact on employment in conventional energy sectors like coal. According to the State Council, in 3–5 years from 2016, about 500 Mt of coal capacity will be shut down and 500,000 employees (about 10% of the workforce in the coal sector) will require reemployment. In 2015–50, the number of workers employed in the coal sector will fall by more than 2 million, compared to the scenario where energy supply revolution measures are not taken (Tables 23 and 24).
Coal aside, the energy revolution will not lead to large-scale personnel outflows from the energy industry. On the contrary, it will create more jobs. More than 6 million employment opportunities will be added to the energy industry by 2050, thanks mainly to the energy transition. Clean energy sectors like wind, solar, nuclear and biomass will develop rapidly, creating a vast number of employment opportunities in technology development, equipment manufacturing, installation and maintenance. It is projected that the new energy sector will create 4 million new jobs for the entire energy value chain by 2030, and more than 8 million new jobs overall by 2050. The new energy industry will play the role of stabiliser by absorbing surplus workers from conventional energy sectors. For example, those workers from the coal sector with less expertise and fewer skills could work in infrastructure construction. The development and deployment of energy-efficient technologies will also create employment in the technology and service fields (Fig. 61).

Employment trend in the energy industry in the Recommended scenario (in 100,000)
6.4.2 Regional Structure of Employment
China’s energy industry is faced with two contradictory challenges: excess supply of inadequately skilled labour and a shortage of qualified people with the right skills in renewable energy, energy transmission systems, and emerging services like demand-side response, energy efficiency and integrated energy management. China’s energy revolution will, therefore, impact different provinces in different ways, depending on the structure of the energy industry within their domain.
In provinces such as Zhejiang, where the new energy and energy service sectors are developing well, the energy revolution will have only a slight impact on the provincial employment structure. Thanks to higher revenues and the creation of numerous employment opportunities by the new energy industry, surplus employees from capacity-cutting sectors can be repositioned within those provinces.
In provinces like Shanxi and Inner Mongolia, where conventional energy sectors like coal dominate, the energy revolution will have a greater impact on the employment structure. On the one hand, there is high unemployment in capacity-cutting sectors like coal. On the other hand, these provinces have relatively abundant new energy sources. Yet, despite large amounts of new energy capacity, wind and solar curtailment is severe. The new energy sector in these provinces has, therefore, limited development potential in the near future and cannot absorb surplus employees from the conventional energy sectors. High unemployment and economic downturn will form a vicious circle, resulting in outflows of skilled young residents. This will in turn adversely impact the provinces’ future economic development.
6.4.3 Employment Supply Structure
The workforce in China’s energy industry encompasses rural migrant workers, graduates from vocational schools, and graduates from colleges and universities. As there is a relatively large number of rural migrant workers in primary energy exploitation (mainly coal), capacity-cutting will hit those workers hard. Booming clean energy fields like wind, solar and nuclear power require skilled people. They need employees with expertise in the relevant technologies. Increasingly, graduates from vocational schools and colleges and universities will be attracted to these sectors.
Graduates from vocational schools are generally more educated than rural migrant workers and more skilled than college graduates. They also have a comparative advantage in labour cost than rural migrant workers and the average college graduate. In the future, they might be employed in clean energy equipment manufacturing, installation and maintenance.
Relative to the lower-wage requirement of rural migrant workers and the higher reward/price ratio of graduates from vocational schools, college graduates with better skills are mainly working in technical development in the energy industry. However, the number of college and university graduates is growing rapidly. In 2015, a record 7.49 million students graduated from colleges and universities in China. In addition, as university college reform progresses slowly, and graduate qualifications deviate to some extent from societal requirements, the employment situation in China, especially in those provinces with a large number of graduates, looks grim.
7 China’s Energy Revolution: Measures, Policies and Adjustments
The low-carbon and efficiency requirements of the energy revolution drive the transformation and diversification of the energy supply system. To deliver a successful energy revolution, measures need to be taken to cut capacity in, and shift to the clean production of, primary energy, and expand secondary energy applications. Policies and proposals need to be developed to guide investment in the relevant energy sectors and solve the reemployment problem of surplus workers laid off by conventional energy companies. This section will, therefore, analyse the measures, policies and proposals for China’s energy revolution from the following three perspectives: the primary energy revolution, the secondary energy revolution, and policies and proposals for energy supply-side investment and reemployment.
7.1 Measures for the Primary Energy Revolution
Excessive energy consumption and environmental degradation urgently require the energy revolution to make progress. The goals of the primary energy revolution include: (i) substituting clean energy for fossil energy, shutting down outdated capacity and shifting to the green production of fossil energy; (ii) the rapid development and efficient use of renewable energy; and (iii) the development of new energy production technologies, exploration, and the use of this new energy.
7.1.1 Fossil Energy Supply Revolution
The fossil energy revolution mainly concerns coal, oil and gas. In terms of coal, the revolution is about the safe, cost-effective, green and efficient development of coal resources. In terms of oil and gas, it requires an equal focus on conventional and unconventional resources—onshore and offshore and at all depths, from shallow to ultra-deep.
(1) Coal supply revolution
(1) Keep the exploitation of coal resources within acceptable environmental limits to ensure reasonable and scientific capacity
Coal production should be reduced and the low-carbon and zero-carbon world energy trends fully understood to ensure that the coal industry is aligned with scientific capacity requirements.
(2) Environmentally friendly coal production
The principle of clean coal should be followed and new technologies like water-preserved mining and cut-and-fill mining promoted to reduce land collapse in worked-out sections. Land rehabilitation efforts should be increased and ecological recovery and governance technologies deployed. Quality coal processing technologies should be widely used to improve coal washing and dressing.
(3) Improve integrated coal production
To make coal production efficient, significant improvements should be made in: (i) the recovery rate of integrated coal resources with gas and water extraction; (ii) the comprehensive reuse of coal gangue and mine water; and (iii) the coalbed methane recovery rate. Efficient coal mining technologies should be deployed to raise the level of mechanisation and automation. Gas, water and other resources should be extracted during mining to make coal recovery cost-effective and sustainable.
(2) Oil and gas revolution
(1) Unplug technical bottlenecks in the exploration and development of unconventional oil and gas
Priority should be given to accelerating the exploration and development of tight oil and gas and to making breakthroughs in super-lateral well drilling and multistage fracturing technologies. Coalbed methane (CBM) exploration and development should be promoted and advances in various emerging technologies made to enable CBM extraction to shift from high-quality reservoirs to deeper, more complex strata.
(2) Develop deep and ultra-deep offshore oil and gas at scale
Strong efforts should be made to solve such difficult challenges as identifying deep reservoir targets, working at high temperatures and in complex lithology, and extracting oil and gas from deep carbonate, clastic and volcanic rock. Offshore oil and gas engineering equipment and technologies should be developed, as should semi-submersible drilling and production platforms and subsea production systems to speed up the exploration and extraction of deep-sea oil and gas.
(3) Promote clean oil and gas development
A blueprint for oil and gas field construction should be drawn up to minimise field footprint and reduce oil and gas losses. Waste collection, treatment and disposal should be centralised. Environmental impact assessments (EIA) should be carried out when decommissioning oil and gas fields, and ecological recovery made in accordance with the EIA results. The sealing processes in oil and gas collection and transmission should be strengthened to reduce gas emissions. An EIA and information disclosure system should be created to strengthen supervision and ensure environmentally friendly oil and gas development.
7.1.2 Non-fossil Energy Revolution
The non-fossil energy revolution refers mainly to renewable energy and nuclear power. For renewable energy, it means increasing the share of renewables in the energy mix. For nuclear power, it means safety and substituting nuclear for fossil energy.
(1) Renewable energy revolution
(1) Protect the environment and deliver the hydropower development goal
Large hydropower stations should be built to deliver the hydropower development goal, on the understanding that strict environmental protection requirements are met and displaced people relocated correctly.
(2) Construct support facilities to develop wind power in an orderly way
At the introductory stage of wind power development, onshore and offshore wind power should be complementary. Priority should be given to wind power development in north, north-east and north-west China, eastern coastal China and areas with medium and low wind speed. At the mid-developmental stage, equal focus should be placed on developing onshore and offshore resources. And at the mature stage, offshore wind power should be fed into load centres.
(3) Use different solar technologies to ensure solar power generation is optimised for local conditions
In desert areas with abundant solar energy in west and north China, solar power development should be given priority. In medium-sized and large cities in east and central China, building-integrated photovoltaics should be encouraged and grid-connected rooftop PV systems widely deployed. In regions that feature good sunshine conditions, large areas of available land and abundant water resources, solar thermal pilot projects should be tested. In this way, different solar power technologies will be combined to deliver complementary benefits.
(4) Develop liquid biofuels and substitute them for oil at scale
In the short and medium terms, more effort should be made to develop non-grain liquid biofuel technologies to lower the production cost of non-grain liquid biofuels. As breakthroughs are made in second- and third-generation biomass technologies like cellulosic ethanol and algae-based fuel, liquid biofuels should gradually replace petrol, diesel and kerosene in heavy-duty road transport, aviation and shipping.
(5) Use renewable heat at scale
Solar thermal energy can play an important role in heating or cooling water, homes, industry and commerce. In both rural and urban areas, biogas and biomass briquettes should be promoted to fuel cooking and boilers.
(2) Nuclear power revolution
(1) Significantly increase nuclear power capacity
Third-generation pressurised water reactor technology should be deployed to increase investment in nuclear power plants in eastern coastal areas. Effective measures should be taken to protect plant sites and strengthen nuclear power development in central China, building a nuclear power belt across eastern and central regions.
(2) Become a hub for the global nuclear power industry
China’s nuclear power equipment manufacturing and project construction capability should be enhanced to complement nuclear power development in east and central China. Strong efforts should be made to actively create national brands for China’s future nuclear power technologies and equipment, enabling them to go global.
(3) Foster an atmosphere of acceptability for nuclear power development
A science-based decision-making system should be established and long-term development strategy drawn up to bolster the growth of nuclear power. More effort should be made to improve laws, regulations and supervision, ensure consistent decision-making, create positive publicity and guidance, and improve information disclosure, thus building up public confidence in and acceptance of nuclear power.
7.1.3 Promote New Energy Production Technologies
New energy production technologies could potentially provide a richer range of energy sources for production and living. These mainly include the exploration and production of natural gas hydrates (NGH), advanced nuclear power and marine energy.
(1) Research NGH exploration and exploitation
China has abundant NGH resources in polar tundra sandstone and seabed sandstone reservoirs. It should strengthen basic research to deliver a complete range of support technologies for NGH exploration and production. China should accelerate NGH resource surveys and screen potentially profitable exploration areas to implement drilling and trial extraction of NGHs. The aim should be to achieve earliest commercial extraction, thus sharpening China’s international competitiveness in NGH exploration and exploitation.
(2) Explore and develop more advanced nuclear power technologies
Guided by the inherent safety concept, China should research and develop fourth-generation safe reactor technology to continue the nuclear power revolution. International collaboration and capital investment should be strengthened to explore and develop advanced nuclear technologies like fusion power.
(3) Forward-looking research on marine energy
China has a vast coastline, which means it has abundant marine energy. R&D is pivotal to finding ways to convert marine energy into reliable and accessible energy carriers like electricity. As these technologies progress, marine energy is expected to become an important part of China’s future energy system.
7.2 Measures for the Secondary Energy Revolution
Electricity-centred energy supply becomes increasingly important in the energy revolution. It is an efficient and easily accessible secondary energy carrier, with the potential to be clean and carbon-free. The strategy of replacing coal and oil with electricity and long-distance clean power transmission is a priority goal of China’s secondary energy supply revolution.
7.2.1 Combine Centralised and Distributed Energy Optimally
Centralised power generation and supply have dominated China’s energy system and driven China’s socioeconomic development forward. However, because distributed energy systems have lower electrical losses, are more efficient and more environmentally friendly, China’s energy system is shifting towards a combination of centralised and distributed energy supply. This is an irreversible trend in China, and the only way to ensure an optimised and clean energy system.
7.2.2 Replace Fossil Energy with Electricity
Replacing fossil energy with electricity means coal, oil, gas and direct fossil fuel burning. Electrical equipment should be extensively deployed to reduce fossil energy consumption. This conserves energy resources and reduces wastewater, residuals and exhaust gas, thus helping to deliver China’s energy efficiency and emissions reduction strategy.
7.2.3 Increase Demand-Side Response
Reasonable pricing and incentive mechanisms should be developed, and flexible demand-side response resources coordinated—such as distributed energy systems, energy storage and electric vehicles—to drive users to implement demand-side response. This will help reduce peak loads and peak-valley differences. It will lessen the need for new power generating capacity and for more power transmission and distribution systems. The efficiency and reliability of existing systems will improve, as will the use of critical resources like land, capital and human resources.
7.3 Policies and Proposals for Supply-Side Investment and Reemployment
Replacing fossil primary and secondary energy with cleaner alternatives and electricity respectively will shift China’s energy supply system towards a low-carbon future. New investment opportunities will arise. There will, however, be costs. Shutting down outdated capacity will result in unemployment in conventional energy companies. Investment in clean energy needs to be guided and conventional energy companies helped to reposition their surplus workers. Both factors are important to a successful delivery of the energy revolution.
7.3.1 Supply-Side Investment Guidance
Development of clean energy is one of the major tasks of the energy revolution. Investment guidance is therefore important. In recent years, several problems have been exposed, such as: increasingly severe wind and solar curtailment, despite a sharp increase in installed capacity; and weak market competitiveness and low marketisation due to instability in clean power generation. Policies and suggestions for supply-side investment are necessary.
(1) Increase investment in clean energy R&D
Government should play a leading role in encouraging investment in clean energy research and development, providing companies with the policy support they need. Reducing production costs through technical innovation is the key to clean energy development. Clean energy R&D should deliver technologies and products with proprietary intellectual property rights. It should feature collaboration with industry, universities and research institutions, and support the development of a clean energy industry.
(2) Encourage investment in energy storage and support facilities
Policies encouraging investment in energy storage will help further clean energy development and grid connection. Government authorities can introduce a compensation mechanism for energy storage system operators to provide ancillary services and encourage clean energy providers to install energy storage systems. This will better facilitate grid connection and maximise use of clean energy generation.
(3) Implement environment-related tax incentive policies
Levying an environmental tax is a relatively common practice to promote clean energy development. It enables government to discourage emissions and discharges through taxes. A pollution tax could be levied on companies that discharge pollutants during production. It would dissuade high energy-consuming and high-pollution companies from using conventional energy. This will reduce energy consumption, encourage the use of clean energy, and help protect the environment. A proportion of the taxes levied could be used for pollution control and part of them to fund clean energy development.
(4) Improve clean energy grid connection and consumption
Implementing the policy that prioritises clean energy for grid connection and consumption plays an important role in clean energy development. The policy is recommended for implementation at local level. Local energy planning authorities can measure their power consumption and peak shaving capability and then identify the clean energy quota that can be connected to the grid and consumed through bidding.
7.3.2 Supply-Side Reemployment
The energy revolution will improve the overall employment structure, but it will also generate unemployment. Given the multiple effects of the energy revolution on employment, policies and proposals on how companies should reposition surplus workers and government solve unemployment are necessary.
(1) Companies should create channels to reposition surplus workers
In supply-side reforms, capacity cutting will inevitably cause unemployment. The relevant enterprises should think about how to actively and properly reposition surplus workers through several channels, thus gradually alleviating unemployment by region and sector. The repositioning of surplus workers in companies facing overcapacity should begin by safeguarding workers’ rights and interests. The channels for repositioning surplus workers should be expanded to include internal job transfer, starting a business, early retirement and public-service jobs. Government will provide the relevant support policies for companies that hire surplus workers laid off by capacity cutting. Surplus workers who want to start a business should be offered the chance to enter a business incubator. For surplus workers who are difficult to reposition, public-service jobs will be a priority.
In the context of the energy revolution, the channels to address surplus worker reemployment are shown in Fig. 62.

Channels to address surplus worker reemployment
(2) How government should address reemployment
In the short term, supply-side reforms will inevitably impact adversely workers in some regions and sectors. In the long term, a structural imbalance in employment will be more evident than an imbalance between supply and demand. To ensure a smooth and orderly employment market, labour demand should be optimised in the short term and labour supply improved in the long term. The public employment service and social security systems should also be improved to match labour supply with demand and provide basic job security.
(1) Short-term optimisation of labour demand
(i) The structure of the energy industry should be adjusted and emerging businesses with a strong job-creating capability developed. The service industry has stronger job-creating potential than manufacturing, so its share of employment should increase.
(ii) Adjustment of the corporate ownership structure should be speeded up, and medium, small and micro-sized private enterprises prioritised. Private enterprise has become the main channel to address the employment challenge. Relevant support policies need to be implemented to encourage and grow more private enterprises, especially those in technology.
(2) Long-term improvement of labour supply
(i) Adjustment of academic disciplines should be accelerated to effectively lead and match societal requirements. Universities and colleges should adjust their academic disciplines and programmes to correspond with socioeconomic developments. They should channel more effort into developing talent and play an effective role in leading and supporting industry advancement.
(ii) Adjustment of the educational structure should be faster and vocational education strongly promoted. Vocational education should be included in the national education plan and given priority. Investment in vocational education should be increased. Vocational schools should be guided to collaborate with companies, to develop the talent and skills needed by society.
(3) Improvement of the public employment service and social security systems
(i) The social security system should be improved and include a basic government guarantee. The share of commercial insurance in healthcare and the pension system should be gradually increased. Cross-provincial commercial insurance should be improved to reduce labour transfer costs and integrate labour markets across China. This will facilitate cross-provincial coordination of employment.
(ii) The public employment service should be improved to match labour supply with demand. Existing employment and training policies should be optimised to improve quality and provide the skills required for job transfers and reemployment, thus creating an effective employment training system.
Appendix 2: United States Energy Transitions to 2050: Trends, Challenges and Targets
This appendix summarises the slide deck created by University of California, Davis, for Shell on United States transitions to 2050: Trends, challenges and opportunities, and serves as a companion to that presentation. It covers recent research reports on US energy futures to 2050 and draws conclusions on where the US energy system is headed, and how policies might change this future. It also relates the US situation to that of China and draws lessons that may be of interest to the Chinese context.
We relied on several major reports, including those of the U.S. Energy Information Administration (EIA 2017), the U.S. Department of Energy (DOE 2016), the International Energy Agency (IEA 2017) and BP (BP 2017), as well as other reports for specific topics. These are listed at the end of the appendix.
1. Summary of our findings
Our key findings include:
-
given current trends, the USA will reach flat energy use and marginally declining oil and CO2 emissions after 2030; there will be no deep reductions without major new policies;
-
natural gas rises to match oil as the biggest US energy source after 2030; renewables remain far below;
-
however, renewables for power generation rise dramatically to 2040, nearly matching gas; both rise at the expense of coal;
-
wind power becomes the top renewable power source after 2020 (passing hydro); solar passes hydro a decade later;
-
CO2 emissions decline little overall, as decreases in transport and power generation are partially offset by rising industrial emissions; and
-
the potential for large oil reductions mainly resides in light-duty vehicle efficiency and electric vehicles, but EVs have little effect until after 2035. Efficiency improvements are 10 times more important to 2030.
The following figures tell much of the story. The EIA Reference case projection of energy use is shown in Fig. 63. From now to 2040, the EIA projects that total US energy demand will be roughly flat, with a rise in natural gas and non-hydro renewables offsetting a decline in coal, with nuclear, hydro and oil use remaining fairly constant. The lack of decline in oil use relates to ongoing increases in travel in the USA, barely offset by increases in energy efficiency and fuel-switching in that sector.

Source EIA (2017)
Energy consumption (Reference case) in quadrillion British thermal units.
In energy production (Fig. 64), natural gas will continue to rise steadily, keeping prices low, while oil will plateau but avoid a decline as new capacity comes online. The steady rise in renewable energy production is enough to compensate for the decline in coal production by 2040, but remains far below oil and gas production.

Source EIA (2017)
Energy production (Reference case) in quadrillion British thermal units.
In terms of electricity production, renewables—specifically wind and solar power—are expected to rise dramatically (Fig. 65), with wind passing hydro as the leading source by 2020 and remaining the top source to 2040, despite plateauing in 2025. Solar rises steadily, with both utility-scale and end-use applications growing at a rapid rate over the timeframe.

Source EIA (2017)
Renewable electricity generation (Reference case) in billion kilowatt-hours.
Even EIA “side cases”, such as the high oil price case and the low economic growth case, show relatively little decline in CO2 over the timeframe (Fig. 66).

Source EIA (2017)
Energy-related CO2 emissions in billion metric tonnes of CO2.
The U.S. Department of Energy released a very different vision of the future at the end of the Obama Administration in 2016: The United States Mid-Century Strategy for Deep Decarbonization. This featured a major shift to electricity across the energy economy, with deep decarbonisation of electricity largely due to faster renewables growth than in the EIA Reference case. It also included very strong increases in transport efficiency and slower demand growth, coupled with a shift away from oil towards electricity and biofuels. This combination, with some supporting measures in other sectors, provides a pathway for an 80% reduction in CO2 by 2050, but achieving this would require much stronger policies than exist today (Fig. 67).

Note CCUS = carbon capture, utilisation and storage. Source U.S. Department of Energy (2016)
U.S. DOE Mid-Century Strategy scenario, electricity and transport energy projections.
2. The USA and China
Our key findings on the USA that have implications for China include:
-
the rise in US shale oil (horizontal fracking) production has greatly increased domestic oil supply and lowered natural gas prices, both of which are absent in China;
-
the increase in natural gas and renewable electricity generation (and slower demand growth) has enabled a more rapid decline in coal use than has been possible in China;
-
although renewables (solar photovoltaic and wind) are rising rapidly in the USA, the pace is behind China and the absolute value is far behind;
-
electric vehicle (EV) sales growth in the USA is projected to be similar to China, although China’s very recent adoption of a new energy vehicle credit policy will likely accelerate growth; the overall size of the EV market appears much larger in China, where the government has announced aggressive EV sales targets of 20% of new vehicle sales by 2025;
-
CO2 emissions decline marginally in the USA, while they rise in China; both nations will need to turn a corner to achieve outright reductions; renewables growth, along with nuclear growth in China, will be the key to this in both cases; and
-
the potential for deep oil demand reductions mainly reside in light-duty vehicle efficiency and EVs, but EVs have little effect until after 2035. Efficiency improvements are 10 times more important to 2030.
Considering both oil supply and demand, BP Energy Outlook 2017 shows China with major oil demand growth to 2040, and the USA important in supply growth (Fig. 68).

Source BP Energy Outlook 2017
Growing oil demand in emerging economies.
BP also expects a very similar percentage growth in renewables for power generation to 2040, though with much higher absolute levels (and thus share of total global growth) in China. This reflects China’s rapidly growing electricity market, among other things. The EU will remain the highest in terms of renewables’ share of electricity (Fig. 69).

Source BP Energy Outlook 2017
Renewables share of power generation and by region.
BP estimates that wind costs are already lower in North America (mainly the USA) and China than coal (Fig. 70); solar and wind become the cheapest options in both countries by 2035. These low costs will drive both the rise in these renewables and an eventual decline in coal power in both countries.

Source BP Energy Outlook 2017
Renewables growth is driven by increasing competitiveness.
In the light-duty vehicle sector, both the USA and China are expected to experience rapid increases in electric vehicle market penetration. Bloomberg (2017) projects that EVs will reach almost 50% of new car sales by 2040 in both countries (Fig. 71). China’s slightly slower start in EV sales has been offset by very rapid increases over the past two years, and this is expected to continue. The introduction of new models in both the USA and China, along with incentives and the provision of recharging infrastructure, is driving growth.

Source Bloomberg New Energy Finance (2017)
Electric vehicle sales projections.
The International Energy Agency (IEA 2017) projects that, under their respective Paris Agreement nationally determined contributions, US CO2 per capita would drop dramatically by 2030 while China’s would be flat. Although China (and most other countries) starts from a much lower position and would remain lower than the USA (Fig. 72).

Note PPP = purchase power parity. Source IEA (2017)
CO2 emissions for GDP/per capita for different countries.
3. Technology trends
A range of technology trends in the USA and beyond was identified in the IEA 2017 report, including:
-
solar photovoltaic (PV) costs decline by 50% from 2010–25 and become competitive with natural gas; wind power is often competitive now;
-
fracking has led to both an increase in oil supply (and projected future supply) and low-cost natural gas; this is expected to continue for at least the next decade;
-
tight/shale oil production rises marginally from 2020–25, then flattens to 2040—but there is no significant decline;
-
electric vehicle growth is largely technology-driven; future projections to as high as 30% of vehicle sales by 2030 depend on reductions in battery costs and performance improvements;
-
there is no major revival of nuclear—generation declines slowly to 2040; and
-
a deeper reduction in CO2 emissions in the future is partly dependent on greater use of solar PV and wind, and on battery costs continuing to decline.
The example of declining solar PV costs driving growth is highlighted in the EIA data in Fig. 73. As PV costs have dropped over the past decade, installations have grown rapidly. While cost reductions will slow, the impacts will continue to be felt in rapid PV growth in the USA.

Source EIA (2017)
Levelised cost projections by technology, 2022 (in 2016 $ per megawatt-hour).
PV technology penetration will be driven largely by on-site installations, especially for residential use. The EIA projects this to reach 100 GW by 2040 (Fig. 74).

Source EIA (2017)
Building sector on-site generating capacity in gigawatts.
The EIA projects electric vehicles in the USA to approach 2 million vehicles by 2040, or about 10% of total light-duty vehicle sales (Fig. 75). Other sources project higher levels (Fig. 76). In any case, the cost and performance of batteries, along with the availability of recharging infrastructure, will likely determine how far EVs grow.

Source EIA (2017)
Projected sales of new light-duty electric vehicles in thousands of vehicles.

Note BNEF = Bloomberg New Energy Finance; Exxon = ExxonMobil; OPEC = Organization of the Petroleum Exporting Countries; IEA = International Energy Agency. Sources Bloomberg New Energy Finance, New Energy Outlook 2017. BP Energy Outlook 2017. International Energy Agency, World Energy Outlook Special Report: Energy and Climate Change, 2015. International Energy Agency, World Energy Outlook 2016. Natural Resources Defense Council, Americas Clean Energy Frontier: The Pathway to a Safer Climate Future, 2017. U.S. Energy Information Administration, Annual Energy Outlook 2017. U.S. Department of Energy: United States Mid-Century Strategy for Deep Decarbonization, 2016. University of California, Davis, Three Revolutions in Urban Transportation, 2017
Projected stock of electric vehicles.
Most EV projections to 2030 and beyond are far higher than the EIA’s, and have increased from 2016 to 2017, reflecting a growing optimism that the EV’s time is coming (Fig. 76; note that Fig. 76 shows stocks while Fig. 75 shows sales).
Appendix 3: Lessons from Supply Revolutions in the Nordic Countries
1. Summary of our findings
Supply revolutions fundamentally change the energy mix to meet the changing goals of society. Momentum for a supply revolution can gather pace as economies develop and demand new energy services or combat pollution, or discover new energy resources and invent new technologies, or face external supply shocks. This involves the simultaneous uptake of new fuels and the abandoning of existing fuels, or at least an end to the growth of existing fuels. The goals of China’s energy system are becoming increasingly important: to improve energy quality and access, meet growing energy demand, drive investment into new technology and maintain energy security. They are likely to necessitate a shift from coal to new energy sources, such as gas, nuclear and renewable power.
These goals cannot be met without the cooperation of stakeholders in the energy system. The key stakeholders are consumers, who will ultimately pay for a transition; companies, who will implement the transition; and energy workers, whose livelihoods will depend on the transition. These stakeholders must be considered by policymakers when planning a supply revolution, as either their cooperation is needed, or their opposition avoided.
The Nordic countries, in particular Denmark and Norway, are at the frontier of reducing the environmental impact of their energy systems. Denmark is unique in having integrated very high levels of variable wind power into its electricity system, while maintaining energy supply security. Norway is a pioneer in adopting electric vehicles and decarbonising its transport sector. Despite their relatively small size, the energy transitions of both Denmark and Norway offer interesting lessons for China, as the Nordic countries are global leaders in the energy transition.
These two case studies, on Denmark and Norway, extend a previous report, which considered the supply revolutions in Germany, France, Japan and the UK.
(1) Consumers
The case studies suggest that consumers will participate in the energy transition if it is subsidised, as was the case in Norway, and they may even pay for the transition if they are convinced of the environmental benefits, as in Denmark. However, both the Norwegian electric vehicle (EV) subsidies and the Danish energy taxation system that finances the deployment of offshore wind suffer from design problems that Chinese policymakers can learn from. Specifically:
-
China may wish to align carbon costs by implementing a universal carbon price and support R&D in green technologies to reduce the cost of transition. Both the Danish energy taxation system and the Norwegian EV subsidies failed to align carbon costs with mitigation opportunities; this is likely to have increased the total cost of the Scandinavian transitions, as the most expensive mitigation options were encouraged by policy. Norwegian EV subsidies have been an expensive way to reduce carbon, and cheaper reductions could likely have been made in other sectors of the economy or by investing in R&D to reduce EV costs. Likewise, Danish taxes were unequally distributed across energy carriers and sectors. As a result, industry has had insufficient incentives to reduce energy consumption and emissions. This is unfortunate because similar decarbonisation levels could have been achieved at a lower cost if policies had been technology-neutral and all sectors and carriers had been treated equally.
-
China may wish to further evaluate the distributional consequences of planned energy policies. Both the Danish and Norwegian energy transitions have had unforeseen distributional effects. Norwegian EV subsidies have favoured city dwellers who experienced greater benefit from in-kind subsidies, such as free parking and the use of bus lanes during traffic congestion, than rural citizens. This is good from an environmental efficiency perspective as air pollution is more problematic in cities. However, the system favours richer citizens as they tend to live in cities and the policy might therefore widen inequality. Likewise, the burdens of Danish energy taxation have been unequal, with residential consumers and small and medium-sized enterprises (SMEs) paying for the transition. This has protected heavy industries but has put significant pressure on household energy bills, which hit poorer households disproportionally hard.
(2) Companies
The Danish and Norwegian cases illustrate that companies can both finance and benefit from the energy transition. National oil companies (NOCs) have been a key part of the transition, both in Norway and in Denmark. In Norway, Equinor (previously Statoil) and many international oil companies (IOCs) have helped finance the transition through their petroleum taxes. In Denmark, DONG Energy has transformed from being a conventional NOC into a largely green energy service company that develops Danish offshore wind resources. To reflect this transition, DONG, which was short for Danish Oil and Natural Gas, renamed to Ørsted in October 2017, after a Danish scientific innovator, given the company no longer operates in oil and gas. Both cases illustrate how companies, and in particular NOCs, can be the key to the transition. However, the Scandinavian cases highlight that a series of supporting conditions must be in place if the transition is to be successful. Specifically, two lessons can be learned:
-
China may wish to develop credible and long-term strategies for its energy transition, as it gradually moves towards non-subsidised systems and as technology costs are reduced. The Nordic countries are characterised by strong institutions and widespread public-private partnerships, which have enabled the energy transitions of Norway and Denmark. Norwegian petroleum tax revenues, which have helped finance its energy transition, are the result of attracting investments in domestic oil and gas exploration and development. This has been possible through a petroleum tax system that is credible and shares risks between government and companies. For example, the government of Norway shares exploration risk with oil and gas companies through tax exemptions and the ability to deduct losses. Likewise, Danish government subsidies for offshore wind and its support for R&D have been long term and credible. This has allowed developers to reduce deployment costs and finance their investment through pension funds and other private investors. Both the Norwegian and Danish cases highlight the importance of credible policy that includes an element of risk sharing between the government and the private sector.
-
China may wish to integrate different energy resources—such as nuclear, wind, solar and hydro—and provide public oversight of infrastructure development to reduce system integration costs. Government provision of public goods, such as system integration and pipeline infrastructure, has been key to both the Norwegian and Danish energy transitions. In Norway, the petroleum tax base rests on a publicly managed and regulated infrastructure system for oil and gas transport. Likewise, the Danish wind transition rests on public action to improve infrastructure and reduce system integration costs. High levels of offshore wind integration have only been possible due to a combination of interconnections with neighbouring electricity markets and incentives to make conventional power plants more flexible. These public initiatives have reduced system integration costs and made the Danish energy system capable of integrating significant quantities of renewables.
(3) Energy workers
The Danish and Norwegian energy transitions have had very different employment outcomes. In Norway, there were almost no green manufacturing jobs created, as the country did not have an indigenous automotive industry. In contrast, the Danish wind revolution resulted in the development of a domestic industry, which is today internationally competitive and supports a significant number of green manufacturing jobs. The Scandinavian cases present three important insights for China:
-
China may wish to take advantage of early adoption to gain comparative advantage and ease the transition for its energy workers. Denmark benefitted from being an early mover in offshore wind, providing many of the initial technology advances, and therefore became home to a fast-growing industry. As a result, the transition created a significant number of green manufacturing jobs in Denmark. In contrast, Norway did not see a similar benefit from its EV transition because it did not host a domestic automobile industry. Instead, it had to import vehicles and pay high subsidies because EV costs had not yet come down when it began its transition.
-
China may wish to combine its renewable energy policy with a regional development strategy to maximise the benefits for its energy workers. The energy transition has benefitted poorer rural areas of Denmark where wind power has been developed and deployed. A similar pattern is seen in other countries, such as the UK and the USA, as wind resources are often located far from conventional centres of economic activity. The spatially dependent characteristics of many renewables, such as solar and wind, can therefore be seen as an advantage and can be integrated into a wider regional development strategy.
-
China may wish to reskill hydrocarbon workers and establish educational hubs that can educate the workers required for the energy transition. The case of Denmark illustrates how workers can be reskilled and transferred from oil and gas production to the renewables industry through targeted educational programmes. A specific example is the Port of Esbjerg, which used to be the primary base for servicing Danish oil and gas production in the North Sea but is increasingly becoming a base for offshore wind operations and maintenance. This demonstrates how workers can be transferred from developing hydrocarbons to renewable energy resources.
2. Overview of supply revolutions
(1) Norway
Norway has paradoxically emerged as a world leader in climate action, despite being one of the largest producers of hydrocarbons. Oil and gas dominate domestic energy production, representing about 94% of total Norwegian energy production in 2014. However, more than 90% of this production was exported. In contrast, hydropower provides most of Norway’s domestic electricity consumption, making it one of the cleanest energy systems in the world (Fig. 77).

Source IEA (2016)
Norway is one of the largest producers of hydrocarbons, yet consumes green energy and is a leader in dealing with climate change.
Norway’s commitment towards domestic decarbonisation has achieved remarkable reductions in transport emissions thanks to its adoption of electric vehicles. Since 2010, average CO2 emissions per kilometre from passenger cars have fallen by 9% in Norway, while the USA has seen a small increase in its emissions. The fall in transport emissions has been driven by an unrivalled uptake of fully battery-powered electric vehicles that run on low-carbon hydroelectricity. Norway has achieved the most successful deployment in EVs globally, with a market share of around 28% of all new vehicles in 2016.
Government policies on tax exemptions and in-kind subsidies for electric vehicles have contributed to the increase in EV sales. EVs in Norway are exempted from import duties, a one-time purchase tax and 25% VAT on sale. EV users also benefit from low annual road tax, free toll-road use, free municipal parking, and access to bus lanes. These subsidies have made EVs cost-competitive with comparable internal combustion engine vehicles. However, government policies are becoming increasingly expensive and have unequally favoured rich urban citizens, for whom in-kind subsidies have had the highest value (Fig. 78).

Source Vivid Economics
The most recent example of Norway’s commitment to decarbonisation is its reduction of transport emissions, driven by an unrivalled uptake of fully battery-powered electric vehicles.
For China, Norway’s EV transition provides lessons on how to increase market penetration of electric vehicles, but warns of using coal-based electricity to power them. The key findings from Norway’s EV revolution are:
-
tax exemptions and in-kind subsidies can increase the uptake of EVs. However, subsidies are expensive. If China waits for EV costs to decline, as they are expected to, subsidies to support EVs could be lower;
-
EV subsidies have disproportionally favoured city dwellers but have reduced air pollution in cities. China could use similar measures to bring down air pollution in its urban areas. This could, however, raise equality concerns;
-
a combination of a neutral tax system, public infrastructure and R&D support has kept investors interested in Norwegian oil and gas, revenues from which have financed the EV transition. This model of financing is now being challenged by low oil prices. China may need to consider sustainable ways of financing the energy transition; and
-
Norway’s EV transition has failed to translate into manufacturing jobs due to a highly underdeveloped automotive industry. China is better situated to capture the supply side benefits of a changing vehicle stock.
(2) Denmark
Denmark is a world leader in developing and integrating offshore wind into its electricity system. Wind power’s share of domestic electricity consumption was more than 40% in 2015, as shown in Fig. 79. Denmark’s wind power capacity has increased five times since 1997, reaching 5,227 MW in 2016.

Source Vivid Economics
Denmark is a world leader in integrating offshore wind into its electricity system.
Interconnectors with neighbouring countries have enabled high uptake of offshore wind, while maintaining energy supply security. Denmark is interconnected with Norway, Sweden and Germany, a result of the 2013 System Operation Agreement in the Nordic countries. By integrating its electricity market with those of its neighbours, Denmark can draw on a portfolio of otherwise inaccessible energy resources. Norway and Sweden have a hydro- and nuclear-based electricity system respectively, while Germany has a large electricity market that is based on a range of generation technologies. Denmark has benefitted from interconnecting with these markets because they offer supply security when the wind does not blow and potential offtake markets when excessive wind energy is generated. Interconnection has helped solve the intermittency problem and limited the otherwise large system integration costs associated with variable wind power.
Interconnection has also reduced the need for investment in energy storage facilities. Energy storage, such as batteries and hydro-pumped storage are often considered vital to integrating non-dispatchable renewables. However, by interconnecting with neighbouring countries and, more importantly, with a range of generation technologies, Denmark has avoided the significant costs associated with building storage facilities (Fig. 80).

Source Vivid Economics
Interconnectors with neighbouring countries provide energy security supply while reducing the need for investment in energy storage facilities.
For China, Denmark’s wind transition provides lessons on how to increase wind integration into the electricity system while fostering employment opportunities for energy workers. The key findings from Denmark’s supply revolution are:
-
Denmark’s energy transition was financed by taxing residential consumers and small and medium-sized companies, while exempting heavy industries. This taxation system is inefficient from an environmental perspective as it does not align carbon costs, although it is politically expedient. China may wish to consider more direct carbon pricing to minimise the cost of its energy transition;
-
Danish wind integration and deployment was achieved through subsidies, supported by initiatives such as interconnection and policies to increase the flexibility of conventional power plants. Similarly, China may wish to support its renewable subsidy regime by integrating its different energy generation technologies through intra-country interconnections;
-
Ørsted (formerly DONG Energy), originally an NOC, has played an important role in the Danish wind transition and China’s NOCs may wish to consider whether to follow its example; and
-
Denmark’s early entry into wind power has created a domestic industry that is globally competitive and sustains high-value jobs in rural areas. Similar employment opportunities exist in China. Energy workers could be reskilled through targeted training programmes to avoid job losses associated with the transition away from fossil fuel extraction.
3. Consumers
(1) Summary
Consumers will participate in the energy transition if it is subsidised, as was the case in Norway. They will even pay for the transition if they are convinced of the environmental benefits, as happened in Denmark. However, each alternative suffers from design problems.
Both the Danish energy taxation system that finances the wind transition and the Norwegian EV subsidies failed to align carbon cost, which is likely to have increased the total cost of the Scandinavian transitions. Norwegian EV subsidies have been an expensive way to reduce carbon; cheaper reductions could likely have been made in other sectors of the economy or by investing in R&D to bring down EV costs. Likewise, Danish taxes were unequally distributed across energy carriers and sectors. As a result, industry has had insufficient incentives to reduce energy consumption and emissions. This is unfortunate because similar decarbonisation levels could have been achieved at lower cost if policies had been technology-neutral and all sectors and carriers had been treated equally.
Both the Danish and Norwegian energy transitions have had unforeseen distributional effects. Norwegian EV subsidies have favoured city dwellers who gained greater benefit from in-kind subsidies, such as free parking and the use of bus lanes during periods of traffic congestion, than rural citizens. This is good from an environmental efficiency perspective as air pollution is more problematic in cities. However, the system favours richer citizens as they tend to live in cities and the policy might therefore widen inequality. Likewise, the burdens of Danish energy taxation have been unequal, with residential consumers and small and medium-sized enterprises paying for the transition. This has protected heavy industries but has put significant pressure on household energy bills, which hit poorer households disproportionally hard.
(2) Norway
Generous tax exemptions and in-kind subsidies for electric vehicles have triggered a surge of demand for EV vehicles in Norway. Since the early 1990s, various initiatives in the form of purchase tax exemptions, use-tax exemptions and in-kind subsidies have been gradually introduced. Electric cars in Norway are exempt from import duties, one-time purchase tax as well as 25% VAT on sale. Additionally, EV users benefit from low annual road tax, free toll, free municipal parking and access to bus lanes. This series of policies has led the way for the uptake of electric vehicles (Fig. 81).

Note Norwegian government entity Enova provides private actors and municipalities with public funding for fast-charging stations every 50 km (on average) on main roads. Source Vivid Economics
Technological advances and government initiatives have made electric vehicles ever more attractive since the 1990s.
Technological advances along with government initiatives on EV charging infrastructure were enabling conditions for the success of EVs in Norway. The Tesla Roadster and Tesla Model S were launched in the years 2008–12, marking the emergence of consumer-friendly electric vehicles. To reduce the barriers for electric mobility, the Norwegian government simultaneously established Transnova (now part of Enova) to develop an extensive charging infrastructure. Transnova was a public funding body which gave financial support to private actors and municipalities to build charging stations. Subsequently, about 1,800 standard charging stations were established all over the country through an earmarked allocation of around $6 million in 2009, and 70 fast-charging stations were built in 2011. This cooperation between private actors and the government established a solid support infrastructure for EVs in Norway (Fig. 82).

Note Calculations are based on 11.5 years of service life, 12,000 km driven per year and five days a week access to toll roads. In-kind subsidies such as free parking and access to bus lanes are not included in the cost calculations. Source Vivid Economics
Norway’s policies made EVs price-competitive with conventional internal combustion engine vehicles, which are heavily taxed in Norway.
Generous government tax exemptions mean that the total ownership cost of electric vehicles is considerably lower than the total cost of comparable internal combustion engine vehicles. Cars are traditionally taxed heavily in Norway and tax exemptions therefore work as a significant subsidy to EV consumers. For example, when the total ownership cost of a Tesla S is compared with a BMW 5 Series, which has a 42% cheaper base price, the BMW turns out to be 16% more expensive when taxes are included. In addition, fuel costs over the lifetime of a BMW 5 are more than double those of a Tesla S. The same pattern is seen with smaller EVs where ownership cost differentials are even higher. For example, an otherwise cheaper Volkswagen Golf becomes 46% more expensive than a Nissan LEAF when taxes are included (Fig. 83).

Source Vivid Economics
Falling battery costs reduce the need for subsidies, which increases demand as batteries make up one-third of EV costs.
The cost of subsidising EVs in Norway has been high, but is expected to fall with technological developments in EV batteries. Battery costs currently make up a third of the cost of an EV. However, new developments in battery technology are expected to make them dramatically cheaper. Falling costs will not only reflect improvements in battery chemistry and in manufacturing processes, but also in economies of scale as the industry grows. These developments have the potential to make non-subsidised electric vehicles cost-competitive with their fuel counterparts, reducing the need for and cost of subsidies. The need for Norwegian EV subsidies might therefore be smaller in the future. More importantly, Norway could potentially have achieved the transition at a lower cost if it had waited for battery costs to come down or, if instead of subsidising vehicle ownership, it had invested the money in R&D to reduce EV production costs (Fig. 84).

Uptake of EVs has reduced carbon emissions because Norway has a low-carbon, hydropower-based electricity system
Uptake of EVs in Norway has reduced carbon emissions because of a low-carbon, hydropower-based electricity system, but this will not necessarily be the case in China. The source of the electricity used to power electric vehicles is an important concern when evaluating net emissions from transport. An electric vehicle in Norway, say a Tesla S, emits almost zero emissions as the electricity it uses comes from Norwegian low-carbon, hydropower-based generation. However, net emissions from the same Tesla S in China could potentially be 16% higher than a comparable combustion vehicle, due to the largely coal-based electricity system in China. Transforming the vehicle stock alone will therefore not help, but rather add to, the carbon emissions of the Chinese transport sector. To reduce carbon emissions, China must also decarbonise its electricity generation. That said, electrifying transport in China might still have local environmental benefits, such as reduced particle pollution in cities (Fig. 85).

Source IEA (2017)
Norwegian policies have unequally favoured cities, where EVs are more practical and in-kind subsidies are more valuable.
Despite their success in motivating the uptake of EVs, Norwegian policies have unequally favoured urban citizens, spurring higher than average uptake in cities. Policies such as free municipal parking, toll-road charge exemptions and access to bus lanes are more practical and valuable in urban areas due to higher congestion. As a result, cities like Oslo and Bergen have seen a higher uptake of EVs than the national average. These cities are also richer than the national average, and Norway’s EV policy has therefore been regressive from a social perspective. That said, the health benefits of EVs are also larger in cities where air pollution problems are more prevalent. As China suffers from serious air pollution and congestion on its urban roads, policymakers could be inspired by the Norwegian policies to reduce existing problems. For example, in-kind subsidies such as access to bus lanes or free parking could be effective in increasing demand for EVs in major Chinese cities such as Shanghai and Beijing.
(3) Denmark
Denmark’s move into offshore wind was initiated by public concerns about energy security, specifically the desire to reduce dependence on imported hydrocarbons following the 1973 oil crisis. As a response, the Danish government began to implement high energy taxes in order to reduce oil dependence and finance public research into alternative energy sources. In contrast to neighbouring Sweden, Denmark quickly abandoned nuclear power as a part of its future energy system. This was largely because a strong anti-nuclear movement fostered public concern about the safety of nuclear power. Due to public sentiment, the Danish government decided to exclude nuclear and include wind in its future energy planning (Fig. 86).

Note Public service obligation (PSO) tariff is a levy on all electricity consumption, revenues from which finance the subsidies paid to wind, combined heat and power plants and R&D in the renewable energy sector. Source Vivid Economics
Denmark’s wind transition has been financed by taxing energy, but is supported by security concerns and a pro-climate movement.
Denmark’s wind transition has been financed by taxing energy consumers. In addition to existing high energy taxes, the public service obligation (PSO) tariff was introduced in 2005, which is a levy on all electricity consumption. It is collected by an independent enterprise owned by the Danish Ministry of Climate, Energy and Building called Energinet. The revenues from PSO have been used to finance the energy transition, including development of renewable energy, support for decentralised combined heat and power plants, energy efficiency, R&D, and other expenses related to energy security (Fig. 87).

Source Vivid Economics
The tax burden has been uneven, with residential consumers and small and medium-sized businesses paying a higher price than industrial consumers.
However, the burden sharing has been uneven, with residential consumers and small and medium-sized enterprises (SMEs) paying a much higher tax than industrial consumers. Residential and SMEs in Sweden pay the highest price for electricity in the EU. The cost of electricity represents only around 30% of the overall price and energy taxes are almost three times the European average. In contrast, industrial consumers are not subject to the same high energy taxes. This is primarily because the government has sought to ensure global competitiveness for energy-intensive industries (Fig. 88).

Source Vivid Economics
Energy taxes do not align with carbon costs across sectors and energy carriers.
The result is an inefficient tax system which fails to align carbon costs across sectors and energy carriers. Electricity is taxed by far the most out of all energy carriers, while natural gas and coal are taxed less heavily. The result is that energy taxes do not align with the carbon content of the carrier and the tax system fails to satisfy the polluter pays principle. Furthermore, as the least taxed fuels are mainly used for high heat processes, industries are insufficiently incentivised to increase their energy efficiency. The exclusion of key emission contributors from the energy transition has likely meant that Denmark’s energy transition has been more expensive than necessary (Fig. 89).

Source Vivid Economics
Public willingness to participate in the transition remains high, despite expensive and inefficient energy taxes.
Despite expensive and inefficient energy taxes, public willingness to participate in the transition has remained high. A 2016 survey conducted by the green think tank CONCITO found that the Danes consider climate change a more serious issue than in many comparable countries. More importantly, a significant majority of Danes say they are willing to pay for the transition to a cleaner energy system. This sentiment is gaining momentum, as seen by the rise in willingness to pay between 2015 and 2016 in Fig. 85. Finally, it should be noted that younger people were more positive about contributing to the country’s energy transition than older citizens.
4. Companies
(1) Summary
The Nordic cases illustrate that companies can both finance and benefit from the energy transition. National oil companies (NOCs) have been a key part of the transition in both Norway and Denmark. In Norway, Equinor and several international oil companies (IOCs) have helped finance the transition through their petroleum taxes. In Denmark, DONG Energy has transformed from being a conventional NOC into a largely green energy service company that develops offshore wind resources under the new name of Ørsted. Both cases illustrate how companies, especially NOCs, can be key to the energy transition. However, the Danish and Norwegian cases also highlight that a series of framework conditions must be in place if the transition is to be successful.
Both Norway and Denmark illustrate the importance of credible policies that include an element of risk sharing. The Nordic countries are characterised by strong institutions and widespread public-private partnerships, which have enabled the energy transitions of both Norway and Denmark. This is illustrated by the Norwegian petroleum tax system which, by incorporating an element of public-private risk sharing, has helped attract investment in oil and gas exploration and development. For example, the government of Norway shares exploration risk with oil and gas companies through tax exemptions and loss deductions. Likewise, the Danish government’s subsidies for offshore wind and support for R&D have been long term and credible. This has allowed developers to reduce deployment costs and finance their investments through pension funds and other private investors.
Government provision of public goods, such as system integration and pipeline infrastructure, has been key to both the Norwegian and Danish energy transitions. In Norway, the petroleum tax base rests on a publicly managed and regulated infrastructure system for oil and gas transport. Without this infrastructure, companies would be less inclined to invest in Norwegian oil and gas exploration and there would be less of a tax base to finance the EV transition. Likewise, the Danish wind transition rests on public action to improve infrastructure and reduce system integration costs. High levels of offshore wind integration have only been possible due to a combination of interconnections with neighbouring electricity markets and incentives to make conventional power plants more flexible. Both public initiatives have reduced system integration costs and made the Danish energy system capable of integrating significant quantities of renewables (Fig. 90).

Source Vivid Economics
Car tax revenues could fall by up to 50% by 2025 if all new vehicles are zero emission and current subsidies are continued.
(2) Norway
Government EV subsidies have resulted in falling tax revenues from vehicles in Norway. Vehicle taxes include a one-time purchase tax, registration fee, annual road tax, and fuel and CO2 taxes, which represent on average 12% of all taxes in Norway. Since the inception of EV subsidies, these revenues have been decreasing as the sale of conventional vehicles declines. This trend will continue and the success of the EV policy is therefore threatening to eliminate vehicle tax revenues, which is an important source of government income in Norway. For example, if all new vehicles are zero emission by 2025 and current subsidies are continued, vehicle tax revenues could be halved. EV subsidies are thus becoming increasingly expensive, which puts pressure on government revenues (Fig. 91).

Oil and gas revenues have enabled high levels of government spending and reduced dependence on taxes
Electrification of transport has so far been financed by revenues from Norway’s oil and gas production, reducing the need to raise taxes and reform EV policies. Around 30% of government revenues come from oil and gas, which contribute to a significant government surplus. The Norwegian sovereign wealth fund, also known as the oil fund, was established in 1990 and invests the Norwegian state’s petroleum revenues. In September 2017, it was worth $192,307 per Norwegian citizen. Norway is thus uniquely rich in natural resources and this has helped finance the decarbonisation of its transport sector without taxing consumers.
The government has developed the petroleum tax base by establishing a sophisticated tax system which reduces entry barriers and shares risks between government and the private sector to encourage oil and gas exploration. The petroleum taxation system is intended to be neutral, under which only a company’s net profits are taxable and losses may be carried forward with interest. Furthermore, a reimbursement system for exploration costs is offered: if a company incurs losses, it has the option to request an immediate refund of the tax value of exploration costs or carry the losses forward to future years. The taxation system is also flexible as it allows for consolidation between fields. This means the exploration costs can be written off against income from operations elsewhere on the Norwegian continental shelf.
Government support for oil and gas transport systems provides cost-effective infrastructure for oil and gas investors. The Norwegian gas transport system is highly regulated to avoid high tariffs associated with natural monopolies. Gassled, a joint venture, owns most of the gas infrastructure, while Gassco, a 100% state-owned neutral and independent operator, ensures equal access for all. Gassco’s duties include administering system capacity, coordinating and managing gas streams, and running the infrastructure in accordance with regulations under the Petroleum Act. Oil transport infrastructure is less regulated, as it makes up a smaller part of the value chain in the oil industry. The infrastructure is independently owned, where owners and users negotiate agreements on access to pipelines governed by regulations.
In addition, R&D support has been vital to the competitiveness and innovation of the Norwegian petroleum industry. The Ministry of Petroleum and Energy established Oil and Gas in the 21st Century (OG21) in 2001, which brought together oil companies, research institutions and suppliers to agree on a joint national strategy for the country’s oil and gas sector. The government encourages R&D through legislation or direct allocations to the Research Council of Norway, which funds the PETROMAKS 2 and DEMO 2000 research programmes. PETROMAKS 2 promotes long-term research and competence-building, while DEMO 2000 supports pilot and demonstration projects in the industry.
Resource rents from Equinor, in which the Norwegian state has a 67% holding, and IOCs contribute to the sovereign wealth fund. Equinor (then Statoil) was established in 1972, with the state as the sole owner, but was partially privatised in 2001. The Norwegian government now receives state’s direct financial interest (SDFI) from Equinor and from all other offshore operators. The government covers its share of costs and investments in the Norwegian continental shelf and receives a corresponding share of income as SDFI. The state also receives taxes from more than 50 international companies involved in exploration, production and infrastructure off the Norwegian coast (Fig. 92).

Note State’s Direct Financial Interest (SDFI) is the Norwegian government’s directly owned exploration and production licenses for petroleum and natural gas on the Norwegian continental shelf. It includes pipelines and land facilities. All revenue from SDFI is transferred to the sovereign wealth fund. Source Vivid Economics
Resource rents have been collected mostly by taxing Equinor and IOCs.
The combination of a sophisticated tax system, well-functioning infrastructure and R&D support makes Norway attractive for oil and gas production, which provides the tax revenues used to finance the energy transition. However, Norway is exceptionally resource-rich and this system of financing is unlikely to work in other countries (Fig. 93).

Note Renewable portfolio standard (RPS) includes CO2 quotas, tradable emission allowances and renewable energy certificates for a green electricity market. Source Vivid Economics
Government grants and subsidies have given wind energy producers the financial support they needed to flourish.
(3) Denmark
Government grants and subsidies have given wind energy producers the financial support they needed to develop and integrate wind into the electricity system. In the early years of wind development, the Danish government provided wind energy producers with capital grants, up to 30% of their installation costs. The grants were progressively phased out as wind installations became cost-effective. In the 1990s, several measures were initiated to support wind projects for the first five years of their operations. These included a fixed feed-in tariff, where the price paid for the electricity generated from wind was set at 85% of the utility’s production and distribution costs. Wind projects also received refunds from carbon and energy taxes. More recently, under the Promotion of Renewable Energy Act 2009, wind producers receive an environmental premium added to the market price, along with an additional compensation for balancing costs. Falling development costs mean that wind energy is now close to becoming cost-competitive with conventional fossil-fuel plants without subsidies. The Danish government therefore hopes to phase out wind energy subsidies soon (Fig. 94).

Note Siemens Wind Power was formally Danish company Danregn, and Senvion was formally Danish company Jacobs (both acquired in 2004). The figures in the pie charts are for 2016. Source Vivid Economics
Government subsidies have supported Danish companies to become leaders in the manufacture and deployment of offshore wind.
Government support has led Danish firms to become world leaders in the manufacture and deployment of offshore wind turbines. Although only 10% of Europe’s total wind capacity is installed in Denmark, Danish companies manufacture—either wholly or partly,—more than 90% of wind turbines deployed in Europe. This demonstrates the strength and global competitiveness of the Danish turbine manufacturing industry. In addition, Danish companies are also big owners of wind farms, with DONG Energy owning 16% of total capacity in Europe. Denmark’s early mover advantage in offshore wind is still seen in current deployment. For example, almost 20% of offshore wind installations in Europe were developed by DONG Energy in 2016. These statistics show that Danish companies continue to play a leading role in the global offshore wind industry (Fig. 95).

Note DONG Energy changed its name to Ørsted in 2017 to signal its transformation from a black to a green energy company. DONG originally stood for Danish Oil and Natural Gas. Source Vivid Economics
DONG Energy illustrates how a conventional national oil company can be transformed into a renewable energy services company.
DONG Energy is an excellent example of how a conventional national oil company can be transformed into a renewable energy services company. In 2005, DONG Energy committed itself to supplying energy that was green, smart and sustainable. To achieve its transformation from a conventional power plant operator into a green energy leader, DONG signed a pivotal agreement in 2010 to deliver 500 offshore wind turbines with a total capacity of 1,800 MW, in collaboration with wind turbine manufacturer Siemens. As a result, DONG has managed to achieve more than a 50% reduction in its emissions and to more than double its renewable generation since 2006. In addition, DONG’s average return on capital (ROC) has been higher than the average ROC for oil and gas companies over the past 10 years. The transition away from conventional hydrocarbon production was concluded in 2016 when DONG Energy sold its remaining North Sea oil and gas business. The company renamed itself Ørsted in October 2017 (Fig. 96).

Source Vivid Economics
Government support, together with favourable geographic and investment conditions, enabled DONG’s transformation.
Denmark’s geographic location has been key to DONG’s success in offshore wind. Consisting of the peninsula of Jutland and 443 relatively small islands, Denmark has a relatively high population density, which prevents the large-scale deployment of onshore wind. However, the country has large areas of sea territory with comparatively shallow waters and significant offshore wind resources with high wind speeds of 8.5–9.0 metres per second at 50 metres height. Denmark therefore offered the ideal testing ground for deploying offshore wind, and DONG Energy utilised this.
Government support together with favourable investment conditions provided DONG Energy with the financial resources needed for its transformation. In addition to government subsidies, the significant volume of government tenders and large test facilities reduced offshore wind deployment costs. DONG also collaborated closely with publicly financed research institutions to ensure certification, testing and standards, which later contributed to its international competitiveness. Finally, financially stable returns and credible policies have made offshore wind energy as attractive as some financial bonds. This has allowed DONG to convince institutional investors, such as pension funds, to help finance their wind investments at relatively low cost (Fig. 97).

Note BMCR = boiler maximum continuous rating. Source Vivid Economics
Wind power growth is enabled by utilities enhancing the operational flexibility of conventional power plants.
Enhanced operational flexibility of conventional power plants has helped reduce the cost of integrating non-dispatchable wind into the electricity system. The challenge to variable renewable electricity production is its unpredictable and inconsistent nature. To address the issue of load fluctuations, Denmark has focused on enhancing the operational flexibility of its conventional power plants for the past 15 years or more. As a result, Danish coal-fired power plants have been optimised to have shorter start-up rates, lower minimum loads and steeper ramp-up rates than similar installations in other countries.
To further address the intermittency problem, combined heat and power plants (CHP) are incentivised to produce only heat when the wind is blowing and electricity prices are low. In an attempt to increase wind feed-in during hours of greater wind power generation, regulation around CHP plants was changed in 2005 to offer discounts on boilers in CHP facilities. This has incentivised CHP plants to produce only heat at times of high wind power generation, which in turn reduces system integration costs (Fig. 98).

Note Large Danish CHP plants can let steam bypass the turbines to produce only heat. Source Vivid Economics
CHP plants are incentivised to produce only heat when electricity prices are low, providing greater flexibility for wind integration.
5. Energy workers
(1) Summary
The Danish and Norwegian energy transitions had very different employment outcomes. In Norway, there were almost no green manufacturing jobs created as the country did not have a domestic automotive industry. In contrast, the Danish wind revolution resulted in the development of a domestic industry which is today internationally competitive and supports a significant number of green manufacturing jobs.
The energy transition has benefitted poorer rural areas of Denmark where wind energy is developed. A similar pattern is seen in other countries, such as the UK and the USA, where wind resources are often far from conventional centres of economic activity.
The spatially dependent characteristics of many renewables, such as solar and wind, can thus be seen as an advantage and can be integrated into a wider regional development strategy.
The case of Denmark illustrates how workers can be reskilled and transferred from oil and gas production to the renewables industry through targeted educational programmes. One example is the Port of Esbjerg, which used to be the primary base for servicing Danish oil and gas production in the North Sea. Today, it is a base for offshore wind operations and maintenance. This demonstrates how workers can be transferred from developing hydrocarbons to renewable energy resources.
(2) Norway
Rising EV demand has failed to translate into Norwegian manufacturing jobs. Almost all electric vehicles in Norway are imported from the USA, China and other EV manufacturing countries due to a highly underdeveloped domestic automotive industry. Almost 43% of EV production worldwide was produced by Chinese manufacturers in 2016. China has the potential to be a leader in the supply of electric vehicles. In contrast to Norway, China can create significant green jobs and opportunities for its energy workers by transforming the existing capital stock in the transport sector (Figs. 99 and 100).

Source Vivid Economics
eV demand has not translated into Norwegian manufacturing jobs, but China already has an automotive industry to take advantage of.

Note 2DS = IEA’s 2°C Scenario. Source Vivid Economics
Oil and gas employment is falling and is expected to continue to do so.
The lack of green manufacturing jobs in Norway is problematic because the recent fall in oil prices has resulted in declining oil and gas employment in Norway. Historically, employment in the oil and gas sector was increasing. However, global markets and oil price trends determine employment in the Norwegian oil and gas industry. The recent fall in oil prices has led to job losses in both service and operations in the Norwegian oil and gas sector. This trend is likely to continue in the future as global climate policies and initiatives, such as the Paris Agreement, reduce demand for oil and gas. The lack of green manufacturing jobs might therefore prove to be a long-term challenge for the Norwegian economy.
(3) Denmark
Denmark’s early adoption of offshore wind has made its domestic industry globally competitive and created a green manufacturing sector. Denmark’s wind-related products and service exports account for around 7% of its total exports. This is by far the largest share of wind exports to total exports among the 28 European Union countries. The success is attributed to Denmark’s early adoption of wind technology, which gives it a competitive advantage globally.
Development of wind power has created sustainable and high-value jobs in Denmark. Employment in the Danish wind industry has been rising significantly since the 1990s. These jobs are not only green but also high value in terms of productivity. In 2016, the gross value added (GVA) per employee in the wind industry was higher than the national average by 4 percentage points. Notably, the national average for GVA per employee is already high in Denmark (Figs. 101, 102, and 103).

Source Vivid Economics
Denmark’s early adoption of offshore wind has made its domestic industry globally competitive, creating more jobs.

Note GVA = gross value added. Source Vivid Economics
The development of wind energy has created sustainable and high-value jobs in Denmark.

Source Vivid Economics
Wind jobs are concentrated in less-affluent rural areas.
Most wind jobs are concentrated in rural areas and have been supported by tailored education programmes. 22% of the Danish population lives in the capital, Copenhagen. However, most wind jobs are concentrated outside this economic hub. The development of offshore wind has provided new jobs and new sources of income for otherwise less affluent rural areas. These new job opportunities have been complemented with programmes for wind energy education to provide the training required for such jobs. The Danish Wind Power Academy, located in southern Denmark, provides customised courses for owners and operators of wind turbines, while the Technical University of Denmark near Copenhagen offers master’s programmes on wind technology engineering (Fig. 104).

The Port of Esbjerg has been dynamic in exploring synergies between conventional and renewable energy systems
The Port of Esbjerg has been the cornerstone for the development of Denmark’s offshore industry. Esbjerg has been the primary base for oil and gas activity in the Danish North Sea since extraction began in the 1970s. Its services for oil and gas include operations and maintenance of existing platforms, establishing new fields, security training and decommissioning. As energy production has shifted away from oil and gas, the port has increasingly transformed itself to service the offshore wind industry. Its services for offshore wind include pre-assembly, installation and maintenance of wind turbines. The port is an excellent example of how to exploit synergies between conventional and renewable energy services by reskilling energy workers.
Additional figures
See Figs. 105, 106, 107 and 108.

Source Vivid Economics
Norway’s oil and gas production is projected to be stable until 2020; longer-term forecasts are conditional on climate change.

Source Vivid Economics
DONG Energy’s average return on capital (ROC) has been higher than the average ROC in oil and gas over the past 10 years.

Source Vivid Economics
Improving the operational flexibility of conventional power plants has been in focus for 20 years in Denmark.

Source Vivid Economics
Denmark’s oil production is projected to continue to decline.
Notes
- 1.
Hua Ben, Urbanization—the Main Battlefield for Energy Revolution, in China and Foreign Energy, Issue 4, 2013.
- 2.
Zhou Dadi, Improvement in Efficiency and Benefits—the Core of Energy Revolution.
- 3.
Han Xingwang, A Discussion on the Elements of Energy Revolution, in Citizen and Law, Issue 12, 2014.
- 4.
Ren Dongming, An Analysis of Energy Revolution, in China Energy News.
- 5.
Ying Guangwei, Guo Jiaofeng and Wu Xun, China’s Energy Supply Revolution Urgently Requires Acceleration To Develop Gas as a Clear Energy, in China Economic Times, August 17, 2015.
- 6.
Gao Shiji and Guo Jiaofeng et al., Energy Internet Boosts Energy Transformation and Institutional Innovation in China, China Development Press, 2017, pp.11–13.
- 7.
The Energy Transitions Commission, Better Energy, Great Prosperity: Achievable Pathways to a Low-carbon Energy System, 2017.
- 8.
The State Information Center of China. 2016. Internal Research Report.
- 9.
Conventional gas here refers to gas field gas, excluding solution gas.
- 10.
Development Research Center of the State Council and Shell International Limited. 2013.
- 11.
- 12.
- 13.
If the share of CHP in China’s total power output from burning agricultural and forestry biomass were to be 60% in 2020 and 80% in 2030, the installed capacity of biomass-fired CHP systems would reach 3 GW and 6.4 GW in 2020 and 2030 respectively. If these CHP systems operate 6,000 h annually, they would provide enough heat for 150 days.
- 14.
In this scenario, the economy and population grow rapidly. Economic development and income growth are the priorities. Lifestyle trends are consumption-oriented. As oil supply security and environmental problems become increasingly severe and oil use becomes more efficient, the saturation point of commercial vehicle ownership per thousand people is 400 units.
- 15.
In this scenario, the population grows continuously. The economy successfully transitions to low-carbon energy and oil use improves. As public transport and rail transport are on the rise, the saturation point of vehicle ownership per thousand people is 350 units.
- 16.
Zhou Xiaoxin, Development of Next Generation Energy System, in Electric Age. Issue 1, 2017.
- 17.
Zhou Xiaoxin, et al. Development Mode and Critical Technologies for China’s Future Grid, Proceedings of the CSEE, Issue 25, 2014.
- 18.
Ma Zhao, et al. Form and Trends of Future Power Distribution Systems, Proceedings of the CSEE, Issue 6, 2015.
- 19.
Sun Wei, Li Jianlin and Wang Mingwang, et al. Business Operation Models of Energy Storage Systems and Analysis of Typical Cases, China Electric Power Press, Beijing, 2017.
Author information
Authors and Affiliations
Editor information
Editors and Affiliations
Rights and permissions
Open Access This chapter is licensed under the terms of the Creative Commons Attribution 4.0 International License (http://creativecommons.org/licenses/by/4.0/), which permits use, sharing, adaptation, distribution and reproduction in any medium or format, as long as you give appropriate credit to the original author(s) and the source, provide a link to the Creative Commons license and indicate if changes were made.
The images or other third party material in this chapter are included in the chapter's Creative Commons license, unless indicated otherwise in a credit line to the material. If material is not included in the chapter's Creative Commons license and your intended use is not permitted by statutory regulation or exceeds the permitted use, you will need to obtain permission directly from the copyright holder.
Copyright information
© 2020 The Author(s)
About this chapter

Cite this chapter
Xiaoming, W., Shangyou, N., Yunshi, W. (2020). Special Report 1: A Study of China’s Energy Supply Revolution. In: China's Energy Revolution in the Context of the Global Energy Transition. Advances in Oil and Gas Exploration & Production. Springer, Cham. https://doi.org/10.1007/978-3-030-40154-2_2
Download citation
DOI: https://doi.org/10.1007/978-3-030-40154-2_2
Published:
Publisher Name: Springer, Cham
Print ISBN: 978-3-030-40153-5
Online ISBN: 978-3-030-40154-2
eBook Packages: Earth and Environmental ScienceEarth and Environmental Science (R0)