
Abstract
This paper addresses the design, development and evaluation of an interactive Tangible Map as a way to collect, display, and provide various information about a public space (in this case, a university campus) for easy retrieval and access. Through its ability to (a) display multiple sets of information upon tactile inputs, and (b) encourage interactions through 3D features and visual stimuli, the Tangible Map acts as a bridge between abstract campus data (e.g. classes hours and locations, faculty offices, shuttle hours) and the physical spaces the data refers to. The Map’s effectiveness in easing access to information and its potential for encouraging data exploration, compared to existing mediums, is evaluated through a preliminary user study. Results suggest that the map’s 3D tangible features and tactile interactions can facilitate information retrieval and can support the exploration of abstract data.
You have full access to this open access chapter, Download conference paper PDF
Keywords
1 Introduction
In today’s data-driven world, the abundance of readily available information often goes well beyond users’ awareness or understanding. Additionally, the number of viable user interface mediums for an information-based system has grown considerably. Information can be conveyed via a website, app, smart device, installation, or a number of other options. In order to ensure that the intended audience is easily able to access relevant information, the medium in which this information is presented plays a crucial role. The selected medium contributes greatly to the audience’s satisfaction with the data they have retrieved, the audience’s engagement with the platform used to retrieve the data, the amount of data exploration done, and the efficiency with which the audience obtains the sought out data.
A particular type of data that often needs to be retrieved by users is the one related to the space they live in or they interact with. Users can access different types of interfaces or mediums to retrieve information on their environments, such as private or public buildings, neighborhoods, or cities. Such spatial data can consist in specific contents (e.g. events on campus, people working in a building, etc.), navigational information (i.e. directions to reach a specific point in space), or transport information, which merge navigational information with the means one can use to reach a specific point, and the time it will take (e.g. a shuttle route and schedule). Representing such data requires a process of abstraction and communication through means that can be textual, such as written or verbal directions, or visual, such as 2D maps.
Concerning space-related data interaction and retrieval, there has been an upsurge in natural language based assistants such as Siri, Google Assistant and Cortana. These systems are able to provide information for multiple tasks and domains including providing weather forecast [1] transportation information, and local and historic information for tourists [2, 3]. The conversational agents at the face of these systems are known as chatbots, and provide an efficient way for users to access a range of information in a friendly, natural way.
Additionally, technologies such as 3D printing and high-resolution displays have made the construction of tangible, 3D interfaces more accessible. However, even with technology’s many advancements in the space of automated directions and 3D interfaces over the past few decades, the standard representation remains two-dimensional. This 2D representation uses abstract map symbols, which can make the map a challenge to parse due to the disconnect between flat displays and spatial information.
This paper addresses this issue through the development, implementation, and evaluation of an interactive user interface. This interface comprised an interactive, tactile, digital map display (Tangible Map) constructed with 3D printed physical reproductions of an urban context (the MIT college campus), situated on top of interactive touchscreens, and connected to a native iPad app. The Tangible Map was built with the goal of creating a bridge between abstract campus data and the physical spaces the data represents. The intention behind the map was to provide accessible way of navigating and retrieving information, by allowing a large set of information to be displayed at once, and by offering clarity of the spatial arrangements of the given information through its direct relationship to 3D extrusion of the 2D interactive map.
Figure 1 shows the Tangible Map in its final installation site, the MIT Atlas Center.

Left: The Tangible Map in its final installation site, the MIT Atlas Center. Right: A building is illuminated and information is displayed on the dynamic touch screen as a user selects a building to explore.
In our preliminary user studies, detailed in Sect. 5, we focus on particular types of information - namely, classes, directions, events, and people collections within the MIT database. We evaluate our Tangible Map against a baseline of existing methods our participants currently use to obtain this information.
In summary, we make the following contributions in this paper:
-
We describe the design and implementation of the Tangible Map, a unique tactile, digital representation of an urban setting with interactive touch-points.
-
We suggest that information retrieval using the Tangible Map can be easier than using traditional media across a range of information categories, based on the results of a preliminary user study.
2 Background and Related Work
2.1 Tangible Interfaces
Technological advances in the recent past have made affordable hardware technologies that used to be available only to a select few. High-resolution touch screens and 3D printed objects are a few such technologies whose newly found attainability have fostered the development of several new interfaces and applications, including interfaces with tangible interactions. Tangible interaction elements have been shown to attract attention towards a display, provoke curiosity, and encourage engagement of nearby bystanders [4]. Tangible interaction elements have been implemented in the form of tabletops [5], objects atop digital displays [6], and 3D mapped tangible objects [7].
One example of a tangible interaction is Architales, an interactive story table, developed as an experiment in physical/digital co-design. Consisting of an interactive table for shared story engagement, the co-design principles behind this experiment proved successful for this interactive and tangible tabletop [5]. Another example is the T4 (transparent and translucent tangibles on tabletops) design, which enables direct touch of objects underneath, allowing for a stronger connection between the tangible and the screen, as well as more efficient usage of screen space [6]. Furthermore, to enhance user interaction of data, 3D printed maps have been created to act as tangible layers by adapting 2D map data into a printable overlay [7]. These 3D mapped tangible objects have been created by adapting 2-dimensional information into z-axis height or textures.
Our Tangible Map builds off these existing design concepts in order to realize an interactive tangible display that allows for more exploratory user interactions and facilitate navigation of data gathered from multiple sources.
3 Concept and Design
3.1 Audience
On a day-to-day basis, a variety of individuals access the MIT Atlas Center in order to resolve a variety of different issues. In particular, visitors to the Atlas Center arrive in order to resolve logistical issues concerning their access to various MIT facilities or services. We sourced our participants from this audience, which comprises MIT faculty and students, as well as visitors to the campus otherwise unaffiliated with the university.
3.2 Design Goals
The Tangible Map was designed to encourage exploration and enhance ease of information retrieval, thanks to the variety of information that can be displayed concurrently and its spatial arrangement through the 3-dimensional map. Currently, information of events, classes, and other relevant facts about campus is largely distributed across various websites, physical maps and static public displays. Accessing this information requires users to individually search on its dedicated platforms, and is often a one-way process. Furthermore, location-specific information such as building number or address is difficult to remember and navigate with in real-life context of three-dimensional urban space.
This distribution of resources, and frequent difficulty of access, reflects the difficulty of use that sometimes accompanies smaller scale, 2-dimensional mapping methods. The primary aim of the Tangible Map is to mitigate these difficulties.
Due to the novelty of this medium, we have identified that most of the users of the Tangible Map will have never encountered a similar installation in the past. With this novelty factor, users are interested in being able to explore the Tangible Map and having an organic experience in understanding their surroundings. We wanted the Tangible Map to capitalize on users’ inherent interest in engaging with novel, interactive 3D media in order to more easily deliver specific and relevant information. We also hoped this method of interaction would encourage further exploration of information about MIT campus that are otherwise unknown.
4 Implementation
The Tangible Map consists of a touch-sensitive display surface, 3D printed buildings atop this surface, and a connected tablet. Users can either select a building directly and interact with the information that then displays on the touch-sensitive display surface, or search the tablet interface for specific information. The display surface consists of two parts: a section hosting the Tangible Map’s 3D printed buildings, and a section that is exposed. The second section forms the information panel for the Tangible Map. The information panel displays information about buildings that have been selected from the Tangible Map and search results that have been selected from the tablet application (Fig. 2).

The Tangible Map consists of two parts; 3D printed buildings to entice users to touch and to provide visual reference, and an interactive tablet that further displays information about the building selected and vice versa.
4.1 Tangible Map Physical Layout
The Tangible Map’s touch-sensitive display surface consists of two LCD displays overlaid with a single capacitive touch input layer. 3D printed campus buildings sit atop this touchscreen. Each building is fitted with a touchpoint containing dual 3 mm diameter aluminum rods connected to a 6 mm circular piece of aluminum foil. When touched, the rods trigger a change in capacitive charge that registers as a finger press on the capacitive touch input layer (Fig. 3).

Photo of user interacting with Tangible Map via touch. Aluminum rods embedded in the 3D printed buildings allow for digital interaction through capacitive charge.
4.2 Tangible Map Software Layout
The software for the Tangible Map’s screen is built using JavaScript for the interactive touch screen site, and Swift for the tablet application. The main website is a Node.js app with MongoDB as the datasource. An important aspect of the Tangible Map’s UI design is the use of animations to direct user attention to the appropriate locations in the installation. Directing user attention is an important but difficult task [8, 9], and we use animations to indicate to the user when information is changing and where on the Tangible Map to find relevant information. Pulses of light sweep across the display in order to provide visual feedback immediately after the user selects a component on the screen and to redirect the user’s line of vision to the portion of the screen displaying information about the selected component.
5 Preliminary User Study
In order to evaluate the accessibility of data of the designed Tangible Map vis-à-vis other visual interfaces, one preliminary user study was carried out. The study consisted of asking users to retrieve specific bits of information and compare the ease of the task in the designed system versus existing mediums (e.g. the campus website, or web search tools). The study aimed at providing us with preliminary, qualitative results about the effectiveness of the designed tangible interface as well as its potential in terms of generating more engaging user experiences fostering the exploration of the space in a novel way (Fig. 4).

Participants were asked to retrieve information about campus (location, people, events) using existing medium (web search using mobile devices) as well as the new proposed medium of the Tangible Map.
5.1 Method
Setting.
Alt et al. provides a set of guidelines for evaluating public displays [10]. They state that in HCI, controlled lab studies are often carried out, which remove many of the real-world factors present in a public display. For this reason, we conducted our user study in the Tangible Map’s final installation site. The participants carried out the tasks asked of them while dozens of other MIT affiliates walked and talked around them, as would be the case if the participant were interacting with the Tangible Map outside of the user study. Performing this study in real-world conditions results in insights applicable to an authentic public display.
Participants.
Eleven participants took part in this study. All but one of the participants were current MIT students ranging across departments and years of study, with the final participant being an MIT lab affiliate. This group is largely consistent with that of the projected user population of the medium. Users participated in the study on a voluntary basis.
Process.
For each session, a moderator introduced the participant to the Tangible Map, giving a short description of its purpose. The subject was asked to sign a consent form to participate in the study. The moderator then asked the participant to complete the following tasks:
-
find information about a building on campus;
-
use the shuttle system;
-
discover events on campus;
-
visualize locations of public artworks/bike racks on campus;
-
use the search feature (Fig. 5).
Fig. 5. 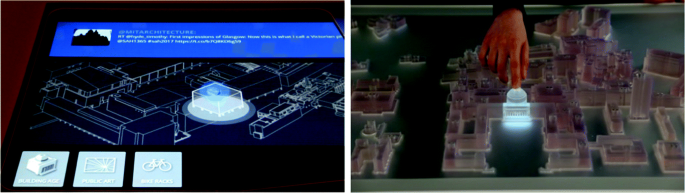
The interface provides options to look for specific buildings, public art, and location of bike racks on campus. Users can also click on each building to access relevant information.

User study sessions consisted in completing each of the above-mentioned tasks both through the participant’s currently favored form of information retrieval (e.g. the campus website) and the Tangible Map. After completing all the tasks, participants were asked to fill out a survey on their experience. The survey was divided into three sections. The first one focused on evaluating current interfaces for information retrieval. Participants used either a web search engine (e.g. Google) or the MIT campus map website (https://whereis.mit.edu) and people finder website (https://web.mit.edu/people.html) through their mobile phones to perform the tasks. This section of the survey was useful to assess the ease of information accessibility through the current digital interfaces, in order to evaluate our hypothesis about the need for tangible interface for more intuitive information retrieval. The second part of the questionnaire explored both the ease of information accessibility and the possibility of encouraging exploration of the space through the Tangible Map compared to current interfaces. Responses were collected through a 3-point Likert scale. The third part of the questionnaire consisted of three open-ended questions investigating advantages of the Tangible Map, the pleasantness of the interactive features and additional comments on the Tangible Map experience (Fig. 6).

Participants were asked to find information about a building on campus and location of faculty offices using both search features and 3D printed buildings.
5.2 Results
Table 1 shows the results of the first section of the questionnaire. By using current interfaces, finding information about a specific building on campus (i.e. name and address of the building, research groups and faculty members working in the building) and finding relevant events on campus were evaluated as easy tasks by more than half of participants. Making use of the shuttle system was the least easy task to perform by users through current interfaces.
In Sect. 2, we analyzed the user experience with the Tangible Map. The first three questions refer to qualities of the Tangible Map (i.e. how easy it is to retrieve information about a building, how easy and effective the search function is, and how easy it is to find artworks or bike racks on campus). For all these questions, we collected positive responses from the majority of users, with finding information about buildings being the easiest task (Table 2).
Questions 4 and 5 specifically ask for a comparison between the Tangible Map and current interfaces. On all accounts, there is an increase in the ease with which participants can find information on buildings and shuttles when using the Tangible Map vs existing mediums.
Questions 6 and 7 investigate the ability of the map to encourage the exploration of the space. Again, most participants found it easier to discover relevant events on campus by interacting with the Tangible Map. Compared to existing interfaces, the map provides the user with building-specific information, which can be retrieved just by touching its 3D representation.
In the last section of the questionnaire, all participants mentioned the tactility of the display as the aspect they liked the most in the Tangible Map. Feedback on the Tangible Map interactive features was positive, and few participants expected to find further responsive features or additional data on the Tangible Map where they did not yet exist.
When participants were left to explore the Tangible Map without specific tasks to complete, they were more explorative and engaged with all touch-enabled parts of the 3D map. Participants touched buildings they were not familiar with in order to learn basic information such as the building’s name, and also touched buildings they were very familiar with (i.e. their dorms, the main buildings for their departments) in order to verify information they already knew.
6 Discussion
Results of our preliminary study show that in our area of investigation, the Tangible Map both facilitates information retrieval through ease of access and invites users to explore other information that is not commonly accessed.
Concerning the ease of access to information, it is likely that both the scale and the 3-dimensionality of the Tangible Map played roles in facilitating retrieval. Participants repeatedly reported an increase in ease using the Tangible Map over other mediums, whether it was to retrieve information about a particular building on campus, to acquire real-time data about the MIT shuttle system, or to gather information regarding relevant events on campus.
The Tangible Map’s large scale and 3-dimensionality more closely captures and represents users’ understanding of real-world conditions. Such a physical map likely leads to faster comprehension of spatial distances, facilitating fast and effortless understanding of buildings location, routes, and travel times across campus, thus easing tasks such as making use of the shuttle system.
Furthermore, since all of the users were affiliated with the university, each came to the map with some form of existing knowledge about the campus’ layout; it is likely that the map built upon this existing knowledge to facilitate fast and effortless memory retrieval about reference points on campus. The fact that the Tangible Map consists of 3D-printed buildings, complete with identifying information such as facade detailing, made the buildings more recognizable to users. Where 2D screen-based interfaces are only able to represent building shapes and outlines (and perhaps rough changes in height or massing), a 3D map captures detail much more immediately relevant to typical users. Thus, when users reported an increased ease in building information retrieval, this likely arose from the immediate ability to recognize specific buildings, rather than having to remember their name or building number (as is typically required in alternative search media).
In terms of explorative potential, both the 3-dimensionality and the tactility of the interface, as well as the physicality of the Tangible Map play a significant role. The mere presence of the Tangible Map in the space acts as a trigger for the exploration of campus-related information, by generating curiosity and encouraging interactions. Designed as an interactive table, instead of a vertical display wall, the Tangible Map acts as a place to gather around. These features invite users to walk around and explore the Tangible Map itself, rather than simply use it as a representative tool for information retrieval. Where typical search media have been relegated to objective information retrieval, the Tangible Map invites users to explore and play with the interface in novel ways. Users are not required to approach with any intention of gaining explicit pieces of information; they are free to explore the map out of curiosity, because of its novelty and potential for fun. Participants responded favorably to the existing interactive tangible components of the map, and a few explored the map extensively that they began to expect responsive features where they did not exist, such as on facility buildings that did not have any specific information to display. Novelty and tactility caused users to linger, highly increasing the likelihood that they might discover new and unforeseen information about the space.
Finally, the Tangible Map provided a medium comfortably in between full-scale, real-world conditions and compressed, inaccessible data. Where users might be hesitant to explore further-field campus amenities, due to the time and effort required, and might neglect to investigate databases of information, due to the lack of an engaging interface, the Tangible Map provides an intermediate form of exploration that augments users’ ability to easily retrieve interesting information, without requiring too much effort.
The study is qualitative in nature and was aimed at gathering preliminary data about the users’ response to the use of tangible interfaces for retrieving spatial information. The main limitations of the research consist in the restricted number of subjects involved in the tests, as well as the limited amount of tasks evaluated. Further analyses will benefit from the evaluation of a larger set of information to display and retrieve.
7 Conclusion
From our specific study, we have shown that large-scale, 3-dimensional, interactive maps facilitate both information retrieval and explorative potential in an urban context. These types of maps can prove especially useful in contexts similar to the MIT campus, where competing sources and scales of information can render traditional mapping methods difficult to use. The Tangible Map allows users to more easily retrieve building-specific information (likely due to building recognition of 3D building forms), understand the shuttle system (likely due to enhance understanding of shuttle times and walking distances), and discover relevant events on campus (likely due to increased exploration of farther-field campus buildings).
Having established that the Tangible Map can serve both an information-retrieval and an exploratory purpose, there are many features that can possibly be added to extend functionality. It is especially exciting to consider how additional features can enhance user engagement, such as the addition of more visual information, alternative forms of touchpoints, or varying forms of animations. Sourcing information from additional databases can enhance the real-time usefulness of the map - from displaying open conference rooms to indicating information about conferences happening on campus, as well as integrating real-time social media data such as Twitter discussion feeds on current events. Overlay of data from various timelines and refreshed user generated contents can aid in keeping the Tangible Map up-to-date and engaging to users. Such additional data will be added to subsequent versions of the Tangible Map, and will be part of more extensive user studies.
References
Maragoudakis, M., Thanopoulos, A., Fakotakis, N.: MeteoBayes: effective plan recognition in a weather dialogue system. IEEE Intell. Syst. 22(1), 67–77 (2007). https://doi.org/10.1109/mis.2007.14
Kim, S., Banchs, R.E.: R-cube: a dialogue agent for restaurant recommendation and reservation. In: 2014 Asia-Pacific Signal and Information Processing Association Annual Summit and Conference (APSIPA). IEEE (2014). https://doi.org/10.1109/apsipa.2014.7041732
Niculescu, A.I., et al.: SARA: Singapore’s automated responsive assistant, a multimodal dialogue system for touristic information. In: Awan, I., Younas, M., Franch, X., Quer, C. (eds.) MobiWIS 2014. LNCS, vol. 8640, pp. 153–164. Springer, Cham (2014). https://doi.org/10.1007/978-3-319-10359-4_13
Claes, S., Moere, A.V.: The role of tangible interaction in exploring information on public visualization displays. In: Proceedings of the 4th International Symposium on Pervasive Displays - PerDis 2015. ACM Press (2015). https://doi.org/10.1145/2757710.2757733
Mazalek, A., Winegarden, C., Al-Haddad, Robinson, S.J., Wu, C.-S.: Architales: physical/digital co-design of an interactive story table. In: Proceedings of the 3rd International Conference on Tangible and Embedded Interaction (TEI 2009), pp. 241–248. ACM, New York (2009). https://doi.org/10.1145/1517664.1517716
Büschel, W., Kister, U., Frisch, M., Dachselt, R.: T4 - transparent and translucent tangibles on tabletops. In: Proceedings of the 2014 International Working Conference on Advanced Visual Interfaces (AVI 2014), pp. 81–88. ACM, New York (2014). https://doi.org/10.1145/2598153.2598179
Taylor, B., Dey, A., Siewiorek, D., Smailagic, A.: Customizable 3D printed tactile maps as interactive overlays. In: Proceedings of the 18th International ACM SIGACCESS Conference on Computers and Accessibility - ASSETS 2016. ACM Press (2016). https://doi.org/10.1145/2982142.2982167
Coenen, J., Wouters, N., Moere, A.V.: Synchronized wayfinding on multiple consecutively situated public displays. In: Proceedings of the 5th ACM International Symposium on Pervasive Displays (PerDis 2016), pp. 182–196. ACM, New York (2016). https://doi.org/10.1145/2914920.2929906
Hespanhol, L., Tomitsch, M., Grace, K., Collins, A., Kay, J.: Investigating intuitiveness and effectiveness of gestures for free spatial interaction with large displays. In: Proceedings of the 2012 International Symposium on Pervasive Displays (PerDis 2012), Article ID 6, 6 p. ACM, New York (2012). https://doi.org/10.1145/2307798.2307804
Alt, F., Schneegaß, S., Schmidt, A., Müller, J., Memarovic, N.: How to evaluate public displays. In: Proceedings of the 2012 International Symposium on Pervasive Displays (PerDis 2012), Article ID 17, 6 p. ACM, New York (2012)
Author information
Authors and Affiliations
Corresponding author
Editor information
Editors and Affiliations
Rights and permissions
Copyright information
© 2019 Springer Nature Switzerland AG
About this paper

Cite this paper
Leon, K., Walker, W., Lim, Y., Penman, S., Colombo, S., Casalegno, F. (2019). Tangible Map: Designing and Assessing Spatial Information Retrieval Through a Tactile Interface. In: Kurosu, M. (eds) Human-Computer Interaction. Design Practice in Contemporary Societies. HCII 2019. Lecture Notes in Computer Science(), vol 11568. Springer, Cham. https://doi.org/10.1007/978-3-030-22636-7_24
Download citation
DOI: https://doi.org/10.1007/978-3-030-22636-7_24
Published:
Publisher Name: Springer, Cham
Print ISBN: 978-3-030-22635-0
Online ISBN: 978-3-030-22636-7
eBook Packages: Computer ScienceComputer Science (R0)