
Abstract
Museum installations, especially those related to the display of virtual archaeology, often make use of natural user interaction (NUI). Those sets require methods of interaction that are intuitive and easy to all users, independent of their previous skills and experience with similar or related technologies. The use of depth cameras such as the Kinect system is a common way to allow visitors to move and interact within the digital replicas of buildings and spaces. This paper presents a study of User Experience (UX) applied to four movement schemes implemented on one such installation. For this research, a mixed method approach is used, using a sample of users segmented into three groups based on their previous skills and experience with video games. The four movement schemes studied combine a user gesture to move forward with another gesture for turning. The quantitative and qualitative data obtained for each movement scheme and user group were analyzed, and several usability metrics were combined to obtain a single UX score, which were then used to compare their performance and suitability for their use in the context of a museum.
You have full access to this open access chapter, Download conference paper PDF
Keywords
1 Introduction
Nowadays, gestural systems stand out among the most popular forms of natural interaction. One can find many examples of the use of gestures to interact with devices such as smartphones, videogames and virtual reality applications. At the present time, all 3D videogame platforms support some kind of gesture-based interaction schemes by means of spatial scanning.
Among those devices, the Microsoft Kinect system depth camera facilitates obtaining a very comprehensive description of user’s poses and gestures. The application of these devices is not limited to videogames; indeed, this device is being used profusely in multifarious fields, where virtual environments have to be explored by means of natural interaction [1]. Among those fields, virtual museums demand good walk-through paradigms for exploring the space and contemplating the environment and the objects on display, prior to enabling further interactions [2].
From the early nineties, the evolution of real time technologies entailed a great deal of interest in research on the topic of navigation in virtual environments and its application in different disciplines i.e. [3,4,5,6,7]. Bowman, Koller & Hodges wrote a remarkable work on the analysis and evaluation of travel techniques for use in immersive virtual environments, and defined a set of quality factors to measure and characterize the performance of a given travel technique [8].
In a previous work, the authors of this paper analyzed six walk-through paradigms for virtual environments using Kinect-based natural interaction [9]. Those movement schemes were implemented in a virtual environment depicting a reconstruction of a 4th century Roman villa, which was developed using the popular game engine Unreal Engine 4. The Kinect-based interaction was coded inside this system using the K4U libraries [10]. Within this virtual recreation, users can walk freely around the historical complex, enjoying the architectural spaces, mosaics, wall paintings, furniture, and other examples of material culture.
The analysis of the results of the aforementioned experiment did not consider a segmentation of the sample of users based on their previous experience with real-time environments (i.e. video games). It is important to note that one of the main goals in a NUI-based installation for museums is to find the most effective ways to interact and navigate inside a virtual environment. The movement and interaction paradigms chosen may be intuitive, easy to learn and useful for both novice and experienced users.
The work continues the previously mentioned research in movement paradigms, now focused on finding the most effective movement scheme for all users of a virtual museum, independent of their skills and experience on video games. Some studies suggest a positive correlation with previous experience with 3D video games, and navigation and interaction within the virtual world e.g. [11, 12]. Nevertheless, such consideration may result in a clear disadvantage for inclusive design of this kind of installation.
This paper describes a study on user experience (UX) for three user groups based on the user’s previous skills as video game players—no experience, casual player and frequent player—as they tried four different movement schemes that combined different gestures to advance and turn as the user navigated in the virtual world: Point forward/Twist upper body, Lean forward/Twist upper body; Step forward/Point sideways, Step forward/Twist upper body.
This study uses an approach based on mixed methods [13]. Dependent variables in this experiment were task time, time in collision state (objective and measurable) and users’ perception of ease, accuracy, need of attention, physical fatigue, and comfort and enjoyment with the experience. As qualitative data, the authors collected the “think aloud feedback” given by the participants during their performance for each movement scheme.
2 Methodology
2.1 Participants
Authors contacted and recruited participants from the university’s students, faculty and other staff. A total of 27 participants (13 male, 14 female) were involved in a usability test. Ages ranged from 17 to 25 (66.7%), 26 to 35 (18.5%), and 36 to 55 (14.8%).
The criteria used to select the participants were based on their representation of the larger population who will use the application. Namely, we created three subgroups segmented for self-reported expertise. To ensure statistically significant evidence in the sample size [14], 9 people were used in each subgroup: no experience user (3 male, 6 female), casual player (5 male, 4 female), and frequent player (5 male, 4 female).
2.2 Session Procedures
The individuals participated in the study separately in order to avoid any kind of contamination. All users performed all tasks using all movement schemes. Each session lasted approximately 45 mins for each individual.
Before the beginning of the test, the moderator explained the mechanics of the session to the participant and required the user to fill out a brief demographic questionnaire (age, gender, self-reported expertise). Then, the user took a two-minute free walk to contemplate the house and the elements exhibited inside it. At this point, the participant utilized the Point forward/Point sideways movement scheme as a training for the subsequent tasks.
Next, the subject tried different movement schemes in random order to accomplish two predefined tasks. During the course of the test, the system monitored and recorded the user moves in order to extract relevant data about time to complete the task, number of collisions and time spent in a collision condition. A post-task questionnaire was filled out immediately after completion of every task.
Users also completed a post-test questionnaire at the end of the session. Post-task and post-test questionnaires, together with the record of the comments made freely by the participants, provided a good source for subjective data.
2.3 UX Measuring
To measure the user experience in this test, we used the approach described by Tullis and Albert [15], where UX is the combination of all behaviors and attitudes people have while interacting with an interface. These include and go beyond traditional usability [16] and broader metrics dealing with users’ attitudes and perceptions. In order to follow this approach, it is necessary to combine both objective and subjective measures to enable satisfaction analysis as a “subjective sum of the interactive experience” [17].
Since this study deals with a 3D interactive installation, it is important to include certain measurable characteristics of the quality of navigation as a mean to solve certain tasks [8] such as accuracy, attention and user comfort. The degree of motivation and pleasure is also evaluated, since hedonic, emotional, and experiential perspectives have an influence on the perception of product quality [18]. Furthermore, the emotional factor influences the potential of learning new skills and acquiring new knowledge, which are keypoints of this kind of installation.
To begin with, there are many definitions of the concept of “usability” [19,20,21]. There is a common understanding that the scope of usability includes the evaluation of effectiveness, efficiency, satisfaction, or the absence of usability problems [22]. The international standard ISO 9241-11:2018 [23] describes usability as the “extent to which a system, product or service can be used by specified users to achieve specified goals with effectiveness, efficiency and satisfaction in a specified context of use”.
Measurement of quality in use is defined in ISO/IEC 25010 [24], which includes measures for the components of usability that are defined in ISO 9241-11. Within the satisfaction criteria, a series of sub-characteristics are defined, namely usefulness, trust, pleasure and comfort. Those last two concepts are included in this study.
-
1.
Effectiveness is defined as accuracy, completeness and lack of negative consequences with which users achieved specified goals [23]. In this dimension, we measure the completion rate, the number of collisions and the number of frames that the system registered where the user collided with walls and objects, which can be expressed as time in collision state.
-
2.
Efficiency is defined as resources expended in relation to the accuracy and completeness with which users achieve goals [23]. In this study, two aspects were measured: task time, and time spent in collision state, thus analyzing the influence of this data in the user’s efficiency to perform the task.
-
3.
Satisfaction relates to positive attitudes, emotions and/or comfort resulting from the use of a system, product or service [23]. Within this dimension, six criteria were evaluated. The first two are related to the satisfaction with task performance and the last four to the degree of satisfaction with the experience:
-
Ease of learning: how fast a user who has never seen the user interface before can accomplish basic tasks
-
Accuracy: proximity to the desired target [8]
-
Fatigue: subjective perception of physical effort during the completion of the tasks
-
Attention: this parameter measures the ratio of attention devoted by the user to control the navigation vs attention devoted to enjoyment of the experience itself. This evaluation is very important for a NUI system, since one of the main goals of a natural user interface is to remain as non-intrusive and invisible to the user as possible, so he or she can focus completely on the experience
-
Comfort: the extent to which the user is satisfied with physical comfort [24]
-
User pleasure: degree to which a user obtains pleasure from fulfilling their personal needs [24].
-
2.4 Gestures
In the proposed study, participants used gestural movement schemes to perform two tasks with different objectives. The user gestures implemented in the system [10] can be divided into two groups. The first group, which we may call “march gestures related to start, maintain and stop the walk”, with constant or varying speed, and the second group, which we may call “turn gestures related to changing the walking direction”. Both sets of gestures were combined to configure four different schemes involved in the study. Table 1 summarizes the combinations and displays the naming convention used in the graphs in this paper.
3 Experiment Design
The experiment set consisted of a low-lit room with a projection screen having a Kinect sensor underneath, and some marks on the floor, one of them indicating the starting point of the experience, located 3.80 m in front of the screen. In this range the depth and skeleton views from the sensing device cover the entire user’s body.
A digital reconstruction of a 4th century Roman Domus (Fig. 1) was used as test environment. It provided a good and comprehensive set of scenarios, which were used for obtaining all the measurements required for the usability tests, while at the same time serving as an entertaining and educational experience for the users involved in the experiment.

Roman villa “El Alcaparral” Casariche Museum of Roman Mosaic, Spain
The usability data was collected in several sessions. During those sessions, two moderators observed and interacted with the users as they were completing the tasks using the different movement paradigms. Participants had to complete two different tasks:
-
Navigation between two points: The first test began in front of the main door of the Domus. The user had to cross the vestibule to the main atrium, surround it and exit the atrium through a doorway located in the side opposite the entrance until they reached another exit leading to the garden. The purpose of this first stroll was to facilitate evaluating the ease of use of the system by measuring the task completion time, the number of collisions detected and the number of frames in collision state (Fig. 2).
Fig. 2. 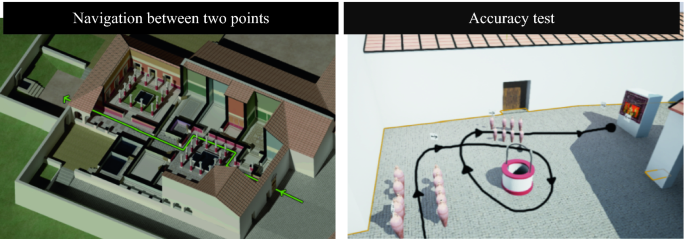
Pathways for tasks 1 and 2
-
Accuracy test: In the second test, the user performed another walkthrough, different from the first, to help measure the accuracy of every paradigm. This one required more precise maneuvering, since the user was asked to pass between two rows of objects and circle another object to finish, stopping in a given place. Again, we measured the task completion time, the number of collisions detected and the number of frames in collision state.

While the users performed the different tasks, they made spontaneous comments about their impressions related to the experience that were recorded. After each task, the participants were asked to rate the movement paradigms on a 7-point rating scale:
-
Post-task 1 question: Single Ease Question (SEQ) [25] was used to ask the user to rate the difficulty of the activity they just completed, from Very Difficult to Very Easy.
-
Post-task 2 question: a questionnaire was used to ask the user to rate the accuracy of the system for the activity they just completed, from Very Inaccurate to Very Accurate.
At the end of the session, users answered a short 7-point rating scale questionnaire about their impressions and perception of the experience as a whole. This questionnaire included four subjective measures:
-
Attention focus: asks the user to rate the level of attention they put into the experience instead of on controlling the system, from Most Attention Devoted to System to Most Attention Devoted to Experience.
-
Physical fatigue: asks the user to rate the level of fatigue, from Very Tired to Very Relaxed.
-
User comfort: asks the user to rate the level of comfort, from Very Comfortless to Very Comfortable.
-
User pleasure: asks the user to rate how exciting and enjoyable the experience was, from Very Unlikable and Boring to Very Pleasing and Exciting.
In addition, the authors asked users for general comments and recommendations for improvement.
4 Analysis and Interpretation of Data
4.1 Effectiveness
All the tasks were completed successfully. Data collected by the system during the execution of the tasks indicate that sometimes as the user advanced, he or she stuck to the walls instead of returning to the center of the path, or the user stuck against obstacles for a while. The analysis of the number of collisions and time in collision state helped to figure out how quickly the user learned to drive the system properly.
Collisions are a kind of unintended action a user makes while trying to do something on an interface even though the goal is correct. Norman used the term “slips” for these kinds of actions [26].
Figure 3 shows the percentage of users who collide very little to very much for every movement paradigm. Task #1 GP03_SP stands out as less prone to colliding (77.8% of the users collided less than 4 times). In the accuracy task, the best value goes to G04_ST (44.4%).

Number of collisions per user for each task
Number of collisions is a datum of special interest related to time in collision state. The system counted the number of frames of the simulation that every user spent colliding (even tangentially) to walls or objects. Considering a frame rate of 30 fps, we can obtain the time in collision state and the percentage of the task performed in collision state in relation to the total task time. Analyzing this data, considering every movement paradigm and type of user (Fig. 4), the data shows that for task #1, G01_PT obtained the worst results, with a higher percentage of collision time related to task time for users of all groups, while G04_ST got the best results, with less time in collision state.

Percentage of time in collision state according to each task and user group
Unlike task #1, results for time in collision state for task #2 (accuracy) vary depending on the user group. G03_SP presents the highest (worse) values for no experience users, G01_PT for casual players, and G02_LT for frequent players and all users. The movement paradigms with the lowest time in collision state were G04_ST for no experience users and G03_SP for the rest of the groups. In any case, none of the movements exceed 8.1% (±1.7%) of time in collision state, so it has a relatively small effect on task performance [27].
4.2 Efficiency
Task #1 Time
The best time to completion for task #1 was 53 s. This value establishes an ideal time for this task in order to obtain the average task time estimate for a small sample. In order to set up a benchmark, we considered efficient times to be all times smaller than the ideal time multiplied by 1.5 [14]. Hence, any time smaller than 79.5 s. should be considered efficient.
Figure 5 summarizes the average task #1 time by movement scheme and user group. The confidence interval is based on the t-distribution, which works on small sample sizes [14]. Upon analysis of the data, G02_LT is the movement scheme with smaller times for all user groups, while G01_PT is the movement scheme that needs longer times for all user groups to complete tasks.

Average task #1 time by movement scheme and user group
Regarding the benchmark, all the averages for task #1 fall inside the range of efficient time.
Task #2 Time
Regarding the average task time for task #2, G02_LT is the movement scheme with lower times for all groups. G01_PT has higher times for all user groups. The best time in this task was 34 s, giving an efficient task #2 time of < 51 s.
Figure 6 summarizes the average task #2 time by movement scheme and user group. Analysis of the data shows that most average task 2 time results fall inside the range of efficient time, with the exception of the no experience user group for G01_PT.

Average task #2 time by movement scheme and user group
Task Performance Satisfaction
1- Post-Task 1 question: ease
After task 1, Single Ease Question (SEQ) was used to measure the degree of difficulty perceived by users during task performance. Analyzing the results, at a general level, the percentage of positive answers (describing the task as easy) reach values between 77.8% and 88.9%, achieving 100% for G04_ST (Fig. 7, Table 1). These results reflect that, generally speaking, all movement schemes are considered to be easy by users of all groups. All users, regardless of their group, perceived G02_LT as the easiest movement scheme for task #1 (≥6.0), followed by G04_ST. All groups perceived G03_PT as somewhat more difficult.

Post-task 1 Single Ease Question by movement scheme and user group
Linking the results of task #1 time and SEQ, task times between 59.9 s to 63.7 s correspond to SEQ values of 5.89 to 6.1, while task times between 63.8 s to 73.4 s correspond to SEQ values from 5.44 to 5.89.
2- Post-Task 2 question: accuracy.
After task 2, users were asked to fill out a questionnaire to rate the accuracy of the system in the activity they just completed. Generally, the percentage of positive answers, defining the movement scheme as accurate, reaches values ranging from 77.8% to 88.9% (Fig. 8, Table 1). A higher percentage of negative answers (describing the system as less accurate) corresponds to G02_LT for casual player (22.2%) and all users (11.1%). All movement schemes are considered relatively accurate (≥5.1). If we consider every single movement scheme, G01_PT is the scheme considered more accurate for the no experience user and all users for task #2, while casual player chooses G04_ST and frequent player chooses G03_SP.

Post-task 2 Accuracy Question by movement scheme and user group
It is worth noting that for task #2 the results regarding time and the questionnaire of accuracy do not match as expected. In some cases, the user perception does not coincide with the efficiency in time to complete. For instance, G01_PT results give the highest completion time for the no experience user group (53.8 s), but it is perceived as the most accurate (6.2). Inversely, G02_LT gives the best time for the frequent player group (44 s), but it is perceived as less accurate (5.1).
Overall Satisfaction
Upon finishing the test, users answered a questionnaire related to their physical fatigue, attention, comfort and pleasure with the usage and performance of the corresponding movement scheme.
1- Physical fatigue
The question intended to rate the level of fatigue after using the system provided the results depicted in Fig. 9. The G04-ST movement scheme obtained the highest percentage of positive answers (being less tiring); it reached values between 77.8% and 88.9%, while G01-PT obtained the highest percentage of negative answers (7.4% to11%).

Fatigue by movement scheme and user group
Arranging the results by movement scheme and user type, G04_ST stands out as less fatiguing for the no experience user (6.1, 95% CI 5.3,6.9), casual player (5.9, 95% CI 4.9, 6.9) and all users (5.9, 95% CI 5.4, 6.4), while G03_SP (6.0, 95% CI 5.5, 6.5) is chosen by frequent player. The most tiring movement schemes, by group, are G03_SP for the no experience user (5.1, 95% CI 4.0, 6.2) and casual player (5.3, 95% CI 4.6, 6.0); and G01_PT for frequent player (4.6, 95% CI 3.7, 5.4) and all users (5.1, 95% CI 4.6, 5.6).
2- Attention (Natural interaction)
One of the goals of natural interface design is to develop systems that interfere as little as possible with the user’s experience, responding to the user’s desires in a fluent, comfortable and confident way. A properly designed NUI must allow the user to focus as much attention as possible on the experience instead of on the control of the device.
Figure 10 displays users’ perception of their ratio of attention. It indicates the amount of attention payed to control the system versus the amount of attention attributable to the enjoyment of the experience itself. The percentages represented in the graph do not show a clear trend in one direction or another.

Level of attention by movement scheme and user group
There are even some cases of neutral valuation. Analyzing every movement scheme individually, G04-ST obtained the highest percentage of positive answers (more attention devoted to the experience), reaching values from 63% to 77.8%, while G01-PT obtained the highest percentage of negative answers (more attention devoted to control the system), reaching values between 22.2% to 66.7%.
If we consider user groups, no experience users gave more attention to the experience itself when they used G02_LT (5.3, 95% CI 4.1, 6.6). G03_SP was the best for casual player (4.8, 95% CI 4.1, 5.4) and G04_ST for frequent player (4.6, 95% CI 3.5, 5.7) and all users (4.78, 95% CI 4.3, 5.3).
The movement schemes that required more attention devoted to system control were G01_PT for casual player (3.6, 95% CI 2.5, 4.7), frequent player (3.7, 95% CI 2.7, 4.6) and all users (4.0, 95% CI 3.4, 4.6), and G03_SP for no experience (4.1, 95% CI 3.1, 5.2). Overall, G04_ST is the movement scheme that permits players to pay more attention to the experience, although the valuations of this system do not go further than 5.3 over 7 points.
3- Comfort
Of all movement schemes, G04_SP obtained the highest percentage of positive answers (more comfortable), reaching values between 77.8% and 100%, while G01-PT obtained the highest percentage of negative answers (18.5% to 33.3%). Considering user groups, G02_LT and G03_SP reached 100% positive answers for casual player and frequent player (Fig. 11).

Comfort by movement scheme and user group
Highest scores vary depending on the user group. G04_ST is the most comfortable scheme for no experience (5.8, 95% CI 5.3, 6.3) and all users (5.6, 95% CI 5.2, 5.9); G02_LT for casual player (5.9, 95% CI 5.3, 6.5) and G03_SP for frequent player (5.8, 95% CI 5.3, 6.3). The least comfortable scheme was G03-SP for no experience (5.0, 95% CI 4.1, 5.9) and G01-PT for casual player (5.2, 95% CI 4.1, 6.4), frequent player (4.8, 95% CI 3.6, 5.9) and all users (5.2, 95% CI 4.7, 5.7).
4- Pleasure
The percentage of positive answers with respect to user perception of pleasure is very high, surpassing 77.8%. There were no negative answers, so all movement schemes resulted in satisfactory experiences. G04_ST was the scheme best perceived as pleasing and exciting (88.9% to 100%), and was followed closely by G02_LT (77.8% to 88.9%).
Arranging the results by groups, the most pleasing schemes were G01_PT for no experience (6.2, 95% CI 5.8, 6.6) and G04_ST for casual player (5.9, 95% CI 5.2, 6.6), frequent player (5.8, 95% CI 5.3, 6.3) and all users (5.9, 95% CI 5.6, 6.2).
The less satisfying schemes, though well valuated (≥5.4) were G02_LT for no experience (5.6, 95% CI 4.8, 6.3), for frequent player (5.4, 95% CI 4.7, 6.1) and all users (5.6, 95% CI 5.2, 6.0), while G01_PT scored lower for casual player (5.6, 95% CI 4.8, 6.3). In short, all user groups perceived all movement schemes as pleasing and exciting, giving average values ranging between 5.4 and 6.2 (Fig. 12).

Pleasing and exciting by movement scheme and user group
5 Discussion
The analysis of the previous results, supported with the users’ comments and the notes taken by the authors during the experiment, provides clues to characterize the behavior and performance of the movement schemes and their suitability for their use in a museum environment for virtual walk-throughs.
From the previous analysis of the data, multiple usability metrics can be combined into a single usability metric [14] for each task, where variables correspond to each dimension analyzed for effectiveness, efficiency, and performance task and satisfaction. On the other hand, a unique value to represent general satisfaction can be obtained averaging fatigue, natural interaction (attention), comfort and pleasure.
Figure 13 synthesizes a single UX score by movement scheme and user group. This metric was obtained combining single usability metric and general satisfaction.

UX score
As shown on the graph, all movement schemes have UX values ≥ 67.4%, so they all can be considered adequate for their purpose. Nevertheless, the objective of this work is to find the movement scheme that may be more suitable for a NUI museum installation, regardless of the previous skills of their users in the use of 3D virtual environments, such as videogames. Also, disaggregated results may be of interest when a museum installation is designed for specific users.
Next, we will discuss the relative results obtained by each movement scheme:
G01_Point Forward/Twist Upper Body
This movement scheme can be considered less useful for museum installations for various reasons:
-
High percentage of attention devoted to control the system, less naturally interactive
-
High task completion times for both tasks
-
High percentage of time in collision state in relation to task time
-
Several user groups considered this scheme less relaxed
-
All user groups considered this scheme less comfortable, excepting for the no experience group, which gave a low valuation
-
Users expressed doubts regarding the exact pose to hold their arm in the air. Monitors indicated that several users stretched their arm completely to point left or right, keeping it in the air during the experience, thus making the experience too fatiguing. Other users raised their forearm only, making detection of the pose by the system difficult.
The metrics for this movement put it in third place of four regarding usability, and the worst valuated in perceived satisfaction. Regarding UX metric, this scheme obtained the lowest value for casual player, frequent player and all users, and obtained a 3rd place of four for the no experience group.
G02_Lean Forward/Twist Upper Body
In general, this movement scheme obtained a middle-high valuation. It stood out in efficiency, obtaining notable records:
-
Shorter average times for both tasks
-
Perceived as the easiest in task accomplishment
-
Considered relatively accurate
-
Users commented about the precision of this scheme to accelerate, turn and slow down.
Nevertheless, this scheme had a low perception of pleasure compared to other movements, and the values regarding the ratio of attention to the experience, and attention to control the system were very heterogeneous.
This scheme obtained the best metrics in usability, and was the second best of the four in general perception of satisfaction. The UX metric for this scheme was one of the best for all groups excepting frequent player.
G03_Step Forward/Point with Arm
Overall, this scheme obtained a low valuation in all dimensions. It did not present any relevant aspect to stand out over the rest.
-
Perceived as the most difficult for all groups
-
Determined the most fatiguing for no experience and casual player
-
Scored as the least comfortable for no experience
This scheme also obtained the worst usability score and got a low value regarding perception of satisfaction. For the UX score, this scheme obtained a middle-high value for frequent player, middle-low for casual player and all users and low for no experience.
G04_Step Forward/Twist Upper Body
This scheme constitutes a good candidate for museum installations. It obtained good scores on usability and general satisfaction for all user groups:
-
This movement scheme permits users to devote the most attention to the experience instead of the control of the system
-
It was the second most efficient
-
It is the least fatiguing for no experience, casual player and all users
-
Overall, it was considered the most comfortable
-
It was perceived as the most pleasing and exciting for casual player, frequent player and all users.
Regarding metrics, this scheme obtained, just after G02_LT, the second best percentage in usability, and it was the best valued of all four in perception of satisfaction, obtaining at the same time the highest UX value for no experience and the second highest for casual player, frequent player and all users.
6 Conclusions
Virtual museums can offer to their visitors much more than the mere visual representation of things. They may be seen as sources of new experiences, hence fostering a deeper interpretation and a more persistent memory that a simple exhibit.
Natural user interfaces, such as Kinect, are extremely useful to achieve this goal, but it is important to find the movement scheme that best facilitates, in terms of HCI, visiting the virtual spaces. Of all movement schemes presented here, Lean forward/Twist upper body and Step forward/Twist upper body appear to be the most appropriate to navigate such digital environments for any kind of user, regardless of the previous expertise of the visitor in other virtual realms (i.e. video games). G02_LT proved to be the most efficient scheme, and G04_ST stood out as the most balanced in all aspects with the best valuations on natural interaction.
Although this study is centered on the evaluation and interpretation of the user experience during navigation, we should not forget that learning is one of the main goals of any museum installation. Users should be able to construct concepts through the observation and experience of the content provided. Therefore, it is necessary to find out how the UX metrics obtained relate to users’ cognition, immersion and flow [28].
This could constitute a future line of research. The results obtained may also be utilized to achieve a higher level of attention to the contents inside the virtual environment as a learning tool for visitors to the museum. Hence, it is necessary to continue researching the optimization of these movement schemes and the acquisition of even more transparent movement interfaces.
The authors expect that the performance metrics and UX results presented here will be useful for designers of virtual environments to choose the natural interaction walk-through scheme that best fits their needs based on the particular features of their installation.
References
Lun, R., Zhao, W.: A survey of applications and human motion recognition with Microsoft Kinect. Int. J. Pattern Recognit. Artif. Intell. 29(05), 1555008 (2015)
Bowman, D.A., Johnson, D.B., Hodges, L.F.: Testbed evaluation of virtual environment interaction techniques. Presence: Teleop. Virt. Environ. 10(1), 75–95 (2001)
Peterson, B., Wells, M., Furness, T., Hunt, E.: The effects of the interface on navigation in virtual environments. Hum. Factors Ergon. Soc. 42, 1496–1505 (1998)
Bakker, N., Werkhoven, P., Passenier, P.: The effects of proprioceptive and visual feedback on geographical orientation in virtual environments. Presence: Teleop. Virt. Environ. 8(1), 36–53 (1999)
Maier, D., Hornung, A., Bennewitz, M.: Real-time navigation in 3D environments based on depth camera data. In: 2012 12th IEEE-RAS International Conference on Humanoid Robots (Humanoids), pp. 692–697. IEEE (2012)
Steinicke, F., Visell, Y., Campos, J., Lécuyer, A.: Human Walking in Virtual Environments, pp. 199–219. Springer, New York (2013)
Riecke, B.E., LaViola Jr., J.J., Kruijff, E.: 3D user interfaces for virtual reality and games: 3D selection, manipulation, and spatial navigation. In: ACM SIGGRAPH 2018 Courses. ACM (2018)
Bowman, D.A., Koller, D., Hodges, L.F.: A methodology for the evaluation of travel techniques for immersive virtual environments. Virtual Reality 3(2), 120–131 (1998)
Hernández-Ibáñez, L.A., Barneche-Naya, V., Mihura-López, R.: A comparative study of walkthrough paradigms for virtual environments using Kinect based natural interaction. In: 2016 22nd International Conference on Virtual System & Multimedia (VSMM), pp. 1–7. IEEE (2016)
Opaque Media K4U Homepage. https://www.opaque.media/kinect-4-unreal, Accessed 15 Feb 2019
Bowman, D., Kruijff, E., LaViola Jr., J.J., Poupyrev, I.P.: 3D User Interfaces: Theory and Practice. CourseSmart eTextbook. Addison-Wesley, Boston (2004)
Smith, S., Du’Mont, S.: Measuring the effect of gaming experience on virtual environment navigation tasks. In: 3D User Interfaces - 3DUI 2009, pp. 3–10. IEEE (2009)
Creswell, J.W.: Research Design: Qualitative, Quantitative, and Mixed Methods Approaches, 3rd edn. Sage Publications, California (2009)
Sauro, J., Lewis, J.R.: Quantifying the User Experience: Practical Statistics for User Research. Morgan Kaufmann, Burlington (2012)
Albert, W., Tullis, T.: Measuring the User Experience: Collecting, Analyzing, and Presenting Usability Metrics. Newnes, Boston (2013)
Petrie, H., Bevan, N.: The evaluation of accessibility, usability, and user experience. In: Stephanidis, C. (ed.) The Universal Access Handbook, pp. 299–314. CRC Press, Boca Raton (2009)
Lindgaard, G., Dudek, C.: What is this evasive beast we call user satisfaction? Interact. Comput. 15(3), 429–452 (2003)
Hassenzahl, M.: Hedonic, emotional, and experiential perspectives on product quality. In: Encyclopaedia of Human Computer Interaction, pp. 266–272. IGI Global (2006)
Shackel, B.: Usability–context framework design and evaluation. In: Artikkeli teoksessa Shackel, B., Richardson, S. (eds.) Human Factors for Informatics Usability, vol. 21, p. 38. Cambridge University Press, Cambridge (1991)
Shneiderman, B., Plaisant, C., Cohen, M., Jacobs, S.: Designing the User Interface: Strategies for Effective Human Computer Interaction, 5th edn. Pearson Addison-Wesley, Boston (2009)
Seffah, A., Donyaee, M., Kline, R.B., Padda, H.K.: Usability measurement and metrics: a consolidated model. Soft. Qual. J. 14(2), 159–178 (2006)
Lewis, J.R.: Usability: lessons learned… and yet to be learned. Int. J. Hum.-Comput. Interact. 30(9), 663–684 (2014)
ISO 9241–11: Ergonomics of human-system interaction – Part 11: Usability: Definitions and concepts. https://www.iso.org/obp/ui/#iso:std:iso:9241:-11:ed-2:v1:en, Accessed 15 Feb 2019
ISO/IEC 25010: Systems, software quality requirements, and evaluation (SQuaRE) system and software quality models. https://www.iso.org/obp/ui/#iso:std:iso-iec:25010:ed-1:v1:en. Accessed 15 Feb 2019
Sauro, J., Dumas, J.S.: Comparison of three one-question, post-task usability questionnaires. In: Proceedings of the SIGCHI Conference on Human Factors in Computing Systems, pp. 1599–1608. ACM (2009)
Norman, D.: The Design of Everyday Things: Revised and Expanded. Basic Books, New York (2013)
Rubin, J., Chisnell, D.: Handbook of Usability Testing: How to Plan. Design and Conduct Effective Tests. Wiley, New Jersey (2008)
Csikszentmihalyi, M.: Flow. The Psychology of Optimal Experience. Harper & Row, New York (1990)
Author information
Authors and Affiliations
Corresponding author
Editor information
Editors and Affiliations
Rights and permissions
Copyright information
© 2019 Springer Nature Switzerland AG
About this paper

Cite this paper
Barneche-Naya, V., Hernández-Ibáñez, L.A. (2019). UX Aspects of Kinect-Based Movement Schemes Inside Virtual Environments for Museum Installations. In: Zaphiris, P., Ioannou, A. (eds) Learning and Collaboration Technologies. Ubiquitous and Virtual Environments for Learning and Collaboration. HCII 2019. Lecture Notes in Computer Science(), vol 11591. Springer, Cham. https://doi.org/10.1007/978-3-030-21817-1_11
Download citation
DOI: https://doi.org/10.1007/978-3-030-21817-1_11
Published:
Publisher Name: Springer, Cham
Print ISBN: 978-3-030-21816-4
Online ISBN: 978-3-030-21817-1
eBook Packages: Computer ScienceComputer Science (R0)