
Abstract
In this chapter we discuss the history of applications of analytical methods to problems in sports and provide an overview of some analytical methods (graphs, probability, regression analysis, and mathematical programming) that are commonly applied to various problems in sports. We consider the long and complicated relationship between statistics and sports and the struggle to gain acceptance for statistical analyses in professional sports. We also highlight some analytical methods commonly applied to sports problems, including graphs, probability and probability models, regression analysis, and mathematical programming. Finally, we briefly discuss ways in which instructors use sports examples to teach analytics methods.
Access this chapter
Tax calculation will be finalised at checkout
Purchases are for personal use only
References
Albert, J. (2002). A baseball statistics course. Journal of Statistics Education, 10(2). https://doi.org/10.1080/10691898.2002.11910663.
Albert, J. (2003). Teaching statistics using baseball. Washington, DC: The Mathematical Association of America.
Albert, J. (2010). Baseball data at season, play-by-play, and pitch-by-pitch levels. Journal of Statistics Education, 18(3). https://doi.org/10.1080/10691898.2010.11889592.
Albert, J., Bennett, J., & Cochran, J. J. (Eds.). (2005). Anthology of statistics in sports. Philadelphia: Society for Industrial and Applied Mathematics.
Albert, J., & Cochran, J. J. (2005). The use of sports in teaching statistics. In J. Albert, J. Bennett, & J. J. Cochran (Eds.), Anthology of statistics in sports. Philadelphia: Society for Industrial and Applied Mathematics.
Ammar, S., & Wright, R. (2004). Comparing the impact of star rookies Carmelo Anthony and LeBron James: An example on simulating team performances in the NBA league. INFORMS Transactions on Education, 5(1), 67–74.
Anderson, D. R., Sweeney, D. J., Williams, T. A., Camm, J. D., & Cochran, J. J. (2020). Statistics for business & economics, 14e. Mason: Cengage.
Anderson, D. R., Sweeney, D. J., Williams, T. A., Camm, J. D., & Cochran, J. J. (2016). Introduction to management science: Quantitative approaches to decision making. Mason: Cengage.
Andrews, C. (2005). The ultimate flow. Journal of Statistics Education, 13(1). Hoboken, NJ: Wiley. https://www.tandfonline.com/doi/pdf/10.1080/10691898.2005.11910637.
Appel, M. (2016, October 13). Baseball books on the “New York Times” best sellers list. The National Pastime Museum. https://www.thenationalpastimemuseum.com/article/baseball-books-new-york-times-best-sellers-list
ASA Website. (2017). Brief history of the section on statistics in sports. http://community.amstat.org/sis/aboutus/history
Beaudoin, D., & Swartz, T. B. (2010). Strategies for pulling the goalie in hockey. The American Statistician, 64(3), 197–204.
Beliën, J., Goossens, D., Van Reeth, D., & De Boeck, L. (2011). Using mixed-integer programming to win a cycling game. INFORMS Transactions on Education, 11(3), 93–99.
Berring, R. C. (2010). The Macmillan baseball encyclopedia, the west system, and sweat equity. The Baseball Research Journal, 39(2), 81–83.
Bickel, J. E. (2004). Teaching decision making with baseball examples. INFORMS Transactions on Education, 5(1), 2–9.
Birge, J. R. (2004). Scheduling a professional sports league in Microsoft® excel: Showing students the value of good Modeling and solution techniques. INFORMS Transactions on Education, 5(1), 56–66.
Carter, V., & Machol, R. E. (1971). Operations research in football. Operations Research, 19(2), 541–544.
Cochran, J. J. (2000a). Career Records for all modern position players eligible for the major league baseball hall of fame. Journal of Statistics Education, 8(2).
Cochran, J. J. (2000b). Successful use of cases in introductory undergraduate business college operations research courses. The Journal of the Operational Research Society, 51(12), 1378–1385.
Cochran, J. J. (2002). Data management, exploratory data analysis, and regression analysis with 1969-2000 major league baseball attendance. Journal of Statistics Education, 10(2).
Cochran, J. J. (2004a). Bowie Kuhn’s worst nightmare. INFORMS Transactions on Education, 5(1), 18–36.
Cochran, J. J. (2004b). Introduction to the special issue: SpORts in the OR classroom. INFORMS Transactions on Education, 5(1), 1.
Cochran, J. J. (2005). Can you really learn basic probability by playing sports board games? The American Statistician, 59(3), 266–272.
Cochran, J. J. (2008). The optimal value and potential alternatives of Bill James’ Pythagorean method of baseball. StatOR, 8(2).
Cochran, J. J. (2009). Pedagogy in operations research: Where have we been, where are we now, and where should we go? ORiON, 25(2), 161–184.
Cochran, J. J. (2010, Jan/Feb). The emergence of sports analytics: From baseball and football to basketball and hockey, analytics gets a year-round workout in the athletics arena, analytics. http://analytics-magazine.org/the-emergence-of-sport-analytics/
Cochran, J. J. (2011). Linear programming. In J. J. Cochran (Ed.), Encyclopedia of operations research and the management sciences. Hoboken, NJ: Wiley.
Cochran, J. J. (2012). You want them to remember? Then make it memorable! European Journal of Operational Research, 219(3), 659–670.
Cochran, J. J., Bennett, J., & Albert, J. (Eds.). (2017). The Oxford anthology of statistics in sports volume 1: 2000–2004. London: Oxford University Press.
Cover, T. M., & Keilers, C. W. (1977). An offensive earned-run average for baseball. Operations Research, 25(5), 729–740.
Dixon, J. C., Chittle, L., & Horton, S. (2015). An age-old problem in little league baseball. Case Studies in Sports Management, 4(1), 1–6.
Gennaro, V. (2013). Diamond dollars case competition: The Mike trout dilemma. Case Studies in Sports Management, 2(1), 60–65.
Gill, P. S. (2000). Late-game reversals in professional basketball, football, and hockey. The American Statistician, 54(2), 94–99.
Gillette, G., Nowlin, B., & Pomrenke, J. (Eds.). (2017). A history of SABR. https://sabr.org/about/history
Hill, S. E., & Schvaneveldt, S. J. (2011). Using statistical process control charts to identify the steroids era in major league baseball: An educational exercise. Journal of Statistics Education, 19(1).
INFORMS Website. (2017). http://connect.informs.org/sports/home
Ingolfsson, A. (2004). Simulating NHL games to motivate student interest in OR/MS. INFORMS Transactions on Education, 5(1), 37–46.
James, B. (1985). The Bill James historical baseball abstract. New York: Villard.
Kvam, P. H., & Sokol, J. S. (2004). Teaching statistics with sports examples. INFORMS Transactions on Education, 5(1), 75–87.
Lee, S., & Juravich, M. (2017). Multi criteria decision-making: Ticket sales outsourcing in an NCAA division I athletic department. Case Studies in Sports Management, 6(1), 31–38.
Lewis, M. (2003). Moneyball: The art of winning an unfair game. New York: W. W. Norton & Company.
Lindsey, G. R. (1959). Statistical data useful for the operation of a baseball team. Operations Research, 7(2), 197–207.
Lindsey, G. R. (1963). An investigation of strategies in baseball. Operations Research, 11(4), 477–501.
Machol, R. E., & Ladany, S. P. (Eds.). (1976). Management science in sports. New York: North-Holland.
Manage, A. B. W., & Scariano, S. M. (2013). An introductory application of principal components to cricket. Journal of Statistics Education, 21(3).
Marchi, M., & Albert, J. (2013). Analyzing baseball data with R. Abingdon: Chapman and Hall/CRC.
Morrison, D. G. (1976). On the optimal time to pull the goalie: A Poisson model applied to a common strategy used in ice hockey. TIMS Studies in the Management Sciences, 4, 67–78.
Morrison, D. G., & Wheat, R. D. (1986). Misapplications reviews: Pulling the goalie revisited. Interfaces, 16(6), 28–34.
Mullet, G. M. (1977). Simeon Poisson and the national hockey league. The American Statistician, 31(1), 8–12.
Naraine, M., Kerwin, S., & Parent, M. M. (2016). Oh captain, my captain! Using social network analysis to help coaching staff identify the leadership of a national sports team. Case Studies in Sports Management, 5(1), 80–84.
Neft, D. S., Allen, L., & Markel, R. (1969). The baseball encyclopedia: The complete and official record of major league baseball. New York: Macmillan.
Rickey, R. (1954, August 2). Goodbye to some old baseball ideas. Life, 78–89.
Romer, D. (2006). Do firms maximize? Evidence from professional football. Journal of Political Economy, 114(2), 340–365.
Schwarz, A. (2004). The numbers game: Baseball’s lifelong fascination with statistics. New York: St. Martin’s.
Sokol, J. S. (2004). An intuitive Markov chain lesson from baseball. INFORMS Transactions on Education, 5(1), 47–55.
Steinberg, L. (2015, August 18). Changing the game: The rise of sports analytics. Forbes.
Sweeney, K., & Schramm-Possinger, M. (2016). Do stadium upgrades influence fan attendance? The case of the Jacksonville Jaguars. Case Studies in Sports Management, 5(1), 73–79.
Sweeney, K., Schramm-Possinger, M., Gregg, E. A., & Stranahan, H. (2016). Predicting consumer commitment: A case study of the NFL and ray rice. Case Studies in Sports Management, 5(1), 89–94.
Tabor, J., & Franklin, C. (2012). Statistical reasoning in sports. New York: W. H. Freeman.
Tiger, A. A., & Salzer, D. (2004). Daily play at a golf course: Using Spreadsheet simulation to identify system constraints. INFORMS Transactions on Education, 4(2), 28–35.
Trick, M. A. (2004). Using sports scheduling to teach integer programming. INFORMS Transactions on Education, 5(1), 10–17.
Wakefield, L., & Bennett, G. (2016). How do fans feel? A case analysis of measuring and modeling attitudes using partial least squares structural equation modeling. Case Studies in Sports Management, 5(1), 85–88.
Willoughby, K. A. (2004). The science of sports: Combining quantitative analysis and sports applications in an undergraduate course. INFORMS Transactions on Education, 5(1), 88–99.
Author information
Authors and Affiliations
Corresponding author
Editor information
Editors and Affiliations
Solutions to Exercises
Solutions to Exercises
-
1.
-
(a)
The following line plot shows the number of points scored per game by the University of Alabama men’s basketball team during the 2016–2017 regular season.
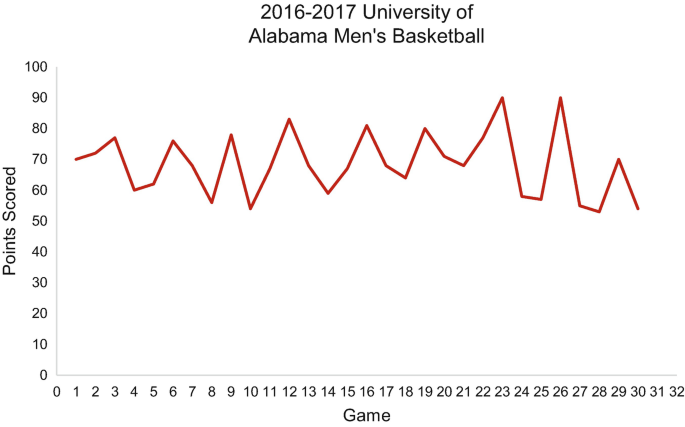
We can see that the team generally scored between 50 and 80 points per game.
-
(b)
The following line plot shows the number of points allowed per game by the University of Alabama men’s basketball team during the 2016–2017 regular season.
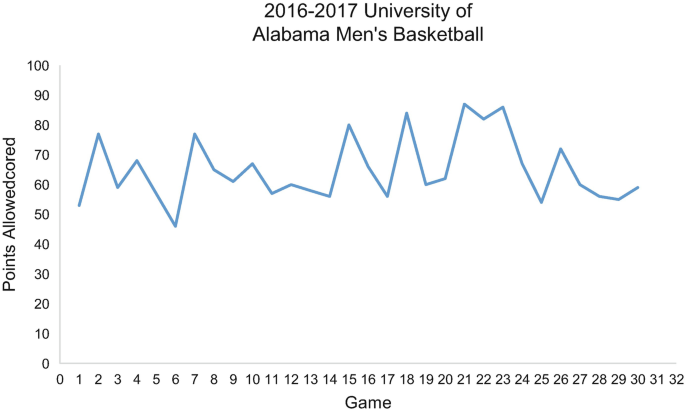
We can see that the team generally allowed between 55 and 80 points per game.
-
(c)
The following overlay of line plots shows the number of points scored and points allowed per game by the University of Alabama men’s basketball team during the 2016–2017 regular season.
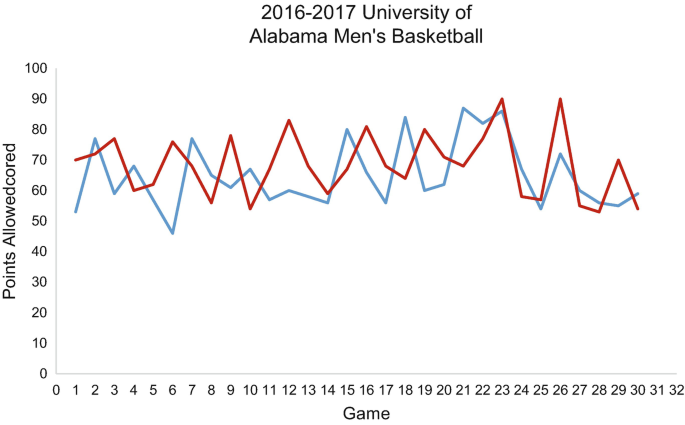
The graph shows that the University of Alabama men’s basketball team won slightly more games than it lost (its regular season record was 17 wins and 13 losses).
-
(a)
-
2.
-
(a)
The following histograms show the number of home runs hit at each age by Willie McCovey, Jimmie Foxx, Mike Schmidt, Mel Ott, Ken Griffey, Jr., and Harmon Killebrew.
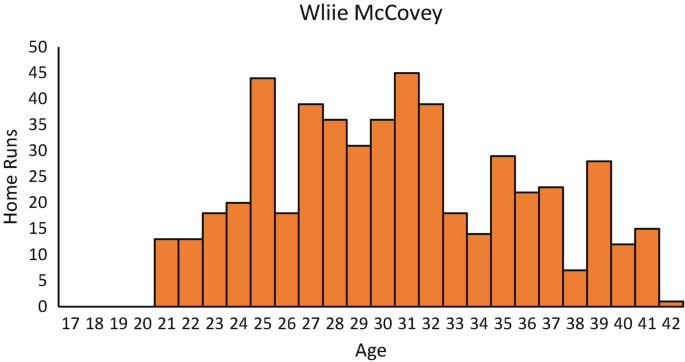
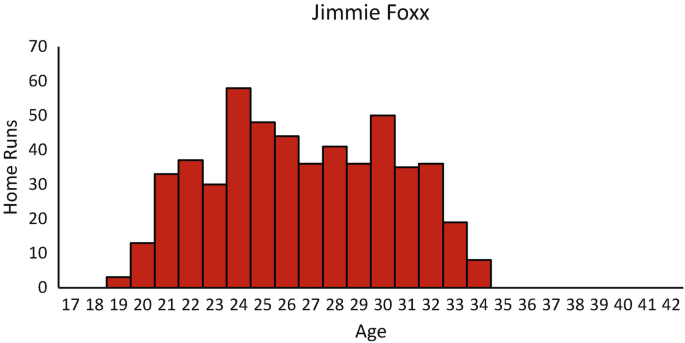
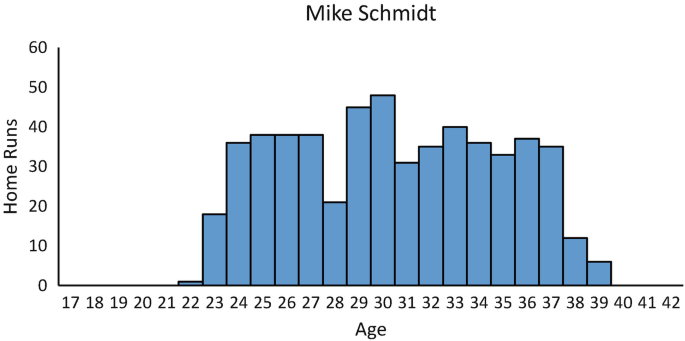
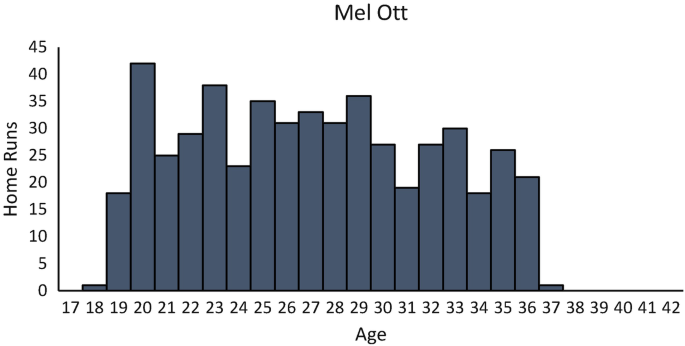
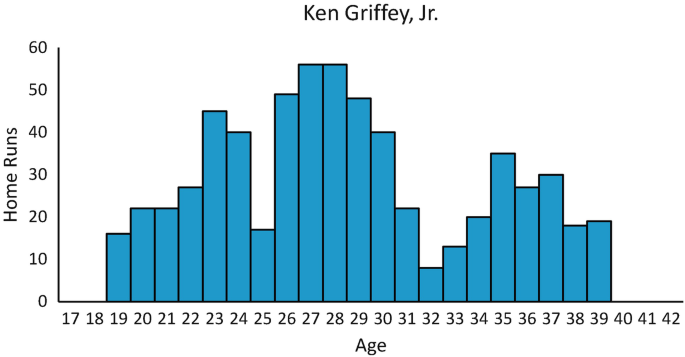
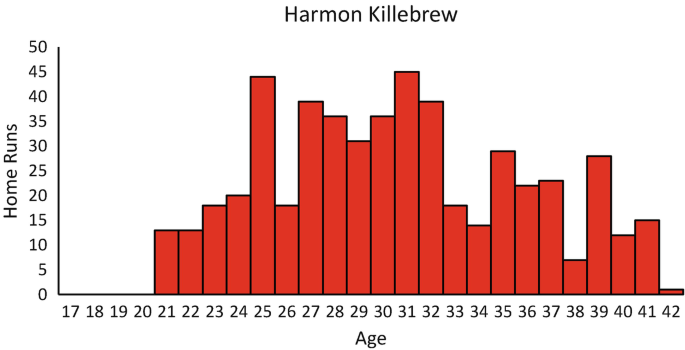
We can see that Jimmie Foxx, Mel Ott, and Ken Griffey, Jr. were productive at younger ages and Willie McCovey, Mike Schmidt, and Harmon Killebrew did not become major league home run threats until they were a bit older.
-
(c)
The following side-by-side bar chart simultaneously shows the number of home runs hit by Willie McCovey, Jimmie Foxx, Mike Schmidt, Mel Ott, Ken Griffey, Jr., and Harmon Killebrew at each age.
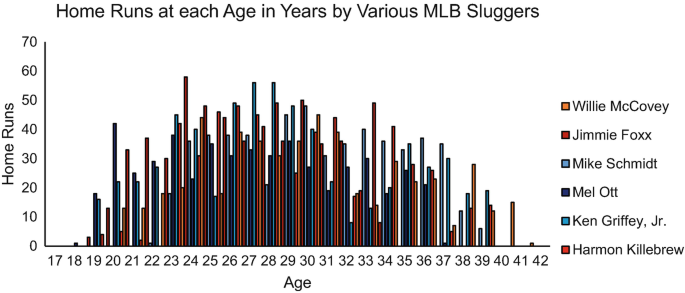
We can see that home run productivity generally increases as a player ages, peaks around ages 27–30, and then decreases as the player ages.
-
(a)
-
3.
Data for the 2017 Major League season are provided in the table that follows.
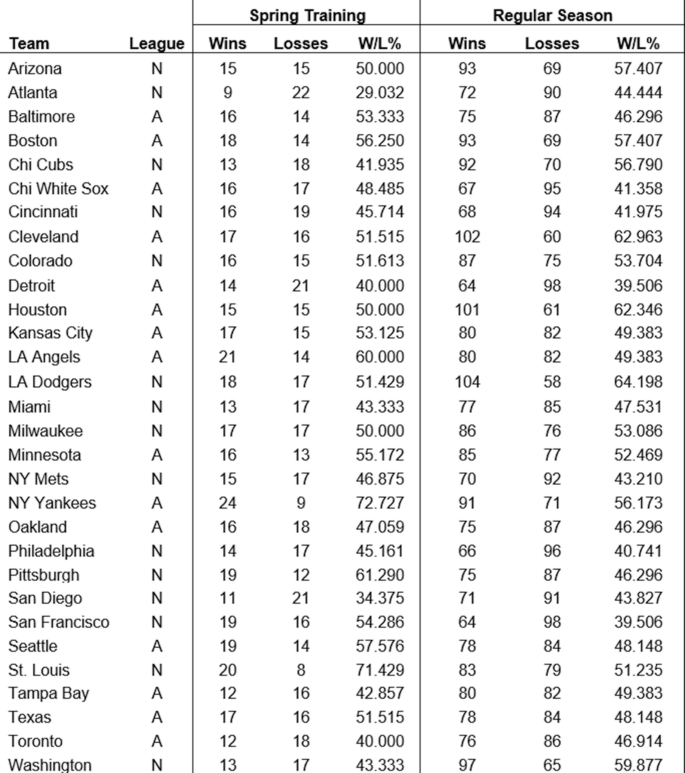
Let x = Spring Training W/L% and y = Regular Season W/L%. We have that:
\( \sum \limits_{i=1}^n{x}_i{y}_i=75492,\sum \limits_{i=1}^n{x}_i=1500,\sum \limits_{i=1}^n{y}_i=1500,\sum \limits_{i=1}^n{x}_i^2=77468,\mathrm{and}\ n=30 \)
so
\( {b}_1=\frac{75492-\frac{(1500)(1500)}{30}}{77468-\frac{1500^2}{30}}=0.2063 \)
and
\( {b}_0=\frac{1500}{30}-(0.2063)\left(\frac{1500}{30}\right)=39.6906 \)
Thus, the estimated Regular Season W/L% (\( \hat{y} \)) for some Spring Training W/L% (x) is:
\( \hat{y}=39.6906+0.2063x \)
The results suggest that a 1% increase in a team’s Spring Training W/L% (x) coincides with a 0.2063% increase in the team’s Regular Season W/L% (y). A change in a team’s Spring Training W/L% does not appear to coincide with much change in its Regular Season W/L%.
-
4.
The number of free throws the WNBA player makes (x) in n = 6 attempts is binomially distributed with p = 0.75, so
(a) The probability she will make exactly three of these free throw attempts~is:
\( \Pr (3)=\left(\begin{array}{c}6\\ {}3\end{array}\right){0.75}^3{\left(1-0.75\right)}^{6-3}=0.131835938 \)
(b) The probability she will make all six of these free throw attempts is:
\( \Pr (6)=\left(\begin{array}{c}6\\ {}6\end{array}\right){0.75}^6{\left(1-0.75\right)}^{6-6}=0.177978516 \)
(c) The probability she will make none of these free throw attempts is:
\( \Pr (0)=\left(\begin{array}{c}6\\ {}0\end{array}\right){0.75}^0{\left(1-0.75\right)}^{6-0}=0.000244141 \)
-
5.
-
(a)
IAE’s goal is to maximize its profit, and the profit IAE will earn is a function of the number of standard-size tennis racquets (X 1) and the number of oversized tennis racquets (X 2) it produces during the next week. The linear programming model that will determine the number of racquets of each type IAE should manufacture over the next week to maximize the total profit is:
Maximize
30X 1 + 45X 2
Subject to
4.4X 1 + 14X 2 ≤ 2850 (ounces of titanium alloy)
20X 1 + 24X 2 ≤ 9600 (manufacturing time)a
0.8X 1 − 0.2X 2 ≥ 0 (ratio of standard rackets to total racquets produced)b
X 1 ≥ 0
X 2 ≥ 0
-
(a)


-
(b)
The number of standard-size tennis racquets (X 1) = 378.440367, the number of oversized tennis racquets (X 2) = 84.63302752, and the maximum total profit is $15,161.69725.
-
(c)
The optimal number of standard-size tennis racquets and oversized tennis racquets to produce during the week are not integer. We could address this concern by adding the following two constraints to the formulation:
X 1 ∈
X 2 ∈
and resolving the problem as an integer programming problem. For this integer programming problem, the number of standard-size tennis racquets (X 1) = 379, the number of oversized tennis racquets (X 2) = 84, and the maximum total profit is $15,150.00 (note that simply rounding the optimal values of the decision variables from a linear programming problem does not generally yield the optimal integer solution).
Rights and permissions
Copyright information
© 2019 Springer Nature Switzerland AG
About this chapter

Cite this chapter
Cochran, J.J. (2019). Overview of Numerical Methods: Introduction to Analytical Methods in Sports. In: Pallis, J., McNitt-Gray, J., Hung, G. (eds) Biomechanical Principles and Applications in Sports. Springer, Cham. https://doi.org/10.1007/978-3-030-13467-9_5
Download citation
DOI: https://doi.org/10.1007/978-3-030-13467-9_5
Published:
Publisher Name: Springer, Cham
Print ISBN: 978-3-030-13465-5
Online ISBN: 978-3-030-13467-9
eBook Packages: Biomedical and Life SciencesBiomedical and Life Sciences (R0)