
Abstract
Governments are releasing their data to the public to accomplish benefits like the creation of transparency, accountability, citizen engagement and to enable business innovation. At the same time, decision-makers are reluctant to open their data due to some potential risks like misuse, sensitivity, ownership, and inaccuracy of the data. The goal of the study presented in this paper is to develop a Fuzzy Multi-Criteria Decision Making (FMCDM) approach to analyze the risks and benefits to determine the decision to open a dataset. FMCDM is chosen due to its capability to measure and weight the relative importance of the criteria. FMCDM need the weighting of criteria as input. For this Fuzzy Analytical Hierarchy Process (FAHP) is utilized by collecting input from experts’ knowledge and expertise. The scores for each criterion are summed up to rank the importance of the alternatives. Four main criteria are used, e.g. data sensitivity and data ownership representing risks criteria, and data availability and data trustworthy as benefits criteria. For each criterion, there were two sub-criteria identified. Four types of decisions to open data can be made: completely open, maintain suppression, provide limited access, and remain closed. A health patient record dataset is used to illustrate the approach. In further research, we recommend to develop automated approaches that take a dataset as an input and can provide an advice.
You have full access to this open access chapter, Download conference paper PDF
Keywords
1 Introduction
The motivation to open data by governments and private organizations have increased extensively over the last few years. The creation of transparency and accountability, to sustain citizen engagement and to enable business innovation are the main drivers to open more data [1,2,3,4]. The disclosure of data is expected to improve decisionmaking initiatives by both government and society [3, 5]. Furthermore, the opening of data by organizations can improve an organization’s reputation by showing that they are an open institution [6].
However, although divers types of datasets have already been opened [7,8,9], in reality many datasets are still not opened [10]. There are several reasons why the data providers reluctance for opening datasets, including: (1) barriers of implementing the systems [11, 12]; (2) risks like inaccuracy, misuse, sensitivity, and inconsistency of the data [3, 10, 12,13,14,15,16,17]; and (3) inappropriate interpretation of the data resulting in an inadequate comprehend of the data [3]. Moreover, mistakes in interpreting data or misuse of data can jeopardize the reputation of data providers [11]. This result in many datasets to remain closed, whereas this might not be necessary.
The goal presented in this study is to develop a Fuzzy Multi-Criteria Decision Making (FMCDM) approach to analyze the risks and benefits and to determine the best alternative decision for a given dataset. The use of Fuzzy set theory in this research is to manage decision-making problem of alternative selection of a dataset status. These alternatives are developed by establishing and incorporating the FMCDM based on Fuzzy Analytic Hierarchy Process (FAHP) [18, 19]. The main function of the Fuzzy logic is to capture the expertise of open experts and to express it with computational approach [20,21,22]. A Fuzzy theory is based on the intuitive reasoning by considering the human subjectivity and incorrectness, which are common in the natural language [23]. The natural language is an intricate structure both in the human communication and the way how the human being thinks [23, 24].
Fuzzy theory is used in this paper to provide a mathematical strength for the emulation of the higher cognitive function from the human thought and perception associated with weights of the risks and benefit of opening data. The main function of the FMCDM is to assess the alternative selection with respect to predetermined criteria for a single decision making [25]. The appropriateness of the alternative compares to the criteria and the priority weights of each criterion can be analyzed and computed using linguistic matrix values reflected by the fuzzy [20, 26]. FAHP, furthermore, is used to determine the preference weightings of criteria by collecting expert’s judgment [18, 27]. The scores for each criterion are summed up to rank the importance of the alternatives [28, 29].
This FAHP technique used in this study consists of the six following steps [18, 19, 27], namely: (1) select experts team; (2) determine the evaluation criteria and construct the hierarchy, including alternatives; (3) construct pairwise comparison matrix and evaluate the relative importance of the criteria; (4) transform the linguistic terms into triangular fuzzy number; (5) calculate the Fuzzy weights matrix, and check the consistency of the pairwise comparison matrix; and (6) select the best alternative. A dataset of health patient records is used in the illustration part to show how the risk and benefit multiple criteria can be analyzed by employing the FMCDM approach. The four possible decisions are completely open, maintain suppression, provide limited access, or remain closed. These are the alternatives for the FMCDM and decisions on these alternatives will be analyzed based on the four main criteria, namely data sensitivity and data ownership for the risk criteria, while data availability and data trustworthiness are the criteria for the benefit. Data sensitivity and ownership are selected as input because of these criteria can represent some privacy violation issues containing in health patient records dataset. For example, in the case of data sensitivity, by releasing the actual value of name, date of birth, place of birth, home address, or insurance provider of a patient, it might be potentially misused by the unauthorized users. In addition, data availability and data trustworthiness are chosen criteria due to they can reflect the benefit of transparency and accountability in opening data. Each of the criteria has sub-criteria to further refine the risks and benefits. In Sect. 3.3, we will explain the sub-criteria definition and relationship in more detail.
This paper is consists of six sections. In Sect. 1 the rationale of this research is presented, Sect. 2 contains the related work of decision-making to open data. In Sect. 3 the approaches are described, including proposed flow process, alternatives, and criteria selection for FMCDM which is based on FAHP method. Section 4 provides the illustration and results. Section 5 some findings of the study are provided. Finally, the paper will be concluded in Sect. 6.
2 Related Work
In order to present the current approaches of decision analysis in the domain of open data, we reviewed literature which is summarized in Table 1. We found three limited works about decision-making analysis for opening data. Existing work uses the following methods: (1) trade-offs method to weigh the values and risks of open data by conducting interview sections with exclusive groups like civil servants and archivists, (2) decision-support framework to develop a prototype based on the open data ecosystem for specific groups like business and private organization, and (3) an iterative method using Bayesian-belief Networks to weigh the risks and benefits of opening data.
Yet, none of these related works utilized an FMCDM approach in a sense to measure and determine the best alternative for deciding a single status of a dataset. Some possible advantages the use of the FMCDM approach compare to three other methods are: (1) the capability to consider the human subjectivity and incorrectness from the common natural language [32]; (2) provides assessment of the alternatives selection with respect to predetermined criteria for a single decision making [25]; and (3) its simplicity characteristic to evaluate multiple conflicting in decision-making as one of the most popular problems handled by researchers in the literature [25, 32].
3 Decision-Making Approach
In this section, we aim to describe the decision-making approach for analyzing risks and benefits of open data. Four subsections are described, namely flow process of the proposed method, alternatives, selection of criteria, and FAHP technique.
3.1 Flow Process of Proposed Method
To describe how the FMCDM approach works, we use a flow of decision-making process having three main phases, namely data source, evaluation, and decision. The entire process starts with the selection of the dataset from the data source to create the input for the evaluation phase. The input data are processed next in the evaluation phase. The output of the evaluation namely decision stage is a suggestion to make a decision. The latter is done by showing the rank of decision priority (decision), as shown in Fig. 1.

The flow process of the approach
The flow process is based on the data source, evaluation of input data (data source) and decision. Figure 1 illustrates the staging of analyzing the risks and benefits of opening data, and it can be narrated as follows:
-
Data Source: First, we need to select the type of a dataset. For example, in this study, we have chosen health patient records and Table 1: diagnosed stage (see Fig. 3) as the object to be analyzed. To define the criteria and sub-criteria, an extensive literature review related to the risks and benefits of opening data has done in Sect. 2. In this study, we designed four criteria and eight sub-criteria of the risks and benefits as the input data.
-
Evaluation: In the second stage, we used FMCDM to assess the alternatives based on criteria defined in the data source elicitation phase and the criteria uses linguistic matrix values reflected by the Fuzzy. FMCDM works on Fuzzy AHP technique has an essential role to measure the relative importance of defined criteria for dealing with decision-making problem. To quantify the relative importance of the risks and benefits, we picked up the knowledge from the experts’ judgment. There are two main steps to conduct an evaluation process by the experts in AHP, as follows [27, 33]: To begin with, experts should rank the criteria in a descending or ascending order of their significance. Then, determining the most important criteria and compare it with others. For example, an expert ranked that data sensitivity (C1) is higher or essentially important than data ownership (C2). Second, experts will determine the criteria weights by transforming pairwise comparison matrix into a triangular fuzzy number, as can be seen in Fig. 5.
-
Decision: Finally, the outcome of this flow process is to get the final weights of the best alternative as the priority of a decision.
3.2 Alternatives
The following four alternatives of opening data in this paper are: opening the dataset (A1), maintaining a dataset suppression (A2), providing limited access (A3), or keeping the dataset closed (A4). First, the alternative “open the dataset” is defined as publishing the dataset presents a low risk to an individual or organization identity, and/or the potential benefits of the dataset substantially outweigh the potential risks. Second, the alternative “maintaining suppression” is specified as removing a data field and/or an individual record into particular groups or generate unique characteristics to avoid the personal identity. In this alternative, data that might create significant risks are not opened in the actual form, as the potential benefits do not outweigh the possibility of the risks. Third, the alternative “limited access” defines that only a certain group will be given access to the data. The level of openness is limited. Often those who will gain access have to sign a document that outlines the rules of access. The reason for this is releasing the dataset will create a moderate risk, or potential benefits of the dataset do not outweigh the potential privacy risks. Fourth, the alternative “keeping the dataset closed”, it means that by publishing the dataset generates a very high risk to an individual or organization and significantly outweigh the potential benefits.
3.3 Selection of Criteria
Figure 2 represents the hierarchy of the four criteria, eight sub-criteria, and four alternatives. The four criteria C1, C2, C3 and C4 define data sensitivity, data ownership, data availability, and data trustworthy respectively. The data sensitivity (C1) composes of two sub-criteria: individual life-threatening (C1.1) and data identifiable (C1.2). Individual life-threatening (C1.1), can be defined as a potential risk to an individual or personal life because of the possibility to recognize the sensitive value of the dataset. Data identifiable (C1.2) is specified as the potential leak of the personal, organizational, business or even government data identifiable e.g. by combining some attributes of the field.

The hierarchy of criteria and alternatives
The second criterion is data ownership (C2) which consists of two sub-criteria namely metadata scanning (C2.1) and fake or misleading (C2.2). Metadata scanning (C2.1) can be represented to figure out the property and structure of the dataset. Fake or misleading (C2.2) is defined by a user to potentially change and modify the dataset and affect an unreliable and wrong decision. Data availability (C3) is the third criterion and it has two sub-criteria namely data manageability (C3.1) and data recoverability (C3.2). Data manageability (C3.1) is specified as the chance to manage the availability and accessibility of the dataset. Data recoverability (C3.2) is indicated by delivering a dataset and it can have a highly positive impact on recovering the availability of the data. The fourth criterion is data trustworthiness (C4) which consists of two sub-criteria like data traceability (C4.1) and data authenticity (C4.2). Data traceability (C4.1) can make the possibility to trace the source of the dataset. Data authenticity (C4.2) is defined as the potentially affected to recognize the authentication of the data.
3.4 Fuzzy AHP Technique
The AHP process is a quantitative method that deals with the multi-attribute, multicriteria, multi-period problem hierarchically [34]. Only with AHP, it is not possible to overcome the deficiency of the fuzziness during decision making [35]. Hence, in this study, the Fuzzy AHP which is the extension of the conventional AHP method by integrating fuzzy comparison ratios is used for multi-criteria analysis [18, 27, 34, 36]. It uses the triangular fuzzy number of fuzzy set theory directly into the pairwise comparison matrix of the AHP. The geometric mean method is used to generate fuzzy weights and performance scores [37]. The steps of the Fuzzy AHP can be summarized as follows:
-
Step 1. Select experts. The quality of the evaluation process depends on experts’ knowledge and experience. Hence the selection of experts is crucial.
-
Step 2. Determine the evaluation criteria and construct the hierarchy including alternatives.
-
Step 3: Construct pairwise comparison matrix and evaluate the relative importance of the criteria. The experts are expected to provide their judgment on the basis of their knowledge.
For any expert the comparison matrix is given by Eq. (1) as:
-
(a)
$$ \tilde{C}_{\text{k}} = \left[ {\begin{array}{*{20}l} 1 \hfill & {\tilde{c}12 \ldots } \hfill & {\tilde{c}1n} \hfill \\ \vdots \hfill & \ddots \hfill & \vdots \hfill \\ {\tilde{c}n1} \hfill & {\tilde{c}n1 \ldots } \hfill & 1 \hfill \\ \end{array} } \right] $$(1)
where n is the number of criteria, \( \tilde{C}_{\text{k}} \) is a pairwise comparison matrix belongs to kth expert for k = 1, 2.. k.
-
(b)
Arithmetic mean is used to aggregate experts’ opinion as given in Eq. (2).
$$ \tilde{C} = \frac{1}{k}\left( {\frac{1}{c} + \frac{2}{c} + \ldots + \frac{k}{c}} \right) $$(2)
-
(a)
-
Step 4: Transform the linguistic terms into triangular fuzzy numbers. The following linguistic terms provided in Table 2 are utilized for the evaluation procedure.
Table 2. The fuzzy linguistic scales (adapted from: [18]) -
Step 5: Calculate the fuzzy weight matrix using Eqs. (3) and (4).
$$ \tilde{r}_{\text{i}} = \left( {\tilde{c}_{\text{i1}} \otimes \tilde{c}_{\text{i2}} \otimes \ldots \otimes \tilde{c}_{\text{in}} } \right)^{{\frac{1}{n}}} $$(3)$$ \tilde{w}_{i} = \tilde{r}_{i} \otimes \left( {\tilde{r}_{1} + \tilde{r}_{2} + \cdots \tilde{r}_{n} } \right)^{ - 1} $$(4)where \( \tilde{r}_{i} \) is the geometric mean of fuzzy comparison value and \( \tilde{w}_{i} \) is the fuzzy weight of the ith criteria.
-
Step 6: Apply normalization procedure as Eq. (5)
$$ w_{i} = \frac{{\tilde{w}_{i} }}{{\sum\nolimits_{j = 1}^{n} {\tilde{w}_{j} } }} $$(5)
4 Illustration of FMCDM
In this section, we will illustrate the FMCDM using a health patient records dataset with the help of Fuzzy AHP technique. The reason for selecting this dataset is that it contains the typical both benefits and risks. The variety of benefits from the selected dataset, include the data availability of the hospital medical records by providing accurate, up-to-date, and enable quick access by the users to the patient records. However, from the side of the risks, by releasing the patient health records attributes, it might also encounter endangers like the name_of_patient, date_of_birth, and place_of_birth that result in the identification of individuals in a privacy violation.
4.1 Data Source: Health Patient Records Dataset
In the scenario of the illustration part, we designed that the government proposes a Department of Health to release a dataset of medical records of patient to the public that can enable individual or organization to access and see the current trend of a disease [38, 39]. By doing so, for instance, the government is able to generate a location map related to the disease landscape for some regions or specific attributes. However, if the government decides to open the dataset and actual values immediately, there are some potential privacy issues of the patients containing in the dataset that might be very harmful like misuse, inaccuracy, and identifiable of the data [39, 40, 41]. Figure 3 shows the dataset structure of the health patient records that will be analyzed using FMCDM in this study.

For the illustration of this work, we designed to analyze the Table 1 namely Diagnosed Stage which is containing six attributes/fields: Name_of_patient, Date_of_birth, Place_of_Birth, Gender, Race, Insurance, Stage, and TNM_staging.
4.2 Evaluation: Analyzing the Dataset
The following steps are the scenarios of FMCDM. Figure 4 shows the hierarchy of criteria and alternatives are used in the illustration of FMCDM.

Hierarchy of criteria and alternatives for the illustration
-
Step 1. Establish an expert team. We picked up the knowledge as well as expertise from some experts. The selected experts were interviewed based on the three consideration rationales, namely: (1) Domain knowledge, where the importance of educational background of the experts in this field ought to accommodate various specializations with partial overlap to confirm completeness of the data and available information [42]; (2) Functional knowledge, where the experts chose are capable in the scope of the existing problems and the requirements of the process as well as solution proposed [42]; and (3) Best practice, where the interviewee’s expertise and their own insight have to be outstanding to warrant the quality as well as the validity of information sources [43].
-
Step 2. Determine the evaluation criteria and construct the hierarchy including alternatives.
-
Step 3. Construct pairwise comparison matrix and evaluate the relative importance of criteria. The experts are asked to provide their consideration based on their knowledge and expertise. For simplicity, in this illustration a pairwise comparison matrix for expert one is given in Fig. 5. Before the experts started to quantify the criteria, we expected to construct a Fuzzy evaluation linguistic scale for the weights as presented in Table 2.
Fig. 5. 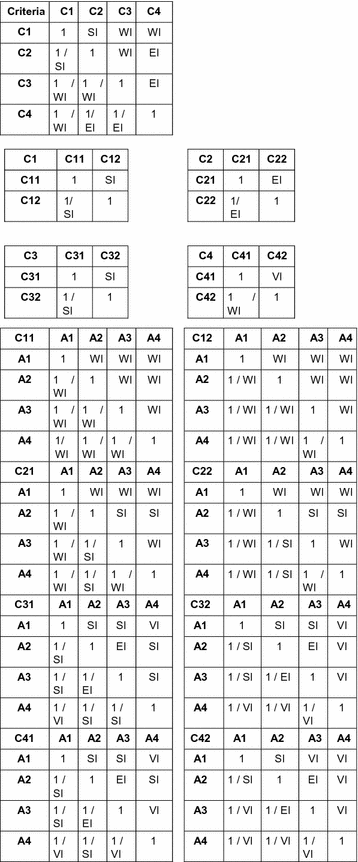
The pairwise comparison matrices of criteria and alternatives
-
Step 4: Transform the linguistic terms into triangular fuzzy numbers. The linguistic terms provided in Table 2 are utilized for the evaluation procedure.
-
Step 5: Calculate the fuzzy weight matrix using Eqs. (3) and (4). The final weights of the alternatives are calculated using Eqs. (3), (4), and (5). The linguistic terms provided in Table 2 are utilized for the evaluation and fuzzy operational laws are used for the calculation [18, 27]. Illustrative examples for weights of subcriteria C11 and C12 are given as follows:

Calculating sub-criteria: Linguistic terms for the pairwise comparison, we are getting from Fig. 5 and the corresponding fuzzy numbers are getting from the Table 2. For example, pairwise comparison of (C1.1 C1.2) is “Equal Important” and the fuzzy number of this linguistic term is (1, 1, 3).
Calculating weights: For calculating weights, we are using Eq. 4. In the previous step, we are getting the value of ̃1.1 and ̃1.2 and putting these values in the following equation.
-
Step 6: Apply normalization procedure.
Normalized weight values: To find the normalized weights of C1.1 and C1.2 we used Eq. 5.
The similar calculation approach is applied for all pairwise comparisons. The final weights of the alternatives are provided in Table 3. An illustrative example for WA1 is given as follows:
4.3 Decision: Recommendations
According to the Table 3, the highest priority of the decision for the Table 1 (Diagnose Stage) of Health Patient Records is A2 (0.42), following by A1 (0.34), and A3 (0.08), while in the last ranking of decision recommendation is A4 (0.06). Based on the analyzing and computing process, in this case we recommended that the Table 1 (Diagnose Stage) should be maintaining suppression as the highest priority recommendation in this illustration.
5 Findings
In order to present the recommendations based on the final results of the analyzing process using FMCDM, we designed a graphical view to support the decision-makers to decide to release their dataset. Figure 6 shows how the Fuzzy AHP could help the decision-makers with the better understanding of the comparison score for each alternative.

Ranking of decision recommendations
Furthermore, to design the action plan of the maintaining suppression, some possible procedures could be taken into account as follows: (1) removing a data field or an individual attributes into particular group of the data and replace it into unique characteristics; (2) obscuring a data field by making substitution precise data values with ranges to minimize the provision of the personal identity; and (3) Aggregating a data field by summarizing the data across the amounts of the data and visualizing the data value into statistics form like graphics or charts.
6 Conclusion
In this paper, we presented the results of a study by utilizing Fuzzy AHP to analyze the risks and benefits of opening data for determining the best alternative in the health patient records dataset. A set of criteria and a variety of sub-criteria were designed and identified base on the literature review and experts’ judgment. Some advantages the use of the FMCDM approach compare to other three methods as follows: (1) the capability to transform the human subjectivity and incorrectness from the common natural language to weights the complex problems, and (2) provides assessment method of the selected alternatives to rank a single decision making. However, a disadvantage found while using this approach is because the fuzzy is a ruled-based system, hence it needs to get enough rules to be accurate and expressively. The contribution resulted from this paper is to provide a decision-making model to analyze the potential risks and benefits of opening data. A given dataset is evaluated by taking action like measuring and weighing the relative importance of the multiple criteria.
Thus, the approach might contribute decision makers to decide to open a dataset. In the further research, we recommend refining this approach by adding more datasets in which and advice for (not) opening data can be generated without human involvement.
References
Ali-Eldin, A.M.T., Zuiderwijk, A., Janssen, M.: Opening more data: a new privacy scoring model of open data. In: Seventh International Symposium on Business Modelling and Software Design (BMSD 2017). SCITEPRESS - Science and Technology Publication, Lda, Barcelona, Spain (2017)
Lourenço, R.P.: An analysis of open government portals: a perspective of transparency for accountability. Gov. Inf. Q. 32(3), 323–332 (2015)
Zuiderwijk, A., Janssen, M.: Open data policies, their implementation and impact: a framework for comparison. Gov. Inf. Q. 31(1) (2013)
Luthfi, Ahmad, Janssen, Marijn, Crompvoets, Joep: A Causal Explanatory Model of Bayesian-belief Networks for Analysing the Risks of Opening Data. In: Shishkov, Boris (ed.) BMSD 2018. LNBIP, vol. 319, pp. 289–297. Springer, Cham (2018). https://doi.org/10.1007/978-3-319-94214-8_20
Ubaldi, B.: Open government data: towards empirical analysis of open government data initiatives. OECD Working Papers on Public Governance, vol 22, p. 60 (2013)
Janssen, M., Charalabidis, Y., Zuiderwijk, A.: Benefits, adoption barriers and myths of open data and open government. Inf. Syst. Manag. 29(4), 258–268 (2012)
Grimmelikhujsen, S.G., Meijer, A.J.: Effects of transparency on the perceived trustworthiness of a government organization: evidence from an online experiment. J. Public Adm. Res. Theor. 24(1), 137–157 (2014)
Kulk, S., Loenen, B.V.: Brave new open data world? Int. J. Spatial Data Infrasruct. Res. 7, 196–206 (2012)
Meijer, A., Thaens, M.: Public information strategies: making government information available to citizens. Inf. Polity 14(1–2), 31–45 (2009)
Zuiderwijk, A., Janssen, M.: Towards decision support for disclosing data: closed or open data? Inf. Polity 20(2–3), 103–107 (2015)
Barry, E., Bannister, F.: Barriers to open data release: a view from the top. Inf. Polity 19(1–2), 129–152 (2014)
Martin, S., et al.: Risk analysis to overcome barriers to open data. Electron. J. e-Gov. 11(1), 348–359 (2013)
Barnickel, N., et al.: Berlin open data strategy, in concept, pilot system and recommendations for action. In: 2012, Organisational, legal and technical aspects of Open Data in Berlin (2012)
Conradie, P., Choenni, S.: On the barriers for local government releasing open data. Gov. Inf. Q. S10–S17 (2014)
Uhlir, P.F.: The socioeconomic effects of public sector information on digital networks: toward a better understanding of different access and reuse policies. In: National Research Council. Washington DC (2009)
Walter, S.: Heterogeneous database integration in biomedicine. J. Biomed. Inf. 34(4), 285–298 (2001)
Zuiderwijk, A., Janssen, M., David, C.: Innovation with open data: Essential elements of open data ecosystems. Inf. Polity 19(2–3), 17–33 (2014)
Hsieh, T.-Y., Lu, S.-T., Tzeng, G.-H.: Fuzzy MCDM approach for planning and design tenders selection in public office buildings. Int. J. Proj. Manag. 22, 573–584 (2004)
Rezaei, P., et al.: Application of Fuzzy Multi-Criteria Decision Making Analysis for Evaluating and Selecting the Best Location for Construction of Underground Dam. Acta Polytech. Hung. 10(7), 187–205 (2013)
Zadeh, L.A.: The concept of lingustic variable and its application to approximate reasoning. Inf. Sci. 8(3), 199–249 (1975)
Fuller, R.: Fuzzy logic and neural nets in intelligent systems, in information system day. In: Carlsson, C. (ed.) Turku Centre for Computer Science, p. 7494 (1999)
Gupta, M.M.: Fuzzy Logic and Neural Systems. International Series in Intelligent Technologies, p. 225–244 (1995)
Werro, N.: Fuzzy Classification of Online Customers. Fuzzy Management Methods. Springer, Cham (2015)
Novák, K.: An Introduction to Fuzzy Logic Applications in Intelligent System, pp. 185–200. Kluwer Academic, Dordrecht (1992)
Kahraman, C., Onar, S.C., Oztaysi, B.: Fuzzy multicriteria decision-making: a literature review. Int. J. Comput. Intell. Syst. 8(4), 637–666 (2015)
Chen, S.-J., Hwang, C.-L.: Fuzzy Multiple Attribute Decision Making. Lecturer Notes in Economics and Mathematical Systems, vol. 375. Springer, Berlin (1992)
Hancerliogullari, G., Oymen, K.H., Koksalmis, E.: The use of multi-criteria decision making models in evaluating anesthesia method options in circumcision surgery. BMC Med. Inf. Decis. Mak. 17(14) (2017)
Lin, C., Twu, C.H.: Fuzzy MCDM for evaluating fashion trend alternatives. Int. J. Cloth. Sci. Technol. 24(2/3), 141–153 (2012)
Sloane, E., Liberatore, M., Nydick, R.: Medical decision support using the analytic hierarchy process. J. Health Inf. Manag. 16(4), 38–43 (2011)
Buda, A., et al.: Decision Support Framework for Opening Business Data, in Department of Engineering Systems and Services. Delft University of Technology, Delft (2015)
Luthfi, A., Janssen, M.: A conceptual model of decision-making support for opening data. In 7th International Conference, E-Democracy 2017, CCIS 792, pp. 95–105. Springer, Athens, Greece (2017)
Mohsen, D., et al.: A combined fuzzy MCDM approach for identifiying the suitable lands for urban development: an example from Bandar ABBS, Iran. J. Urban Environ. Eng. 8(1), 11–27 (2014)
Podvezko, V.: Application of AHP technique. J. Bus. Econ. Manag. 10(2), 181–189 (2011)
Saaty, T.: The Analytic Hierarchy Process Planning, Priority Setting, Resource Allocation. McGraw, New York (1980)
Kuo, M.S., Liang, G.S., Huang, W.C.: Extension of the multicriteria analysis with pairwise comparison under a fuzzy environment. J. Sci. Direct 43, 268–285 (2006)
Isselhardt, D.J., Cappuci, J.: The analytic hierarchy process in medical decision making a tutorial. Med. Decis. Mak. 1, 40–50 (1989)
Sehra, S.K., Brar, Y.S., Kaur, N.: Multi criteria decision making approach for selecting effort estimation model. Int. J. Comput. Appl. 39(1), 10–17 (2012)
Kostkova, P., et al.: Who owns the data? Open data for healthcare. Front. Public Health 4(7), 1–6 (2016)
Bøttcher, S.G., Dethlefsen, C.: Learning Bayesian Networks with R. In: Department of Mathematical Science, Vienna University of Technology, Aalborg University Denmark (2003)
Ozair, F.F., et al.: Ethical issues in electronic health records: A general overview. Perspect. Clin. Res. 6(2), 73–76 (2015)
Abernethy, A.: Real world evidence: opportunities and challenges, 2016, Flatiron Health
Teicher, M., Interviewing Subject Matter Experts, in International Cost Estimating and Analysis Association (ICEAA) (2015)
Herland, K., Hämmäinen, H., Kekolahti, P.: Information security risks assessment of smartphones using bayesian networks. J. Cyber Secur. 4, 65–85 (2016)
Acknowledgments
The Second author of this paper is very thankful to gLINK project (http://www.glink-edu.eu/) for funding part of this research work.
Author information
Authors and Affiliations
Corresponding author
Editor information
Editors and Affiliations
Rights and permissions
Copyright information
© 2018 IFIP International Federation for Information Processing
About this paper

Cite this paper
Luthfi, A., Rehena, Z., Janssen, M., Crompvoets, J. (2018). A Fuzzy Multi-criteria Decision Making Approach for Analyzing the Risks and Benefits of Opening Data. In: Al-Sharhan, S., et al. Challenges and Opportunities in the Digital Era. I3E 2018. Lecture Notes in Computer Science(), vol 11195. Springer, Cham. https://doi.org/10.1007/978-3-030-02131-3_36
Download citation
DOI: https://doi.org/10.1007/978-3-030-02131-3_36
Published:
Publisher Name: Springer, Cham
Print ISBN: 978-3-030-02130-6
Online ISBN: 978-3-030-02131-3
eBook Packages: Computer ScienceComputer Science (R0)