
Abstract
Tactile interaction on smartphones is becoming increasingly important in assistive technologies and special purpose applications. Although various tactile techniques exist, the development of effective and user-friendly tactile applications lacks design guidance. This work describes a distinct model that guides designers and developers in developing tactile interfaces on smartphones. The model has three distinct parts, namely, quantifying tactile stimuli, clustering, and tactile application experiment. We review existing techniques for processing each part and discuss their advantages and disadvantages. And we implement a tactile application on a TPad (Tactile Pattern display) phone on the basis of the design procedure of the model to demonstrate its usage. Results show that the workflow of the model can guide developers in implementing efficient tactile applications.
You have full access to this open access chapter, Download conference paper PDF
Keywords
1 Introduction
Developing effective tactile interfaces for mobile devices is challenging not because of the complexity of development and usability evaluation but because of the lack of guidelines with distinct design models for developers, such as the development of graphical user interface (GUI) and window/icon/menu/pointer (WIMP) interfaces.
The present development procedure of tactile interfaces is as follows: designing the prototype, which significantly depends on experiences; implementing the prototype; and inviting participants to use the prototype and evaluate its usability [1,2,3]. Though this method can result in a distinct usability result of the designed tactile interface, no existing guideline requires developers to follow up in the next development stage of new tactile interfaces in other fields with partially or completely identical usability results.
In this work, we aim to define a distinct model for use in developing tactile interfaces, specifically for mobile devices (i.e., smartphones), with available vibrotactile or frictional surface feedback. We summarize and review the exact procedure of designing and implementing a tactile interface. In each design step, we provide multiple choices for developers along with detailed advantages and disadvantages of methods and discuss the appropriate techniques that must be adopted in different contexts.
Finally, we develop a tactile number reading system that uses the designed procedure model to demonstrate the usage of the model.
2 Related Works
Previous works [4,5,6] introduced the working ISO (International Organization for Standardization) TC159/SC4 (WG9 Tactile and Haptic Interactions) standards for haptic and tactile hardware and software interactions, including standards related to the design and evaluation of hardware and software. These standards summarize the physical attributes of haptic devices, including force, shape, size, friction, texture, mass, hardness, temperature, orientation, location, vibration, duration, motion, and deformation. The ISO 9241-920 working draft also provides application development guidance, including applicability consideration, tactile/haptic inputs/outputs, attributes of encoding information, content-specific encoding, layout of tactile/haptic objects, and interaction. Although these standards cover all the aspects of haptic development, they are still under development, and their implementation is not yet scheduled.
Previous works [1, 7,8,9] by the same authors developed a usability evaluation framework for haptic systems. The researchers defined the evaluation in three stages: literature review and structured interview, card sorting to shortlist the usability sub-factors, and identification of relevant measures. The authors presented various factors used to measure the usability of haptic systems. Usefulness, efficiency, effectiveness, satisfaction, user preference, acceptability, and learnability were listed for discussion. These factors may be suitable for evaluating the usability of different haptic devices, such as Phantom, Haptic Master, Falcon Haptic, Force Dimension Omega, and Barrett Hand. Similarly, previous work [2] proposed a standard in three aspects for evaluating tactile/haptic system: validation of system requirements, the verification that system meets the requirements, and the usability of the system.
The focus of the current work is on vibration or programmable friction techniques for smartphones, which are available for practical use. Therefore, we not only need to enhance the usability evaluation factors and find the appropriate factors for tactile interfaces on smartphones, but also need to define workflow of the model that can guide developers in implementing efficient tactile applications.
3 Model
The tactile interface design model has three distinct parts.
-
Quantification. Providing tactile stimuli a magnitude with quantified values in a user experiment
-
Clustering. Classifying different tactile stimuli into various groups using the obtained quantified values
-
Application experiment. Applying the design using the clustered group stimuli to map different tactile information or codes and conducting a user experiment to evaluate the usability of the application.
The design model is shown in Fig. 1.

Model for development of tactile interfaces.
3.1 Quantification
The first step in the model involves quantifying various tactile stimuli into values in the user experiment. Two classical methods can be used for quantification.
-
Magnitude estimation. Users estimate the strength of individual stimuli by assigning them numbers [10, 11]. The novelty of this method lies in its capability to provide stimuli with a distinct subjective value, which can be used to cluster many stimuli into groups.
-
Pairwise comparison. This method divides candidate stimuli into different pairs, thereby allowing users to discriminate their differences. The test trails are generally substantially large because this method must compare every single stimulus with all other stimuli. The typical examples of this method are spatial period [12] and affective subjective evaluation [13].
3.2 Clustering
After the tactile stimuli are quantified, they are clustered into groups to allow users to discriminate them as different stimuli. Many clustering algorithms can be used, such as hierarchical clustering, multidimensional scaling, and spring-electrical. Hierarchical clustering is recommended for clustering ordinal data, such as data obtained from magnitude estimation [14]. Multidimensional scaling is appropriate for measuring dissimilarity to derive a perceptual space [15]. The spring-electrical method works well for sparse incidence matrices [16].
3.3 Application Experiment
In the last step, the clustered groups of tactile stimuli are adopted to design tactile codes and enhance feedback with GUI or tactile notification applications. After the application is implemented, the final usability of the design must be evaluated in user experiments. A typical procedure can generally be followed in tactile interface evaluation [16, 17]. First, the tactile interface is introduced to the users, who are then allowed to learn how to use the interface. Second, users are allowed to self-train with the design test trials. Third, an actual test session is conducted to assess the usability of the interface in terms of effectiveness, efficiency, and subjective evaluation [2].
-
Effectiveness is measured using two factors: the capability to perform the task and the number of errors.
-
Efficiency is the number of seconds consumed by participants to complete the task.
-
Subjective satisfaction is measured through the answers to a questionnaire, which covers efficiency, ease of use, and preferences.
4 Model Usage Example
We implemented a tactile application on a TPad (Tactile Pattern display [18]) phone to demonstrate the usage of the model. The application is an eyes-free tactile number reading system. To implement the application, we followed the procedure of the proposed model.
The application adopts tactile patterns to convey number information. The design must first select a group of appropriate tactile stimuli that can easily be discriminated and then assign specific meanings to these stimuli. Finally, after the application was developed, the user experiment was conducted to evaluate the design. The tactile application development usually met the procedure of the proposed model.
4.1 Quantification
First, we must find several tactile stimuli for conveying code interface. These stimuli must be easily discriminated and memorized. As described in the model, two methods can be utilized for such task: magnitude estimation and pairwise comparison methods. Our previous work [14] applied the pairwise comparison method, which resulted in considerably large test trails. Thus, in this simple example, we adopted the AME (Abstract Magnitude Estimation) method to quantify the stimuli.
Twelve undergraduate students (six male, six female) were recruited from the university to participate in the experiment. The mean age of the participants was 21.1 years (SD = 1.52; range 20–23).
Experiment Procedure: Participants were asked to sit and use their right index fingers to perform the experiment task. On the testing application interface (left side of Fig. 2), the bottom-left area displayed the 40-40 pattern, and the bottom-right area displayed the 1-1 pattern as the reference. The main area of the screen displayed the random patterns for testing. The pattern graphic was not shown during the experiment to avoid providing any visual cue that would affect the perception of patterns. In each test task, the user perceived the pattern and reported his/her estimation magnitude of the roughness strength to the experimenter for recording.

Left: TPad phone with AME test application. Right: Experiment result.
Result: The roughness of the strengths of the patterns is shown in Fig. 2(right). The roughness strengths decreased as the stripe width value increased. We obtained each stimulus strength from the AME experiment, where 1-1:91, 5-5:75, 10-10:56, 20-20:51, 30-30:42, 40-40:34.
4.2 Clustering
The subjectively quantified data from the experiment must then be clustered to convey different code information. Hierarchical clustering was used to cluster the obtained data because it is recommended for clustering ordinal data. Table 1 shows the various clustering results, which can be used in further studying the distinguishability of different patterns and the conveyed code information.
4.3 Application Experiment
As shown in Table 1, pattern 1-1 was the most distinguishable and isolated in all the clusters. In the pilot study, if we presented three or more patterns to users, then they felt difficult in remembering and identifying exact patterns. Thus, we adopted only adopt two patterns, 1-1 and 40-40, to design a tactile interface and thus improve the reliability of the tactile code perception application.
The implemented application is a tactile number reading system. The interaction scheme for tactile code perception was designed as follows:
-
Touch and slide the finger to left/right to sense the first tactile pattern presented on the device and count the sliding gesture as the number 1 action.
-
Then, move the finger to the opposite direction to sense whether a tactile pattern is still presented on the device while sliding. If a texture is presented, then count the sliding gesture as the number 2 action.
-
The left/right sliding must be continued until no tactile pattern is presented on the device. When sliding in a direction without a tactile pattern presented, the perception of a tactile code is completed. The number of sliding gestures performed with tactile texture presented is the perceived tactile code.
One example of perception procedure of Code 2 is shown in Fig. 3. On the basis of the preceding interaction paradigm and by additionally combining two tactile texture patterns (dense pattern 1-1 as D and sparse pattern 40-40 as S), numerous tactile codes could be implemented. In the present study, we adopted 10 tactile codes: D1, D2, D3, D4, D5, S1, S2, S3, S4, and S5.

Tactile code perception procedure with two types of friction patterns: (a) dense pattern, (b) sparse pattern.
On the basis of the preceding system, we then conducted a user experiment with 12 university student participants to evaluate the tactile code perception. The mean age of the participants was 20.6 (SD = 1.1).
Experiment Procedure: As described in the application experiment model, the evaluation experiment comprised three steps: learning, self-training, and actual testing. Therefore, in the experiment, we first introduced the tactile number reading interface to the users and allowed them to learn how to use such interface. Second, we allowed users to self-train with the designed test trials. Third, we conducted the actual test session to assess the usability of the interface.
The tasks of the experiment were designed such that the participants were asked to perceive the tactile code on the TPad by using sliding gestures and report it to the experimenter. Each participant went through 30 random tactile codes and filled out a questionnaire after the test. The overall experiment last about 30 min, and each participant was paid 50 yuan for participating in the experiment.
Results: The usability evaluation was measured in three aspects: effectiveness, efficiency, and satisfaction.
-
Effectiveness: all the participants completed the tasks (100% completeness), and the errors that participants reported were 9.72% (SD = 6.22).
-
Efficiency: the times for each tactile code perception are shown in Table 2.
Table 2. Mean (and SD) of times (seconds) for perception of tactile codes. -
The subjective satisfaction: user satisfaction of the system is shown in Fig. 4.
Fig. 4. 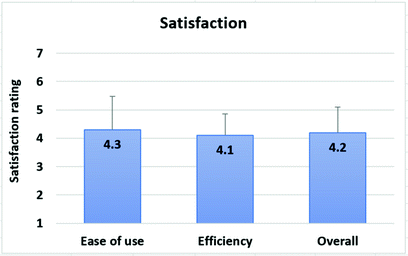
Subjective satisfaction of system.

5 Conclusion
The model is described and defined by summarizing and reviewing the exact procedure of tactile interface. Three distinct parts compose the model: quantifying tactile stimuli, clustering, and tactile application experiment. An example of designing a tactile code reading application is provided to demonstrate the usage of the model. Results show that the workflow of the model can guide developers in designing tactile interfaces efficiently. In the future, additional techniques will be reviewed and integrated into each model part to make it suitable for many types of tactile application development.
References
Khan, M., Sulaiman, S., Said, A.M., Tahir, M.: Empirical validation of usability evaluation framework for haptic systems. In: 2012 International Conference on Computer and Information Science (ICCIS), pp. 1058–1061 (2012). http://dx.doi.org/10.1109/ISVRI.2011.5759670
Sinclair, I., Carter, J., Kassner, S., Van Erp, J., Weber, G., Elliott, L., Andrew, I.: Towards a standard on evaluation of tactile/haptic interactions. In: International Conference on Human Haptic Sensing and Touch Enabled Computer Applications, pp. 528–539 (2012)
Grussenmeyer, W., Folmer, E.: Accessible touchscreen technology for people with visual impairments: a survey. ACM Trans. Accessible Comput. 9(2), 1–31 (2017). http://dx.doi.org/10.1145/3022701
van Erp, J.B., Carter, J., Andrew, I.: ISO’s work on tactile and haptic interaction guidelines. In: Proceedings of Eurohaptics, pp. 467–470 (2006)
van Erp, J.B.F., Kern, T.A.: ISO’s work on guidance for haptic and tactile interactions. In: Ferre, M. (ed.) EuroHaptics 2008. LNCS, vol. 5024, pp. 936–940. Springer, Heidelberg (2008). https://doi.org/10.1007/978-3-540-69057-3_118
van Erp, J.B.F., Kyung, K.-U., Kassner, S., Carter, J., Brewster, S., Weber, G., Andrew, I.: Setting the standards for haptic and tactile interactions: ISO’s work. In: Kappers, A.M.L., van Erp, J.B.F., Bergmann Tiest, W.M., van der Helm, F.C.T. (eds.) EuroHaptics 2010. LNCS, vol. 6192, pp. 353–358. Springer, Heidelberg (2010). https://doi.org/10.1007/978-3-642-14075-4_52
Khan, M., Sulaiman, S., Said, A.M., Tahir, M.: Classification of usability issues for haptic systems. In: 2011 7th International Conference on Emerging Technologies, pp. 1–4 (2011). http://dx.doi.org/10.1109/ICET.2011.6048455
Khan, M., Sulaiman, S., Said, A.M., Tahir, M.: Usability studies in haptic systems. In: 2011 International Conference on Information and Communication Technologies, pp. 1–5 (2011). http://dx.doi.org/10.1109/ICICT.2011.5983569
Khan, M., Sulaiman, S., Said, A.M., Tahir, M.: Research approach to develop usability evaluation framework for haptic systems. In: 2011 National Postgraduate Conference, pp. 1–4 (2011). http://dx.doi.org/10.1109/NatPC.2011.6136325
Lederman, S.J.: Tactile roughness of grooved surfaces: the touching process and effects of macro- and microsurface structure. Atten. Percept. Psychophys. 16(2), 385–395 (1974)
Strohmeier, P., Hornbak, K.: Generating haptic textures with a vibrotactile actuator. In: Proceedings of the 2017 CHI Conference on Human Factors in Computing Systems, pp. 4994–5005 (2017). http://dx.doi.org/10.1145/3025453.3025812
Biet, M., Casiez, G., Giraud, F., Lemaire-Semail, B.: Discrimination of virtual square gratings by dynamic touch on friction based tactile displays. In: 2008 Symposium on Haptic Interfaces for Virtual Environment and Teleoperator Systems, pp. 41–48 (2008). http://dx.doi.org/10.1109/HAPTICS.2008.4479912
Salminen, K., Surakka, V., Lylykangas, J., Raisamo, J., Saarinen, R., Raisamo, R., Rantala, J., Evreinov, G.: Emotional and behavioral responses to haptic stimulation. In: Proceedings of the SIGCHI Conference on Human Factors in Computing Systems, pp. 1555–1562 (2008). http://dx.doi.org/10.1145/1357054.1357298
Chu, S., Zhang, F., Ji, N., Zhang, F., Pan, R.: Experimental evaluation of tactile patterns over frictional surface on mobile phones. In: Proceedings of the Fifth International Symposium of Chinese CHI, pp. 47–52 (2017). http://dx.doi.org/10.1145/3080631.3080639
Lee, J., Han, J., Lee, G.: Investigating the information transfer efficiency of a 3 × 3 watch-back tactile display. In: Proceedings of the 33rd Annual ACM Conference on Human Factors in Computing Systems, pp. 1229–1232 (2015). http://dx.doi.org/10.1145/2702123.2702530
Prasad, M., Russell, M., Hammond, T.A.: Designing vibrotactile codes to communicate verb phrases. ACM Trans. Multimedia Comput. Commun. Appl. 11(1s), 1–21 (2014). http://dx.doi.org/10.1145/2637289
María Galdón, P., Ignacio Madrid, R., De La Rubia-Cuestas, E.J., Diaz-Estrella, A., Gonzalez, L.: Enhancing mobile phones for people with visual impairments through haptic icons: the effect of learning processes. Assistive Technol. 25(2), 80–87 (2013). http://dx.doi.org/10.1080/10400435.2012.715112
Mullenbach, J., Shultz, C., Colgate, J.E., Piper, A.M.: Exploring affective communication through variable-friction surface haptics. In: Proceedings of the SIGCHI Conference on Human Factors in Computing Systems, pp. 3963–3972 (2014). http://dx.doi.org/10.1145/2556288.2557343
Acknowledgments
This research was supported by National Natural Science Foundation of China (NSFC) (No. 61502415) and Public Projects of Zhejiang Province (No. 2016C31G2240012).
Author information
Authors and Affiliations
Corresponding author
Editor information
Editors and Affiliations
Rights and permissions
Copyright information
© 2018 Springer International Publishing AG, part of Springer Nature
About this paper

Cite this paper
Zhang, F., Chu, S., Ji, N., Pan, R. (2018). Defining a Model for Development of Tactile Interfaces on Smartphones. In: Kurosu, M. (eds) Human-Computer Interaction. Interaction in Context. HCI 2018. Lecture Notes in Computer Science(), vol 10902. Springer, Cham. https://doi.org/10.1007/978-3-319-91244-8_50
Download citation
DOI: https://doi.org/10.1007/978-3-319-91244-8_50
Published:
Publisher Name: Springer, Cham
Print ISBN: 978-3-319-91243-1
Online ISBN: 978-3-319-91244-8
eBook Packages: Computer ScienceComputer Science (R0)