
Abstract
This chapter focuses on microeconomic and macroeconomic issues. Regarding microeconomics, the key microeconomic topics, as supply, demand, product markets and factor markets, will be presented. The main microeconomic variables connected with consumer and producer behaviour will be described, including the marginal variables. Decision-making of producer and the possibilities of market equilibrium will be discussed, depending on different types of competition. Specifics of factor markets will be explained, precisely the labour market, land market, and capital market. The macroeconomic part focuses on key macroeconomic issues connected with spatial aspects. Firstly, the key macroeconomic indicators and their features will be described. Then the spatial view will be included, a comparison of selected macroeconomic indicators in EU28 and NUTS2 regions will be presented. The question of economic growth will be discussed. The last part of the chapter deals with economic modelling, both in microeconomic and macroeconomic areas. The short overview of possibilities of modelling strategic behaviour of particular economic subjects and agent-based modelling, as well as options of macroeconomic modelling in a short period (I-O analysis), medium period (CGE models) and long-term models will be presented. The spatial view in the whole chapter is underlined.
You have full access to this open access chapter, Download chapter PDF
Keywords
- Supply
- Demand
- Market
- Consumer
- Producer
- Decision-making
- Macroeconomic indicators
- Economic growth
- Economic modelling
1 Methods in Microeconomics
1.1 Microeconomics and Relationships Between Variables
1.1.1 Microeconomic Issues
Microeconomics studies individual prices, quantities and markets, on the other hand macroeconomics studies the behaviour of the economy as a whole. It examines the forces that affect firms, consumers and workers in the aggregate.
Regarding variables, microeconomics can examine for example price, quantity, hours worked, acres of land, incomes in currency units, number of employees, etc. A functional dependency between two variables exists in the case when one variable depends on the other variable, that is, the value of the dependent variable is determined by the independent variable. For example, the price (independent variable) determines the quantity of goods we buy (dependent variable).
In general, it can be stated that there are three possible types of relationships between variables:
-
direct - a positive relationship expressing that the growth of one variable is accompanied by the growth of the other variable (e.g., the price and the offered quantity = the supply function),
-
indirect - a negative relationship expressing that the growth of one variable is accompanied by the simultaneous decline of the other variable (e.g., the price and the demanded quantity = the demand function),
-
neutral - mutual independence of variables, this means that the growth of one variable does not cause a change in the other variable.
Every society must answer three basic economic questions:
-
What should we produce?
-
How should we produce it?
-
For whom should we produce it?
Although every society answers the three basic economic questions differently, in doing so, each confronts the same fundamental problems: resource allocation and scarcity. The classical microeconomic theory was developed by Adam Smith in 1776 and later economists, such as David Ricardo. The essential aspect of the classical microeconomic theory includes determination of market price and output and market-equilibrium. Adam Smith is well known for his ‘invisible hand of the market.’ In his approach, people act out of self-interest and markets tend to provide goods and services which are demanded by the population. Market forces respond to changes in demand and supply, e.g. a shortage pushes up the price and causes demand to fall.
Smith also investigated topics such as the division of labour, specialisation and economies of scale. The early classical economists emphasised the importance of costs to firms and consumers. The following sections will focus on these topics more in detail.
1.1.2 Economic Circle, Economic Entities, Different Kinds of Markets
One of the main basic models in economics is the circular-flow model, which describes the flow of money and products throughout the economy in a very simplified way. The model represents all of the actors in an economy as either households or firms (companies), and it divides markets into two categories:
-
markets for goods and services (product markets)
-
markets for factors of production (factor markets)
Product market represents the marketplace in which final goods or services are offered for purchase by consumers, businesses, and the public sector.
Factor market represents the marketplace for the services of a factor of production. A factor market facilitates the purchase and sale of services of factors of production, which are inputs like labour, capital, land and raw materials that are used by a firm to make a finished product.
The circular flow model is shown in Picture 5.1.

The circular-flow model. (Source: Own processing, based on Samuelson and Nordhaus 2010)
Consumers buy goods and sell factors of production, businesses sell goods and buy factors of production. Consumers use their income from the sale of labour and other inputs to buy goods from businesses, businesses base their prices of goods on the costs of labour and property. Prices in goods markets are set to balance consumer demand with business supply; prices in factor markets are set to balance household supply with business demand.
1.1.3 Resources, Scarcity
Production factors are natural, human, financial and other resources that enter into production and help to create the final economic output. They are scarce since the amount of these factors is limited. We can understand the production factors as resources, which are transformed in the manufacturing process into the desired products and services. In other words, the elements of production are the inputs, which the firm uses to produce output desired by consumers and to deliver this output to the market.
The factors of production include:
-
labour,
-
land and natural resources (raw materials),
-
capital (financial capital, machinery and tools, equipment),
-
the level of technology (level of knowledge), or entrepreneurship.
The demand for a given input is the so-called derived demand, that means the demand for the goods, which is produced using the given input.
The market of production factors is the point at which the demand for factors of production meets with the supply of factors of production. The demanders in this market are the firms, that - via the use of production factors - offer on the final product market a specific product to achieve profit. The suppliers on the market of production factors are the households, i.e. the owners of the factors of production. These households then rent out these factors to get income.
Scarcity means that resources (production factors) are limited, and hence the number of manufactured goods cannot satisfy all human needs. The category of needs is very broad; however, economics does not address its scope, structure and classification. Within economic theory, only economic needs that are satisfied by using up produced goods and services are relevant. The essence is to satisfy the sense of lack of something that is desirable for the consumer and the fact that the overall satisfaction is never found, as the fulfilment of a need arises the additional one, as well as both the intensity of a need and the hierarchy of needs vary, etc. Satisfying needs is related to the concept of consumption. Consumption of economic goods leads to the satisfaction of the human economic needs, provided that these goods are useful, i.e. able to satisfy the need of the consumer.
1.1.4 Why Are Marginal Variables Important?
In neo-classical economics, more emphasis was placed on concepts of marginal utility and marginal cost. We make choices depending on satisfaction we get from one extra unit of a good. Economists such as Carl Menger, William Stanley Jevons, Marie-Esprit-Léon Walras and Alfred Marshall developed ideas such as diminishing marginal utility.
Focusing on consumer issues, we can find as an example marginal utility; it denotes the additional utility consumer obtains from the consumption of one additional unit of a commodity.
The marginal utility is the change in the total utility that is caused by the change of a consumed quantity of goods by a unit.
Regarding producer, a typical example is a marginal product, the extra output produced by one additional unit of one input while other inputs are held constant, or marginal cost of production, the additional cost incurred in producing one extra unit of output.
1.1.5 Market Equilibrium – Product Markets, Factor Markets
Market equilibrium, also known as the market clearing price, refers to a perfect balance in the market of supply and demand, i.e. when supply is equal to demand. When the market is at equilibrium, the price of a product or service will remain the same, unless some external factor changes the level of supply or demand. According to economic theory, in a market economy, there is a single price which brings demand and supply into balance – the equilibrium price.
Product Markets
We can understand the market equilibrium as a state where either the supplier or the buyer had, at the given equilibrium price and quantity, any interest in changing their behaviour. In the case of Market equilibrium, quantity demanded equals quantity supplied and there is no tendency for the price to rise or fall - the equilibrium price is the market-clearing price. Table 5.1 shows an example of a market equilibrium, using a numerical expression of the market clearing price setting on the market.
Figure 5.1 shows the same example of the market clearing price using the graphical expression. The quantity demanded connected with retail price is represented by the demand curve, the quantity supplied by the supply curve. The equilibrium price Pe (17,500 EUR) shows the market clearing price where the supply is equal to the demand (500 cars).
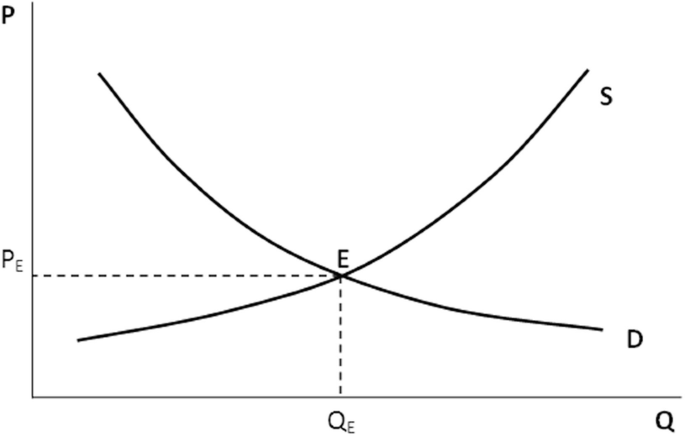
Example of market equilibrium using graphical expression. (Source: Own processing based on Samuelson and Nordhaus 2010; P price, Q quantity, S supply, D demand, E equilibrium, Pe equilibrium price, Qe equilibrium quantity)
Price elasticity is a crucial methodological approach in economics. Generally, the price elasticity of demand for some product is a sensitivity of consumers to a price change. There are some products like meat or fruits for which small change in price causes a great change in the quantity purchased. So, the demand for such products is elastic. But, there are other products (electricity, medical devices) for which the large price change causes the small change in the quantity purchased. Thus, the demand for such products is inelastic. We use the coefficient of price elasticity of demand EDP, to determine whether the demand is elastic or inelastic:
There can be three cases: if |EDP| < 1, then demand is inelastic; if |EDP| > 1, then demand is elastic and, finally, if |EDP| = 1 we can observe the unit elasticity. The slope of demand curves can be different from our basic case, presented in Fig. 5.1; therefore Fig. 5.2 shows the selected examples of particular demand curves, including the boarder elastic and inelastic demand curves.

Examples of price elacticity of demand. (Source: Own processing based on Samuelson and Nordhaus 2010; P price, Q quantity, D demand, EDP coefficient of price elasticity of demand)
Factor Markets
On factor markets, companies represent demand side and households represent supply side. The demand for factors of production depends on the demand for final products. Therefore, the demand for a given input is also called derived demand. This is derived from the demand for the goods, which is produced using the given input.
Particular factor markets are characteristic by specific market prices, as follows:
-
Labour market: the price of labour is the wage rate (w), for example, the amount of money for one hour of work.
-
Land market: the price of land is the rent (r), for example, the amount of money for one hectare of land.
-
Capital market: the price of capital is the interest rate (i), for example, the amount of money for one machine hour. The firm can compare the price of capital to the interest rate it could gain from the money spent on the purchase of the capital goods if it had put it in a bank. The interest rate thus represents the alternative cost of the ownership of the capital goods.
Regarding spatial aspects of particular production factors, we will focus on more details of the land market and labour market.
Land Market
The land market is characteristic by a fixed supply of land and a rent, as a price of land. Generally, some goods or productive factors are entirely set in amount, regardless of price. Nature’s original endowment of land can be taken as fixed in amount. Giving the quantity supplied is constant at every price, the payment for the use of such a factor of production is called rent or pure economic rent.
When supply is independent on price, the supply curve is vertical in the relevant region. Figure 5.3 shows the case of land, for which a higher price cannot coax out any increase in output. An increase in the demand for this fixed production factor will affect only the price of this production factor.
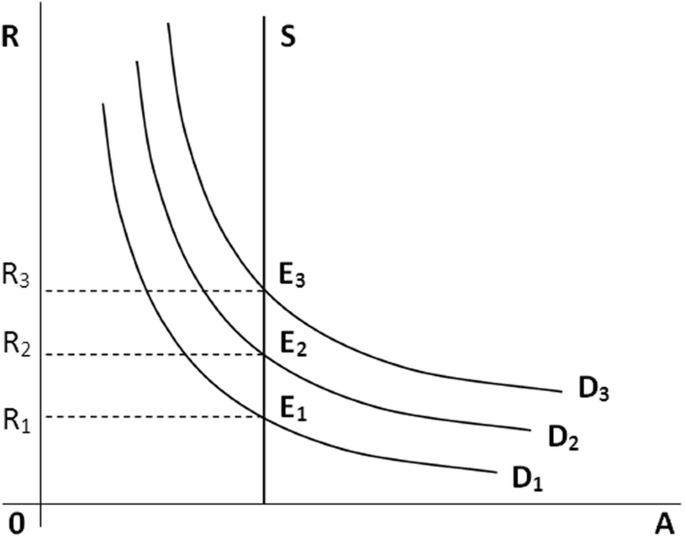
The land market equilibrium. (Source: Own processing based on Samuelson and Nordhaus 2010; R1, R2, R3 represent the price of land – the level of rent. D1, D2, D3 represent the level of demand)
It is important to underline the spatial aspect of land price; there can be observed differences in land price in particular regions, depending on the level of demand for some particular sort of land. In areas with a better economic situation, the demand is higher. In poor countries, the demand for the same sort of land will be probably lower.
Labour Market
The demand for labour is determined by its marginal productivity in producing final output. The marginal productivity of labour can rise in the following cases:
-
workers have more or better capital goods to work with,
-
the marginal productivity of better-trained or better-educated workers is higher than that of workers with less “human capital.”
Real wages differ among countries, Table 5.2 shows the example of wages in manufacturing in the year 2006.
Labour costs differ among countries, Picture 5.2 shows the overview of estimated hourly labour costs in EUR in EU countries in the year 2017. The labour costs cover both wages and salaries costs and other costs.

Comparison of hourly labour costs in EU countries in 2017. (Source: EUROSTAT 2018)
The spatial view can also include migration. The critical aspect is the character of immigrants if they are legal immigrants or political refugees, their skills and education. From the point of view of labour supply, the overall effect of immigration can be an increase in the supply of low-skilled workers relative to high-skilled workers. Studies have estimated that this change in supply has contributed to the decline in the wages of less-educated groups relative to the college-educated.
1.1.6 Competition
We can distinguish two key categories of competition within the economy.
The first one is perfect competition. It represents the case, where no firm or consumer can affect prices. Imperfect competition exists whenever a market, hypothetical or real, violates the abstract tenets of neoclassical pure or perfect competition. Since all real markets exist outside of the plane of the perfect competition model, each can be classified as imperfect. The contemporary theory of imperfect versus perfect competition stems from the Cambridge tradition of post-classical economic thought.
The second one is imperfect competition. It represents the case where a buyer or seller can affect a good’s price. Regarding companies, we can distinguish the following cases:
-
Monopoly: a single seller with complete control over an industry.
-
Oligopoly: a few sellers, each firm can affect the market price.
-
Monopolistic competition: a large number of sellers produce differentiated products; there are many sellers, none of whom has a large share of the market.
Selected examples of demand curves of different kinds of imperfect competition are shown in Fig. 5.4.

Examples of imperfect competition. (Source: Own processing based on Samuelson and Nordhaus 2010; P Price, Q Quantity, D Demand, MC Marginal Costs, AC Average Costs
Generally, curves of marginal costs (MC) and average costs (AC) represent individual company’s costs in the market; on the contrary, demand curve (D) represents the whole market demand. Consequently, the company – monopolist is a price maker in the market, the company in the monopolistic competition is rather a price taker in the market.
1.2 Decision-Making Issues
1.2.1 Decision-Making of Consumer
The behaviour of both individuals and economic entities can be explained by comparison of the effects of economic activity and a “detriment” (expenses, costs) associated with this activity. In the case of individuals, the utilities resulting from the consumption of individual goods are the effect; the “detriment” is connected to spending the incomes to purchase these goods.
The concept of utility was developed by philosophers/economists – Jeremy Bentham and John Stuart Mill. In microeconomic theory, it was believed a consumer would buy goods depending on the marginal utility (satisfaction) they get from the good. This theory assumes consumers are rational and seeking to maximise the satisfaction they get. Rationally acting consumers maximise the utility. Making decisions, however, is limited by their income. At the same time, utilities are influenced by consumer preferences.
The starting point for the consumer theory is a consideration that an individual chooses from different consumer goods baskets. The result of consumer decision-making is then the choice of such a consumer basket that brings the maximum utility. Consumers compare individual consumer situations from the perspective of their preferences.
Since the development of the utility theory, economic theory faces the problem of how to measure the utility and whether it is measurable. Based on an approach to the utility measurability, we distinguish cardinal and ordinal theory. In both cases, the utility of one good depends not only on its quantity but also on the quantity of other goods.
Cardinal theory considers the utility to be directly measurable. In this case, specific values of the utility are known. The total utility (TU) represents the total satisfaction received from consuming a given total quantity of a commodity. Marginal utility (MU) denotes the additional utility you get from the consumption of an additional unit of a commodity.
Since the total utility is dependent on the quantity of all goods, in unaltered conditions, the utility is the function of the number of goods consumed:
where X1, X2, …, Xn are quantities of individual goods.
According to the ordinal theory, the utility is not directly measurable. Consumers can say what their preferences are, but not to assess the utility. Consumers are able to arrange combinations of goods according to their utility, but not to determine the amount of the utility of such combinations. The curves showing combinations with the same utility are called indifference curves.
When deciding on the purchase of goods, however, consumers are limited by their income and the prices of the products they buy.
Budget line is indicating the combination of commodities X and Y that a consumer can buy with a given income at a given set of prices.
Consumer Optimum
Consumers choose optimal combinations of goods depending on their preferences and market options. These options are affected by both their income and market prices of goods. The way of determining the consumer optimum depends on the possibility to measure the utility.
Rationally acting consumers maximise the utility within their budgetary constraints. Consumer surplus is the difference between the total utility of the consumed quantity of a given good and the total amount spent on it.
1.2.2 Decision Making of Producer
Corporate behaviour is limited mainly by the technological possibilities of production and financial capacity of a firm.
To be able to analyse the decisions of a firm, whose main activity is the transformation of inputs into an output, i.e., production, it is useful to create an abstract model of production depicting the relations between input and output as simply as possible. The production function serves as this model. The production function is a relation between the number of inputs used in production in a given period, and the maximum volume of output the inputs created by their functioning in the given period.
The inputs used in production are labour, land, capital and the entrepreneurial spirit. We can simplify the real situation and assume that goods X are being produced (with the output labelled Q) from two inputs - capital (K) and labour (L), sufficient for the realisation of X. Same as with the production of goods which is considered to be the flow of output, inputs are also considered to flow in the production process.
-
K/t = machine hours per time,
-
L/t = hours worked per time.
After these simplifications, we can write the production function in the following form.
where Q = output, K = input of capital per time, L = input of labour per time. A production function defined this way has the following properties:
-
(a)
expresses the fact that an output can be produced through different combinations of inputs,
-
(b)
shows the technological constraints of production, because it depends on the level of technology,
-
(c)
does not work with unnecessary or inefficient production processes, which stems from the emphasis on maximum output in the definition, i.e., firms use the most efficient combination of inputs to create output.
If a firm uses the most efficient technology available, its output will depend mainly on the number of inputs used and the efficiency of their use.
Time horizon in which a firm operates is also essential for the further analysis of corporate behaviour. Short run (SR) is characterised as a period in which the services of at least one factor of production a firm uses are fixed as a result of previous choices. In the case of two factors of production, capital is considered to be the fixed input, because it physically exists, for instance in the form of machinery, which is fixed at a specific location. A firm can own it or lease it but cannot change its volume in order to change the output. On the other hand, the volume of labour involved in the production process can be easily reduced or increased if necessary, usually through short-term employment contracts. We, therefore, consider labour as a variable input in the short run.
Since there is at least one fixed input, in our case capital, in the short run, the relation between input and variable output at a given level of capital is characterised by a short-run production function. In other words, it shows how the output changes as a result of changes in one input - labour. That means that the returns from only one variable factor of production are the property of the production function in the short run.
Long run (LR) is a period sufficient for the change in the amount of all inputs used, i.e., it is characterised by the fact that all inputs are variable. In the long run, the firm can mutually substitute the two inputs we use. A long-run production function depicts the relation between the change in volume of both inputs used and the subsequent change in output. If we focus only on the currently proportionally equal increase in the amount of all inputs and the change in output in the long-run production function, we deal with returns to scale. The essential characteristics of a production function in the long run, therefore, are the substitution of inputs and return to the scale of input.
1.2.3 Costs Overview
Total costs represent total expenses needed to produce output. In most cases, the total costs increase together with the increase in output. Total costs (TC) in the short run are the sum of fixed costs (FC) and variable costs (VC):
Fixed costs represent expenses that are paid out even when no output is produced; unaffected by any variation in the quantity of output. Variable costs represent expenses that vary with the level of output - such as raw materials, wages, and fuel - and includes all costs that are not fixed. If the output is zero, variable costs are zero as well. The development of variable costs is a significant element for the development of total short-run costs.
-
Opportunity costs (alternative costs) - assuming the best choice is made, it is the “cost” incurred by not enjoying the benefit that would have been had by taking the second best available choice.
-
Marginal costs (MC) shows additional costs connected with the production of one extra unit of output.
-
Average costs AC (unit costs) represent the sum of total costs (TC) divided quantity (Q):
The Costs of a Firm
Before we analyse the costs, recall the difference between the economic and accounting concept of costs. In the narrower sense - accounting - costs are all actual costs incurred the movement of which is recorded in the accounting books. These are the explicit costs. The economic concept of costs is broader: economists take into account not only explicit costs but also implicit costs. Implicit costs are costs that the firm does not actually pay. The existence of these is based on the principle of alternative costs, i.e., opportunity costs. Implicit costs represent the costs the firm loses by using limited resources in a certain way and not any other. For better understanding, let’s have a look at the specific differences between accounting and economic concept of costs of labour and capital (inputs used in our analysis).
The costs of labour do not differ much as an accounting and economic concept: both approaches consider these to be explicit costs. From an accounting perspective, these form a part of the actual costs incurred. From an economic perspective, the costs of labour are derived from the wage rate, which forms a part of the employment contract. It is assumed that this wage rate is the same as the best alternative return of this input for its owner.
Costs of capital are perceived completely differently by accountants and economists. From the accounting perspective, the costs of capital are determined by the price of the capital goods which is used for determining the concrete share of capital costs on the costs of a given output. These are thus the actual, explicit costs incurred. Economists, however, consider the costs of capital to be implicit; their amount per hour is determined by the price anyone would be willing to pay for using the given capital goods if he/she rented it for an hour. The firm thus loses the alternative return from renting the capital goods to someone else, i.e., the rent, because it is the only subject using the capital goods. The costs of capital are thus determined by the amount of rent based on the nest alternative usage of the given capital goods.
When analysing the costs, we use the simplified situation in which the firm produces only goods X and uses only two inputs for the production, the prices of which do not change with the quantity purchased (in other words, we assume that there is perfect competition on the market of labour and capital). Substantial simplification is the assumption of a completely homogeneous labour and completely homogeneous capital. Speaking of the prices of inputs, remember that these are considered to flow in the production process. Based on what has already been said about the costs of labour and capital:
-
the price of labour is the wage rate (w), the amount of money for one hour of work,
-
the price of capital is the rent (r) corresponding to the amount of money for one machine hour.
The firm can compare the price of capital to the interest it could gain from the money spent on the purchase of the capital goods if it had put it in a bank. The interest thus represents the alternative cost of the ownership of the capital goods.
The starting point for the analysis of costs is the functional relationship between the costs and the output per unit of time. Since we know that the amount of output is a function of the inputs used and if we know the prices of the inputs used by the firm in the production process, we can calculate the costs of production of a specific output. The level and development of the costs due to changes in the output of the firm thus depend on two important factors:
-
1.
The character of the production function in question (which determines the shape of the cost functions of the firm),
-
2.
The prices of inputs (these determine the costs).
A cost function can be expressed as:
If we assume that the firm behaves rationally, this cost function expresses the minimum costs of a firm for the production of various amounts of output, using various combinations of labour and capital.
The character of costs in the short run is different in many ways from the character of costs in the long run. Since the firm cannot increase the output in the short run by changing the production premises or the technologies used, it can increase it only by changing the variable inputs used to be able to change the output by increasing the amount of any input.
1.3 Market Failures
Neo-classical economics has become associated with a belief in the efficiency of markets. The microeconomic theory has also incorporated the criticisms and limitations of free-markets. The obstacles that prevent the price mechanism from the efficient allocation of resources are described as “market failures”. A perfectly functioning market mechanism can be described by both the demand side and the supply side provide objective information on the market situation. The carrier of this information is the price that is created at the market. In the real economic world, there are plenty of obstacles of perfect competition that can cause market failures. The most important of these may be classified as the following:
-
imperfect competition,
-
externalities,
-
public goods and
-
imperfect information.
Imperfect competition and its features is described above in the Sect. 5.1.1.6. Competition.
Externalities occur when a firm or people impose costs (negative externalities) or benefits (positive externalities) on others outside the marketplace. Negative externalities occur when production and/or consumption impose external costs on third parties outside of the market for which no appropriate compensation is paid, for example:
-
Harmful impact of toxic ‘passive smoking’ on non-smokers
-
Air pollution from road use and traffic congestion and the impact of road fumes on lungs
-
The external cost of food waste
-
The external costs of cleaning up from litter and the dropping of chewing gum
-
The external costs of the miles that food travels from producer to the final consumer
Public goods are commodities, which can be enjoyed by everyone and from which no one can be excluded. Public goods provide an example of market failure resulting from missing markets. Pure public goods are non-excludable and non-rival in consumption. Public goods are also known as collective consumption goods, for example, police, defence, crime control, sanitation infrastructure.
Regarding spatial view, it can be interesting to observe the spatial distribution of market failures in the economy. Good examples can be the distribution of monopolist or oligopolist power in EU countries or the whole World, the distribution of negative externalities and negative environmental impacts on a local, regional, national and global level or different placement of public goods within the society and particular countries/regions.
2 Macroeconomics and Relationships Between Variables
2.1 Macroeconomic Issues
2.1.1 General Macroeconomic Model
Macroeconomics studies the behaviour of the economy as a whole. The following Picture 5.3 shows relationships between particular markets and economic subjects – resource market, product market, households, companies and government.

A general macroeconomic model. (Source: Own processing, based on Samuelson and Nordhaus 2010)
A macroeconomic model is an analytical tool designed to describe the operation of the economy of a country or a region. These models are usually developed to examine the dynamics of aggregate quantities such as the total amount of goods and services produced, total income earned, the level of employment of productive resources, and the level of prices.
Macroeconomic models may be logical, mathematical or computational; the different types of macroeconomic models serve different purposes and have various advantages and disadvantages. Macroeconomic models may be used to clarify and illustrate basic theoretical principles; they may be used to test, compare, and quantify different macroeconomic theories; they may be used to produce “what if” scenarios (usually to predict the effects of changes in monetary, fiscal, or other macroeconomic policies); and they may be used to generate economic forecasts. Thus, macroeconomic models are widely used in academia, teaching and research, and are also widely used by international organisations, national governments and larger corporations, as well as by economics consultants and think tanks.
Households (individuals) behave rationally, and therefore they do not spend their entire income to purchase goods and services. The remaining part of their income they save as they assume that in the future their savings (S) will bring additional higher income.
Firms (businesses) set their business objectives and to meet them, they need additional funds to renew or expand their production, which means that they need to get a loan for purchasing the means of production. This leads to the need for creating a financial market (see Picture 5.4), where household savings are transformed into the investment resources of firms. The transformation of household savings into the investment resources of firms has two forms:
-
1.
Households save their savings in financial institutions (primarily banks), which provide loans to businesses. The money market mediates the relationship between households and firms.
-
2.
Households use their savings to purchase securities issued by firms and therefore directly, without the intermediary role of banks, provide firms with the necessary investment funds. In this case, the relationship between households and firms is mediated by the securities market.

Model of the macroeconomic cycle including a financial market. (Source: Own processing, based on Samuelson and Nordhaus 2010)
Household spending on goods and services, i.e. consumption expenditure (C) is supplemented by investment spending (expenditure) of firms (I). The equality of the total income and the total product is then kept, and therefore the total (national) income and the total product are usually identified by the same symbol (letter) - Y (yield). The quantity of the total product is equal to the total expenditure (E), which was spent in the economy (Y ≡ E).
2.1.2 Macroeconomic Indicators
Basic Macroeconomic Indicators and Their Characteristics
Gross domestic product (GDP) is the measure of the market value of all final goods and services produced in a country during a year. There are two ways to measure GDP - nominal GDP is measured in actual market prices, real GDP is calculated in constant or invariant prices.
Gross domestic product (GDP) is the most frequently used measure for the overall size of an economy, while derived indicators such as GDP per capita — for example, in euro or adjusted for differences in price levels — are widely used for a comparison of living standards, or to monitor the process of convergence across the European Union (EU). Moreover, the development of specific GDP components and related indicators, such as those for economic output, imports and exports, domestic (private and public) consumption or investments, as well as data on the distribution of income and savings, can give valuable insights into the main drivers of economic activity and thus be the basis for the design, monitoring and evaluation of specific policies.
Inflation occurs when the general price level of prices is rising. We calculate inflation by using price indexes - weighted averages of the prices of thousands of individual products.
Inflation is the increase in the general level of prices of goods and services in an economy; the reverse situation is deflation when the general level of prices falls. Inflation and deflation are usually measured by consumer price indices or retail price indices. Within the European Union (EU), a specific consumer price index has been developed — the harmonised index of consumer prices (HICP). Other factors (such as wages) being equal, inflation in an economy means that the purchasing power of consumers falls as they are no longer able to purchase the same amount of goods and services with the same amount of money. Purchasing power parities estimate price level differences between countries and can be used to calculate price level indices, which may, in turn, be used as a starting point for analysing price convergence between countries or regions.
The unemployment rate is defined as the number of people who are unemployed expressed in relation to the total labour force (persons who are employed or unemployed). Focusing on the example published by EUROSTAT (2018), we can compare development in particular countries and also in the EU as a whole. At the start of the financial and economic crisis in 2008, there were 16.8 million unemployed persons in the EU-28, which gave an unemployment rate of 7.0%. Five years later — in 2013 — this figure had risen to 26.3 million unemployed persons, an overall increase of 9.5 million. The number of unemployed persons in the EU-28 fell in both 2014 and 2015, to 22.9 million (ora rate of 9.4%). As such, the total number of people who were out of work in 2015 was more than one third (36.5%) higher than at the onset of the crisis, while the unemployment rate was 2.4 percentage points higher.
The foreign exchange rate is the price of one currency in terms of another currency. The foreign exchange rate is determined in the foreign exchange market, which is the market where different currencies are traded.
Current Data vs. Constant Data
Data reported in the current (or “nominal”) prices for each year are expressed in the value of the currency for that particular year. For example, current price data shown for 1990 are based on 1990 prices, for 2000 are based on 2000 prices, and so on.
Other series in statistics can show data in “constant” or “real” terms. Constant series show the data for each year expressed in the value of a particular base year. Thus, for example, data reported in constant 2010 prices show data for 1990, 2000, and all other years in 2010 prices.
Current series is influenced by the effect of price inflation. Data reported in “constant” or “real” terms (constant series) are used to measure the true growth of a series, i.e. adjusting for the effects of price inflation. For example (using year one as the base year), suppose nominal Gross Domestic Product (GDP) rises from 100 billion to 110 billion, and inflation is about 4%. In real prices, the second year GDP would be approximately 106 billion, reflecting its true growth of 6%. Except for rare instances of deflation (i.e. negative inflation), a country’s current price series on a local currency basis will be higher than its constant price series in the years succeeding the constant price base year. (World Bank 2018).
Table 5.3 shows the example of official source of macroeconomic data published by the Ministry of Finance of the Czech Republic in 2018.
Economic Development – Different Possibilities and Expressions
A gross domestic product, GDP, is a basic measure of the overall size of a country’s economy.
As an aggregate measure of production, GDP is equal to
-
1.
the sum of the gross value added of all resident institutional units engaged in production, plus any taxes on products and minus any subsidies on products. Gross value added is the difference between output and intermediate consumption,
-
2.
the sum of the final uses of goods and services (all uses except intermediate consumption) measured in purchasers’ prices, minus the value of imports of goods and services,
-
3.
the sum of primary incomes distributed by resident producer units.
We can use different possibilities of GDP development presentation. It is possible to show GDP growth in a selected period as a % change compared with previous years or as GDP development in current or constant prices. The examples, published by EUROSTAT in the year 2018, show different GDP development presentation in China, USA, EU-28, Euro area and Japan in the period 2007–2017 (Picture 5.5 and Picture 5.6).

Real GDP growth, 2007–2017 (% change compared with previous year). (Source: Eurostat 2018)

GDP development in current market prices, 2007–2017 (billion PPS – purchasing power standard). (Source: Eurostat 2018)
The Eurostat (2018) comments the GDP development in the following way: “The global financial and economic crisis resulted in a severe recession in the EU in 2009 (see Picture 5.5), followed by a recovery in 2010. The crisis started earlier in Japan and the United States, with negative annual rates of change for GDP (in real terms) already recorded in 2008, deepening in 2009, before rebounding in 2010. By contrast, economic output in China continued to grow at a relatively rapid pace during the crisis (close to 10% each year), slowing somewhat in subsequent years, but remaining considerably higher than in any of the other economies shown in Picture 5.5.”
Cross-country comparisons are often made using purchasing power standards (PPS) which adjust values to account for differences in price levels between countries. The data shown in Picture 5.6 are in current prices and should not be used for comparisons over time because of inflation and exchange rate fluctuations.
GDP per Capita
There are also other possibilities for GDP presentation. It is suitable to show GDP per capita, for regional comparison. Inequalities that exist between different regions can be attributed to a wide range of factors, including changes brought about by globalisation (such as the relocation and outsourcing of manufacturing and service activities), the legacy of former economic systems, socioeconomic developments, geographic remoteness, and the availability of resources, including human resources.
Picture 5.7 presents the differences between GDP per capita in the years 2007 and 2017 in EU countries, published by EUROSTAT in the year 2018.

GDP per capita, current prices 2007 a 2017 (EU-28 = 100; base PPS per capita). (Source: Eurostat 2018)
Economic Growth
Economic growth is an increase in the capacity of an economy to produce goods and services, compared in the selected period. It can be measured in nominal or real prices.
Economic growth sources are represented by:
-
Increase in the number of production factors,
-
Increase of total productivity of production factors.
Extensive economic growth can be observed in the case that inputs are increasing faster than outputs. Intensive economic growth occurs when outputs are increasing faster than inputs.
Economic growth indicators are the following:
-
Economic power indicator, described by the absolute amount of final products and services in the economy. It is presented as GDP in mil. EUR or other selected currency.
-
Economic level indicator, represented by the efficiency of production. It is presented as GDP per capita.
Similarly, as in the case of GDP development, there are different possibilities of economic growth presentation. The examples, published by EUROSTAT in the year 2018, show economic power indicator (Picture 5.8) and economic level indicator (Picture 5.8). Economic power indicator (Picture 5.8) is expressed as GDP per inhabitant in PPS in relation to the EU-28 average in the year 2015, focusing on NUTS 2 regions. Economic level indicator (Picture 5.9) is expressed as a change of GDP per inhabitant in PPS in relation to the EU-28 average in the period 2007–2015, also dealing with NUTS 2 regions.

Economic power indicator. (Source: Eurostat 2018)

Economic level indicator. (Source: Eurostat 2018)
The “poorest” regions in the EU, with GDP per capita less than 75% of the EU-28 average are shown in the darkest shade of purple in Picture 5.7. On the other hand, the darkest shade of blue colour represents the “richest” regions in the EU.
Picture 5.9 shows changes in regional GDP per inhabitant relative to the EU-28 average for 2007–2016; the comparison covers the period associated with the global financial and economic crisis which has had a lasting impact on several regions. Among the multi-regional EU Member States, GDP per capita grew at a faster pace than the EU-28 average in every region of Bulgaria, Hungary, Poland, Romania, Slovakia and all three of the Baltic Member States (each of which is a single region at this level of detail), as well as every region except one in Austria and the Czech Republic. The majority of regions in Germany also recorded an increase in their relative living standards. By contrast, average GDP per capita grew at a slower pace than the EU-28 average in every region of Greece, Spain, Croatia, Italy, the Netherlands, Slovenia, Finland and Sweden, while a similar pattern was repeated in all but one region of mainland France and Portugal (Eurostat 2018).
2.1.3 State Budget Indicators and Public Finance
We can identify three essential instruments or tools that the government uses to influence economic activity:
-
1.
Taxes on incomes, goods and services. These reduce private income, and consequently decrease private expenditures (on automobiles or restaurant food) and provide resources for public expenditures (on education and healthcare). The tax system also serves to discourage certain activities by taxing them more heavily (such as smoking cigarettes) while encouraging other activities by taxing them lightly or even subsidising them (such as environmental protection).
-
2.
Expenditures on specific goods or services (such as roads, education, or police protection), along with transfer payments (like social security and contributions) that provide resources to individuals.
-
3.
Regulations or controls that direct people to perform or refrain from certain economic activities. Examples include rules that limit the amount firms can pollute, or that divide up the radio spectrum, or that mandate testing the safety of new drugs.
Fiscal policy regulates the use of taxes and government expenditures. Government expenditures come in two distinct forms. First, there are government purchases. These comprise spending on goods and services—purchases of tanks, construction of roads, salaries for judges, and so forth. Also, there are government transfer payments, which increase the incomes of targeted groups such as the elderly or the unemployed. Government spending determines the relative size of the public and private sectors, that is, how much of GDP is consumed collectively rather than privately. From a macroeconomic perspective, government expenditures also affect the overall level of spending in the economy and thereby influence the level of GDP.
The other part of fiscal policy, taxation, affects the overall economy in two ways. Firstly, taxes affect people’s incomes. By leaving households with more or less disposable or spendable income, taxes affect the amount people spend on goods and services as well as the amount of private saving. Private consumption and saving have essential effects on investment and output in the short and long run. Also, taxes affect the prices of goods and factors of production and thereby affect incentives and behaviour. Many provisions of the tax code have an important impact on economic activity through their effect on the incentives to work and to save.
2.1.4 Monetary Indicators and Monetary Policy Instruments
Regarding monetary indicators and monetary policy instruments, national banks have more possibilities. The following overview of monetary policy instruments is based on the instruments currently used by the Czech National Bank (find more in CNB 2018).
Open Market Operations
Open market operations are used for steering interest rates in the economy. Open market operations are mostly executed in the form of repo operations (based on a general agreement on trading on the financial market). Concerning their aim and regularity, the central banks open market operations can be divided into the following categories:
The main monetary policy instrument takes the form of repo tenders. The central bank accepts surplus liquidity from banks and in return transfers eligible securities to them as collateral. The two parties agree to reverse the transaction at a future point in time when the central bank as borrower repays the principal of the loan plus interest and the creditor bank returns the collateral to the CNB. The first duration of these operations is 14 days; the two-week repo rate (2 W repo rate) is therefore considered to be crucial importance regarding monetary policy.
The additional monetary instrument is the three-month repo tender. Here, the central bank accepts liquidity for a three-month period. Fine-tuning tools (foreign exchange operations and securities operations) are used ad hoc, mainly to smooth the effects on interest rates caused by unexpected liquidity fluctuations in the market. These instruments are rarely used.
Automatic Facilities
Automatic facilities are used for providing and depositing liquidity overnight. As, from the banks’ point of view, these represent standing facilities for collecting or borrowing money, the interest rates applied to them form the corridor for short-term money market rates (as well as for the two-week repo rate).
Minimum Reserves
In general, the minimum reserves are generally one of the main monetary policy instruments through which the central bank can influence the amount of liquidity (free funds) in the banking system.
The application of the reserve requirement in practice involves several areas (obliged entities, the reserve requirement rate, maintenance periods, the reserve base, fulfilment of the reserve requirement, remuneration, the reserve requirement where statements are not submitted, etc.) whose individual parameters can change flexibly, reflecting the need to react to changes in trend in the banking system.
FX Interventions
FX interventions are purchases or sales of foreign currencies against selected basic currency on the foreign exchange market. They are aimed at dampening foreign exchange market volatility and easing/tightening monetary policy. FX interventions are not a regularly used instrument in the inflation targeting regime. The standard instrument is interest rates.
Nevertheless, FX interventions may be used under certain circumstances. An example of such a situation is a reduction in monetary policy interest rates to “technical zero”, where further monetary policy easing can be achieved by weakening the selected basic currency exchange rate. The CNB faced this situation between autumn 2013 and spring 2017 when it used an exchange rate commitment to intervene on the foreign exchange market if necessary to weaken the Czech koruna to maintain the exchange rate close to CZK 27 to the euro.
2.1.5 Aggregate Demand and Supply
Aggregate demand refers to the total amount that different sectors in the economy willingly spend in a given period.
An aggregate demand curve is the sum of individual demand curves for different sectors of the economy. The aggregate demand is usually described as a linear sum of four separable demand sources:
where C is consumption, I is investments, G is government spending, NX = X (export) - M (import) is net export.
Aggregate supply refers to the total quantity of goods and services that the nation’s businesses willingly produce and sell in a given period.
In the long run, the ability of an economy to produce goods and services to meet demand is based on the state of production technology and the availability and quality of factor inputs.
The AD-AS or aggregate demand-aggregate supply model is a macroeconomic model that explains price level and output through the relationship of aggregate demand and aggregate supply. It is based on the theory of John Maynard Keynes presented in his work The General Theory of Employment, Interest, and Money. It is one of the first simplified representations in the modern field of macroeconomics and is used by a broad array of economists, from libertarian, Monetarist supporters of laissez-faire, such as Milton Friedman, to Post-Keynesian supporters of economic interventionism, such as Joan Robinson.
The conventional “aggregate supply and demand” model is a Keynesian visualisation that has come to be a widely accepted image of the theory (see Fig. 5.5). The classical supply and demand model, which is mostly based on Say’s law (supply creates its demand) depicts the aggregate supply curve as being vertical at all times (not just in the long-run).

Aggregate supply and demand model. (Source: Own processing, based on Samuelson and Nordhaus 2010; AD (AD 0, AD 1) aggregate demand, SAS (SAS 0, SAS 1, SAS 3) short-time aggregate supply, LAS long-term aggregate supply, Y product, Y∗ potential product, P price level, E (E 0, E 1, E 2, E 3) equilibrium)
3 Economic Modelling
3.1 Overview of Applied Economic Models
3.1.1 Possibilities of Economic Models
At present, many studies are dealing with predictions and modelling of the impacts of economic policy instruments. In the given area, ex-ante and ex-post analysis of the government policies impacts on the economy are discussed. We can find analysis of the government policies impacts on the economy as a whole, as well as on households, firms, sectors of the economy, the environment, macroeconomic variables, individual markets or mutual links between sectors and markets. For analysing the economic policy impacts, a wide range of both quantitative and qualitative methods has been used so far. Since appropriate tools are rarely introduced separately, the final selection of the method used depends on the required outputs.
Abstract models are the basis of understanding real systems and are used to study and predict their behaviour in a wide range of tasks of both the system analysis and system synthesis. The most widespread types of abstract models are numerical mathematical models. The analyses of particular policies and regulations impacts can be carried out with the use of macroeconomic or microeconomic models (Bork 2006). Macroeconomic models are usually based on the use of aggregated data. Simulation of changes in policies and regulatory instruments are obtained in particular by modelling economic relationships between different sectors and also by modelling their behaviour changes
On the other hand, microeconomic models (Lund 2007) are typically based on extensive data files of disaggregated data, such as family accounts or corporate accounts. These models simulate the tax impact on individual units (households or companies), and their micro-economic results can be aggregated at the macroeconomic level to estimate the effects in the context of the entire economy. The creation of a microeconomic model depends on the availability of the necessary disaggregated data (Bach et al. 2002; Bork 2006).
When modelling the macroeconomic impacts, it is necessary to distinguish the time horizon of the model. When modelling the short-term consequences, it cannot be expected that the adjustment mechanisms in the economy began to take effect (Sahlin et al. 2007). If the aim is to evaluate the short-term impacts, it is possible to ignore the medium-term adjustment mechanisms of the primary state variables (stock capital, the external position of the economy, government debt). For modelling the medium-term impacts (in 2–5 years), it is necessary, by the economic theory, to make assumptions about the effects of the dynamic adjustment mechanisms. As an example, these mechanisms can be used to specify changes in relative prices of domestic and foreign goods in the context of a cost-push shock.
Furthermore, the parameters of these mechanisms (for example, the price elasticity of exports, the possibilities of substitution in the production function, etc.) should be calibrated (i.e. numerically quantified). Economists are not consistent in this area; individual designs of macroeconomic models differ from one another. Currently, the standard macroeconomic models are for example the dynamic models of general equilibrium. In the general equilibrium model, the economy is interpreted as a system of interdependent markets. A change, which at first sight affects only one market, may, in practice, affect all markets in the economic system. The long-term modelling focuses mainly on the endogenisation of mechanisms which are in standard macroeconomic modelling considered as exogenous. It is, in particular, modelling of the induced technological progress. Today, the standard tool for such modelling is the so-called integrated assessment models (IAM).
3.1.2 Agent-Based Modelling
The optimal behaviour of particular economic entities is multicriterial and dependent on many factors. The rules of their behaviour are different depending on their individuality or on their integration into a superior economic structure.
The behaviour of economic entities is a favourite issue of particular economic, statistical and econometric models and simulations. From the time period view, there are short, medium or long-term models, both static and dynamic. Conventional econometric and statistical models fail to capture cooperation and decision-making of economic entities under conditions of a large number of businesses that try to optimise their economic situation. Conventional models cannot distinguish the differences between individual decision-making and cooperative decision-making within a superior economic structure. The real behaviour and decision making of particular economic entities can be different in the situation with or without interactions with other entities – in other words, the rules within a group of economic entities can be different than individual entity rules.
The approach, which also includes interaction rules, is called ABM - agent-based modelling. Applying agent-based modelling, the researcher explicitly describes the decision making processes of particular actors at a micro level. The structure emerges at the macro level as a result of the actions of the agents and their interactions with each other (Janssen and Ostrom 2006).
The modelling based on the agent-based modelling or complex multiagent modelling has been historically used mainly in the field of engineering and information sciences; however, the importance of this kind of models has been rapidly increasing in the economic sciences and management. It is visible mainly in the area of financial markets management, corporate management, water management, waste management, land management, transportation and energy sources management.
A simple multiagent economic system can be based on the basic economic entity – the broker – with the only goal – the profit. Therefore we should mention scientific studies based on financial markets - for example agent-based model with multi-level herding for complex financial systems (Chen et al. 2015), consentaneous agent-based and stochastic model of financial markets (Gontis and Kononovicius 2014), agent-based double auction markets (Cai et al. 2014) and synthesis of agent-based financial markets and New Keynesian macroeconomics (Lengnick and Wohltmann 2013).
Regarding interesting studies in management, there should be mentioned mainly multi-agent systems for the simulation of land-use and land-cover change (Parker et al. 2003), ecosystem management (Bousquet and Le Page 2004), urban traffic management and planning (Fiosins et al. 2011) or energy management (Lagorse et al. 2010).
There are also studies focused directly on multiagent models connected with climate change or carbon emissions reduction, for example, the study focused on estimating the impacts of climate change policy on land use (Morgan and Daigneault 2015) and exploration of the carbon emissions trading scheme in China (Tang et al. 2015).
Companies can mutually cooperate and coordinate their behaviour and their targets in the area of carbon emission reduction and costs optimisation. After selection of representation and formalisation of the agent’s behaviour and relationships between particular agents, it is necessary to design new methods for investigating their behaviour. It is possible to study not only the behaviour of the individual agents, but also the behaviour of the groups of agents, or even of the whole economic system. It will allow us to identify cooperation, coordination and joint actions. It also offers the use of cognitive analysis within the multi-agent system. A multi-agent system (MAS) can be defined as a group of connected autonomous systems (agents), cooperating to achieve a common goal – in our case the maximal decrease of carbon emissions with the minimal costs. Activities of particular agents are based on the principles of cooperation, coordination and optimisation of their behaviour to achieve both individual and global goals. Particular agents can influence their behaviour to each other; their activities may be carried out by the others or merely avoid interfering with the work of the others. However, they may also act against others. For MAS creating, there are available the following types of agents: cooperative agents - they have common goals; competitive agents – they have conflicting goals, and agents displacing each other.
For multiagent model creation, particular agents must be placed into the structure of the multiagent system, which is also associated with a precise definition of mutual relations and hierarchies. Defined links will also serve as the communication channels for sending the messages - the type of ACL.
Both adaptation and learning can be designed for the following three levels: the level of the agent, the level of groups of agents and the global level.
A multi-agent system (MAS) can be defined as a group of connected autonomous systems (agents), cooperating to achieve a common goal. Activities of particular agents are based on the principles of cooperation, coordination and optimisation of their behaviour to achieve both individual and global objectives. Particular agents can influence their behaviour to each other; their activities may be carried out by the others or simply avoid interfering with the work of the others. However, they may also act against others. For MAS creating, there are available the following types of agents: cooperative agents - they have common goals, competitive agents – they have conflicting goals and collaborative agents - displacing each other.
MAS will be performed in the specific conditions of economic systems. From this perspective, the important characteristics of particular agents can be examined, precisely their autonomy (the ability to achieve their objectives without outside interference, ie. their interaction with the environment), reactivity (the ability to continuously respond to changes in the environment), intentionality (the ability to think about their long-term objectives) and social intelligence (the ability to communicate with other agents). Particular attention will be focused on deliberative agents (intentional and intelligent), whose behaviour is approaching the autonomous behaviour of humans. This kind of agent has its symbolic representation of the external environment, which is implemented in the form of knowledge base assertions about the world and enables him to realize rational and purposeful behaviour.
The multi-agent system is based on the following procedures:
-
1.
Communication - the process, which is a crucial base for cooperation and coordination. The communication is a process during which the two or more agents exchange information in the form of simple communication messages in the appropriate language.
-
2.
Cooperation – the process, when particular agents negotiate to solve their problems or conflicts. Precisely, it is a process of achieving goals. The management of negotiating agents can be centralised or decentralised. The role of each agent within the MAS has to be precisely defined.
-
3.
Coordination – the process, when the limited resources and tasks are divided to particular agents in such way, that the whole behaviour of the system is both effective and economical and the system optimises the way for the optimal output achieving. This communication process results in a rational way of the behaviour of the whole system.
-
4.
Emergence - the process of spontaneous formation of macroscopic characteristics and structures of complex systems, which cannot be derived from the characteristics of their components. Associations of particular agents and their mutual interactions can lead to emergent behaviour, which can positively affect the behaviour during the evolution of the system.
The solution of cooperation and coordination procedures will use specific characteristics of particular agents, such as the possibility of their complex, nonlinear or discontinuous behaviour and interactions, in which the role is represented by the spatial and social structure. It is obvious that it is not possible to predict precisely the future on the base of historical development, due to external disturbances and different levels of information available to particular agents. Therefore each agent uses learning ability and both behaviour adaptations and modifications. An essential aspect of the solution is represented by the purposeful optimisation of individual agents’ decision-making in conditions of uncertainty, unexpected changes and disturbances. Particular agents will be based on the expert models, which will consist of the set of rules of behaviour.
3.1.3 Input - Output Models
The adjustment mechanisms in the economy cannot be expected during modelling of short-term impacts. Focusing on the main objective of the analysis (short-term impacts), it is possible to ignore the medium-term adjustment mechanisms of the following variables: capital stock, external position of the economy, government debt. In this case, a so-called structural analysis also referred to as the input-output table analysis, is a useful tool. This analysis makes it possible to predict short-term measures of economic policy or exogenous shocks to individual sectors and individual types of households in the economy. Fundamentals of structural analysis were formulated in 1936 by Nobel Prize economist Vasili Leontief. He was inspired by two theoretical bases: the neoclassical theory of national economic equilibrium and the principles of compiling national economic balances. Theoretical conclusions have been demonstrated by a detailed analysis of the US economy in the years 1919, 1929 and 1939 (Leontief 1966).
The structural analysis represents a set of models and methods that serve to find an equilibrium solution for a particular economic system. An equilibrium solution means a solution that presupposes the balance of resources and the needs of this system. Under the economic system, we can understand the national economy and particular interconnected sectors of the national economy.
The input-output method is an adaptation of the neoclassical theory of general equilibrium to an empirical study of quantitative interdependence between different economic sectors. Initially, this method was developed to analyse the relationships between production and consumer sectors within the national economy but was also applied to the study of smaller economic systems such as a region or even for a private enterprise. The analysis is also used to identify international economic relationships (Leontief 1966).
Regardless the purpose of input-output analysis, the concept is essentially the same - a series of linear equations are describing the dependence between the different sectors of the national economy and then their specific structural characteristics are reflected in the numerical expression of the coefficients to these equations. Coefficients must be determined empirically. In the analysis of the structural characteristics of the national economy, they are usually determined from statistical input-output tables.
This kind of analysis enables to predict the short-term impacts of economic policy measures, or exogenous shocks, on individual sectors of the economy. Input-output tables are suitable for the description of the relationships between particular sectors of the national economy. It makes it possible to analyse not only the direct impacts on these sectors (for example, the impact of new taxation) but also the “second order” effects between the different sectors.
3.1.4 General Equilibrium Models - CGE
To model medium-term impacts (2 to 5 years), it is necessary to make assumptions about the effects of dynamic adaptation mechanisms, based on economic theory. Dynamic models of general equilibrium represent standard tools, which assume that economic entities can maximise their profit in the form of decisions about investment activities (companies) or consumption (households). This assumption sets the dynamics of the model. Within the CGE model, the economic system is interpreted as a system of interdependent markets. A change that primarily affects only one market can influence in longer time period all markets in the given economic system (Kriström, OECD 2006).
Computable General Equilibrium models (CGE models) are often used for empirical work. These models are used for several reasons. For example, these models can be used to evaluate who is the “winner” and who is the “loser” in the case of tax reform. The model makes it possible to clarify the link between different tax bases. If fossil fuels are the subject of energy tax and carbon tax, raising carbon tax will reduce energy tax revenues. Changing carbon tax may also affect VAT and other tax revenues. All these tax interactions can be easily influenced by the CGE model (Kriström, OECD 2006).
CGE models simulate the behaviour and mutual interactions of individual economic entities operating in different markets. These models are based on neoclassical microeconomic assumptions, primarily on the premise of rational (optimal) behaviour of economic actors. The data source of these models is the Social Accounting Matrix (SAM). In a very simplified way, SAM can be described as a table aggregating flows of goods, services and money in the economy in a given period of time, usually one year.
The main areas of application of CGE models are the analyses of the impacts of significant changes in environmental, tax and foreign trade policies. Because the economy is composed of interconnected markets, a general equilibrium perspective is needed to determine the distributional impacts of economic policy (Kristrom, OECD 2006).
Some uncertainties are also associated with the CGE model. For example, models are based on demand and supply curves, whose gradients cannot be determined with 100% confidence. Regarding ex-ante models, it is not possible to determine how consumers and companies will finally react to the changes in economic policy. If the supply and demand in the model are identified incorrectly, this error may expand within the model and will further complicate predictions about the levels of particular variables. Also, CGE models rarely include a complete description of the tax system, which is a disadvantage in many cases, for example, in interpreting the regression or progressivity of tax reforms (Kristrom, OECD 2006).
3.1.5 Long-Term Models
Long-term modelling focuses mainly on the endogenisation of mechanisms that are taken as exogenous in standard macroeconomic modelling. It can be in particular the modelling of induced technological development. The standard tool for such modelling is Integrated Assesment Models (IAM).
W. Nordhaus created one of the best-known IAM models (Nordhaus 2017). It is a model of climate change DICE (Dynamic Integrated Model of Climate and Economy) and a slightly modified DICE-99 model. It is a highly aggregated global model combining global production, energy consumption and the climate sector (producing carbon dioxide emissions). The DICE model builds on a more detailed RICE model (Regional Dynamic Integrated Model of Climate and the Economy) model, also created by W. Nordhaus, but this model is disaggregated and covers eight regions. Technological change in the DICE model is expressed as the development of technologies involving climate change (reducing carbon dioxide emissions as greenhouse gas per unit of production). Therefore it is involved as an exogenous factor. The economic damage caused by greenhouse gas emissions is modelled as a variable that is dependent on the global average temperature increase due to CO2 emissions produced by industry.
Standard macroeconomic models focus mainly on the description of the main medium-term dynamic links within the economy (payment balance equilibrium, capital investments development, public debt dynamics of public finances); however, long-term growth mechanisms (change in factor productivity, interactions between demographic and macroeconomic variables etc.) are not included, or included merely, for example, using an exogenous model. On the contrary, IAM models explicitly seek to focus on these long-term mechanisms consistently.
References
Bach, S., Kohlhaas, M., Meyer, B., Praetorius, B., & Welsch, H. (2002). The effects of environmental fiscal reform in Germany: A simulation study. Energy Policy, 30, 803–811.
Bork, C. H. (2006). Distributional effects of the ecological tax reform in Germany: An evaluation with a microsimulation model. In Y. Serret & N. Johnstone (Eds.), The distributional effects of environmental policy (1st ed., pp. 139–170). Cheltenham, UK: Edward Elgar. OECD. ISBN 978-1-84542-3.
Bousquet, F., & Le Page, C. (2004). Multi-agent simulations and ecosystem management: a review. Ecological Modelling, 176(3–4), 313–332. https://doi.org/10.1016/j.ecolmodel.2004.01.011.
Cai, K., Niu, J. Z., & Parsons, S. (2014). On the effects of competition between agent-based double auction markets. Electronic Commerce Research and Applications, 13(4), 229–242. https://doi.org/10.1016/j.elerap.2014.04.002.
Chen, J. J., Tan, L., & Zheng, B. (2015). Agent-based model with multi-level herding for complex financial systems. Scientific Reports, 5, 8399. https://doi.org/10.1038/srep08399.
CNB (Czech National Bank). (2018). Monetary policy instruments. Available at https://www.cnb.cz/en/monetary_policy/instruments/
EUROSTAT. (2018). Statistics explained. Available at https://ec.europa.eu/eurostat/statistics-explained/.
Fiosins, M., Fiosina, J., Muller, J. P., & Gormer, J. (2011). Agent-based integrated decision making for autonomous vehicles in urban traffic. Advances on practical applications of agents and multi-agent systems. In Y. Demazeau, M. Pechoucek, J. M. Corchado, & J. Bajo (Eds.), Advances in Intelligent and Soft Computing (Vol. 88, pp. 173–178). https://doi.org/10.1007/978-3-642-19875-5_22.
Gontis, V., & Kononovicius, A. (2014). Consentaneous agent-based and stochastic model of the financial markets. Plos One, 9(7), e102201. https://doi.org/10.1371/journal.pone.0102201.
Janssen, M. A., & Ostrom, E. (2006). Empirically based, agent-based models. Ecology and Society, 11(2), art.37.
Kriström, B. (2006). Framework for assessing the distributional of financial effects of environmental policy. In Y. Serret & N. Johnstone (Eds.), The distributional effects of environmental policy (pp. 139–170). Cheltenham: Edward Elgar.
Lagorse, J., Paire, D., & Miraoui, A. (2010). A multi-agent system for energy management of distributed power sources. Renewable Energy, 35(1), 174–182. https://doi.org/10.1016/j.renene.2009.02.029.
Lengnick, M., & Wohltmann, H. W. (2013). Agent-based financial markets and New Keynesian macroeconomics: a synthesis. Journal of Economic Interaction and Coordination, 8(1), 1–32. https://doi.org/10.1007/s11403-012-0100-y.
Leontief, W. (1966). Input - output economics. New York: Oxford University Press.
Lund, P. (2007). Impacts of EU carbon emission trade directive on energy-intensive industries — Indicative micro-economic analyses. Ecological Economics, 63, 799–806.
Ministry of Finance of the Czech Republic. (2018). Macroeconomic forecast – November 2018. Available at https://www.mfcr.cz/en/statistics/macroeconomic-forecast/2018/macroeconomic-forecast-november-2018-33462
Morgan, F. J., & Daigneault, A. J. (2015). Estimating impacts of climate change policy on land use: An agent-based modelling approach. PLoS One, 10(5), e0127317.
Nordhaus, W. (2017). DICE/RICE models. Yale Economics. Available here https://sites.google.com/site/williamdnordhaus/dice-rice
Parker, D. C., Manson, S. M., Janssen, M. A., Hoffmann, M. J., & Deadman, P. (2003). Multi-agent systems for the simulation of land-use and land-cover change: A review. Annals of the Association of American Geographers, 93(2), 314–337. https://doi.org/10.1111/1467-8306.9302004.
Sahlin, J., Ekvall, T., Bisaillon, M., & Sundberg, J. (2007). Introduction of a waste incineration tax: Effects on the Swedish waste flow. Resources, Conservation and Recycling, 51(4), 827–846.
Samuelson, P. A., & Nordhaus, W. D. (2010). Economics. 19th ed. The McGraw-Hill series economics ISBN-13: 978–0–07-351129-0 (alk. paper), ISBN-10: 0-07-351129-3 (alk. paper).
Tang, L., Wu, J., Yu, L., & Bao, Q. (2015). Carbon emissions trading scheme exploration in China: A multi-agent-based model. Energy Policy, 81, 152–169.
World Bank. (2018). What is the difference between current and constant data? Available at https://datahelpdesk.worldbank.org/knowledgebase/articles/114942-what-is-the-difference-between-current-and-constan
Author information
Authors and Affiliations
Corresponding author
Editor information
Editors and Affiliations
Rights and permissions
Open Access This chapter is licensed under the terms of the Creative Commons Attribution 4.0 International License (http://creativecommons.org/licenses/by/4.0/), which permits use, sharing, adaptation, distribution and reproduction in any medium or format, as long as you give appropriate credit to the original author(s) and the source, provide a link to the Creative Commons license and indicate if changes were made.
The images or other third party material in this chapter are included in the chapter's Creative Commons license, unless indicated otherwise in a credit line to the material. If material is not included in the chapter's Creative Commons license and your intended use is not permitted by statutory regulation or exceeds the permitted use, you will need to obtain permission directly from the copyright holder.
Copyright information
© 2020 The Author(s)
About this chapter

Cite this chapter
Zimmermannová, J. (2020). Methods in Microeconomic and Macroeconomic Issues. In: Pászto, V., Jürgens, C., Tominc, P., Burian, J. (eds) Spationomy. Springer, Cham. https://doi.org/10.1007/978-3-030-26626-4_5
Download citation
DOI: https://doi.org/10.1007/978-3-030-26626-4_5
Published:
Publisher Name: Springer, Cham
Print ISBN: 978-3-030-26625-7
Online ISBN: 978-3-030-26626-4
eBook Packages: Earth and Environmental ScienceEarth and Environmental Science (R0)