
Abstract
In order to realize three-dimensional reconstruction of canopy at different growth stages of fruit trees, 3D data acquisition methods and canopy reconstruction methods were studied. Based on the analysis of morphological and structural changes in fruit phonological phase, and integrating the advantages of different data acquisition techniques, the data acquisition method of fruit tree morphological structure based on multi-source is proposed. In the dormant period, the canopy skeleton is extracted based on point cloud data; in the leaf curtain stage, a new artificial coding method of canopy structure is constructed, and the data of new shoots and leafs is obtained efficiently; and organ template data is obtained synchronously, and the organ template library is constructed. Then, a multi-source data fusion modeling method is proposed to reconstruct the three-dimensional canopy of fruit trees at different growth stages. And the feasibility of the method is verified by 12 year old open central leader system apple trees, the results show that compared with the manual data acquisition method, the method improves the efficiency by more than 5 times, and the error rate is less than 6%. It provides a feasible scheme for the continuous data acquisition and canopy 3D reconstruction of fruit trees, so as to provide technical support for virtual modeling, scientific calculation and experimental simulations.
You have full access to this open access chapter, Download conference paper PDF
Keywords
1 Introduction
With the development of digital plant technology, 3D canopy data and 3D modeling technology are widely used in tree characterization, growth simulation, virtual management of orchard and so on [1,2,3]. At present, there are three main ways to acquire three-dimensional shape of fruit tree: image technology, 3D digital technology and 3D scanning technology. The domestic and foreign researchers have achieved good results in the field crop 3D reconstruction [4,5,6], however, 3D reconstruction of fruit tree is still the technical difficulties and research hotspots. Different from the field crops, the morphological and structural characteristics of the fruit trees include: tall crowns, complex branches, excessive number of leaves and artificial pruning. Because of the occlusion between organs, data missing and data noise exist in all kinds of data seriously, the 3D model based on single source data acquisition technology is difficult to meet the requirements of experimental accuracy [7,8,9,10,11]. Integrating the advantages of different data acquisition technologies, this paper proposes a method to obtain morphological structure based on multi-source data fusion of fruit tree phenology, and the 3D modeling of the apple tree have constructed by this method. Taking the open central leader system apple trees as the experimental object, the experimental results show that the modeling efficiency is improved greatly by comparing with the artificial method, and has a realistic visualization effect. Therefore, this method provides a feasible scheme for the continuous data acquisition of fruit tree growth.
2 Fruit Tree Morphology and Structure Characteristics
Different from the common trees, the tree shape is affected by artificial pruning, and the tree structure changes greatly. The tree structure of fruit tree conforms to the model of axis structure, and has obvious phenology characteristics. During the phenology phase, the canopy structure of fruit trees changes obviously, and the leaf curtain formation has a strong gradual process through the growth process of long leaves, flowers, fruits and leaves.
2.1 Axial Structure
According to the axis reference model, the structure of the plant is composed of plant axis, and the axis reference model is faithful to the growth and development characteristics of plants [12]. Therefore, the tree structure and the topological relationship between branches can be described using the axial structure model and the directed tree structure method. As shown in Fig. 1, the tree structure is branched and layered according to the branch structure, each of which is a regular axis structure, and the last layer consists of leaves, fruits, or flowers.

Fruit axis structure (left) and directed tree structure model (right)
2.2 Leaf Curtain
Leaf curtain is composed of all leaves on various branches, and the leaf curtain gradually forms with the growth of leaves. The canopy leaves of fruit trees are large in number, different in space, and seriously cross and block each other, therefore, the acquirement of leaf curtain data is a difficult point. Take the apple tree for example, leaf growth is usually characterized by two states: clustered and simple leaves, and the leaves alternate in a spiral form and rotate 144o between the two leaves [13], and most clustered leaves grow on shoots. Different branching structures form different leaf curtain structures, and when the long branch is more, the time of formation of leaf curtain is later [14]. Therefore, a data acquisition plan should be designed according to the tree structure.
2.3 Phenological Phase
Fruit trees are perennial plants, with obvious annual growth cycle, and the annual growth cycle of fruit trees is also called phenology. In the phenological period of fruit trees, the crown changes through sprout, shoot growth, flowering, fruiting, maturation and other processes. Take the apple tree for example, in the general year, apple trees germinate in late march and begin to flower in early april, the spring shoots stop growing in mid-June, and leaves begin to fall in early November. The phenological phases are staggered and connected, and in addition, they are related to varieties [15], as shown in Fig. 2.

The annual growth phenology of apple tree
3 Method
3.1 Data Acquisition Process
The phenological and structural characteristics of fruit tree provides the guidance on the time axis for obtaining canopy structure throughout the year. At present, the use of different equipment to obtain canopy data has its own limitations, mainly in: point cloud data obtained from a 3D scanner cause large loss due to occlusion, and the use of three-dimensional digitizer equipment can only obtain small range data and the workload is great. Therefore, we integrate a variety of data acquisition devices, and optimize the data acquisition process, and establish the data acquisition process of the tree canopy structure based on multi-source information fusion. Data acquisition is carried out at four critical periods, such as deciduous stage, flowering stage, leaf curtain formation stage and fruit ripening stage. The data acquisition flow diagram is shown in Fig. 3, and the specific steps are as follows:

Data acquisition process of fruit morphological structure based on multi-source
-
(1)
In the defoliation period, the canopy without leaves is scanned by the Focus3D three dimensional laser scanner [16] and the roughness of branches was measured manually to correct the tree roughness model. The scene and the tree point cloud data obtained by using the Faro scanner are shown in Fig. 4
Fig. 4. 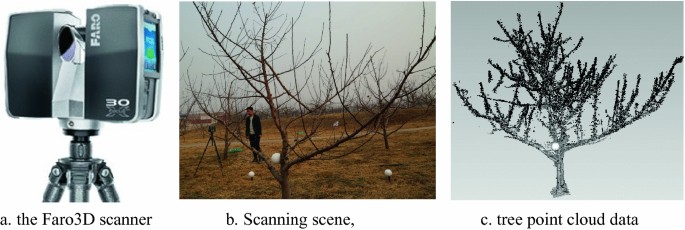
The equipment and rule diagram of crown digitizer
-
(2)
In the flowering period, first of all, the canopy with flowers is scanned by the Focus3D three dimensional laser scanner to obtain the distribution of flowers, and some typical flowers are scanned using the Artec Eva scanner to set up branches template(see the Fig. 5).
Fig. 5. 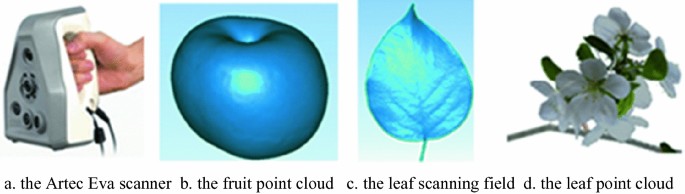
Organ point cloud scan results
-
(3)
In the canopy formation period, first of all, the different kinds of branch structures are obtained by using digital instruments(Polhemus FASTSCAN), the key points of the information including: starting point, end point, petiole point, leaf blade point, blade tip point, blade edge point, etc., and the collection rules are shown in Fig. 6. Then, some typical leafs are scanned using the Artec Eva scanner to set up leaf template. Finally, the number and length of different branches and the number of leaves on these branches are obtained by manual measurement and statistics.
Fig. 6. 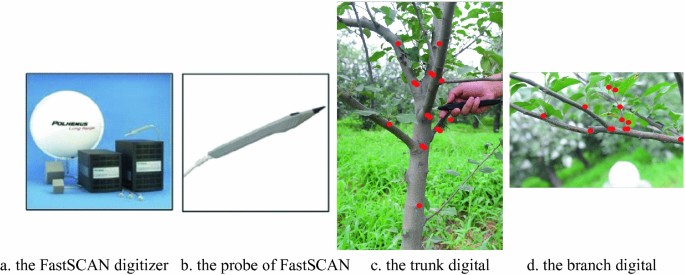
The equipment and rule diagram of crown digitizer
-
(4)
In fruit ripening period, the canopy with fruits is scanned by the Faro Focus3D three dimensional laser scanner to obtain the distribution of fruits, and different types of fruit diameter are measured to validate the fruit 3D model.


3.2 Data Fusion and Modeling
3.2.1 Fruit Tree Skeleton Extraction Based on Point Cloud
The canopy skeleton can be extracted by processing the tree canopy cloud data without leaf, commonly used point cloud processing algorithms include: Laplacian operator contraction, K neighborhood map connection, geodesic map, level set algorithm and so on. Firstly, the Delaunay neighborhood of each point is computed based on the Laplacian operator of point cloud [17], and the Laplacian weighted matrix \( L \) is constructed according to the Delaunay neighborhood data, and the shrinkage matrix \( W_{L} \) and the shape matrix \( W_{H} \) are established as constraint factors, and the point cloud matrix \( P \) is iterated iteratively with energy minimization, and the iterative contraction equation is shown in Eqs. 1–2. After a finite iteration, the original dense point cloud will become very thin and approach the skeleton points. Secondly, the K neighborhood map, geodesic map and level set are used to fit skeleton for the shrinkage points [18]. Finally, the algorithm of point cloud circumcision [11] is used to solve the branch radius and patch the small branches. Thus, the canopy fruit tree is reconstructed exactly based on point cloud, and the solving process is shown in Fig. 7.

The point cloud skeleton extraction algorithm process
3.2.2 Coding Representation of Canopy Topology
In order to facilitate the manual survey of canopy structure data, this paper proposes an efficient coding method for branch topological structure. The branch structure is recorded according to the branch level, and each branch records one row of data. The encoding is divided into two parts: the coding head and the coding body. The coding head information includes the number of branch (m), the number of parent branch (n), the length of branch (L) and the coarseness of branch (d). The coding body information includes all the organs on a branch and branch structure, and the types of organs on the branches are composed of leaves, clustered leaves, branches, flowers, fruits and so on, they are encoded respectively by A, B, C, D and E; Typically, the leaves are continuous, and in order to simplify the recording representation, \( Ai \) is used to represent the successive single leaves on the present branch, and \( i \) represents the number of consecutive single leaves, similar to the method used for coding flowers and fruit organs; For leaf clusters, the number of leaves on a leaf cluster should be recorded, so \( Bj \) leaves are encoded, and \( j \) is the number of leaves on the leaf cluster; and \( Dh \) is used as branch encoding, where \( h \) is the row number of the branch. The sketch map of the coding representation is shown in Fig. 8. The encoding method can be used orderly and conveniently for data investigators to reduce the recording error of survey data, improve the efficiency of manual investigation and increase the amount of investigation information.

The sketch map of the coding representation
3.2.3 The Linear Relationship Model of New Branches and Leaves
The branches with different growth directions were selected as the mother branches, and the number of new shoots and the number of leaves on the branches are recorded according to the order from bottom to top. The branch types are divided into four kinds according to the length of branches: long branch (>15 cm), middle branch (5–15 cm), short branch (<5 cm) and leafage branch. At the beginning of the shoot growth, the artificial survey experiments are carried out at intervals until leaf crown forming. Then, based on the artificial survey data, a new branch volume relation model is established, as shown in the Fig. 9. And the linear relationship model between branch length and leaf number is established based on the artificial survey data, as shown in the Fig. 9. Typically, the constructed model conforms to varietal characteristics, so the same tree type and the same breed do not need repeated investigations.

Quantitative changes in the growth process of different branches
3.2.4 Multi-source Data Fusion Modeling
According to this method, the canopy morphological data of a growing year of fruit trees was systematically obtained, the data obtained in accordance with the classification of data source mainly includes: canopy cloud data of dormancy stage, flowering stage and fruit maturity stage; organs cloud data of leaves, flowers, fruits and other organs; the local branches of digital data, the topological structure of artificial crown survey data, and so on 4 types data. In a growth year, the morphological structure of fruit trees vary with the new branches changes, the skeleton was reconstructed based on the dormant canopy cloud data, and the reconstructed skeleton was basically stable in one growing year, and it can be concluded that the later canopy data is based on the growth of the skeleton. Then the canopy distribution of flowers and fruits can be easily obtained by processing the point cloud data at flowering and ripening stages [19,20,21]. And through the gridding modeling of point cloud data of leaves, flowers and fruits, the template library of organs can be constructed, and the organ arrangement can be realized on the canopy skeleton. Finally, the statistical model of blade azimuth and inclination angle are constructed through the statistical analysis of local branches of digital data [22], and the branch and leaf distribution model is constructed by statistical analysis of the artificial data of the crown topology. Therefore, based on the statistical model and organ template, the new branches and leaves are planted on the basis of the canopy skeleton model, and the canopy structure of fruit tree is reconstructed for one year of growth.
4 Result
4.1 Visualization Effect
The feasibility of the method is verified by 12 year old open central leader system apple trees, and the data acquisition scene is shown in Fig. 11a. The skeleton key points of the canopy cloud are extracted at the defoliation stage, and the extracted skeleton key points are shown in Fig. 11b. Then the new branch canopy 3D model (Fig. 11c) and the leaf canopy 3D model (Fig. 11d) are generated based on the artificial survey data. And the 3D model of leaf canopy is rendered from different directions, and the visual effects are shown in Fig. 10f and 11e. According to the visualization results, the three-dimensional model of fruit canopy with different growth stages can be constructed based on the method, with higher accuracy and better visualization effect.

The linear relationship model of new branches and leaves

Canopy reconstruction process and visualization effect
4.2 Accuracy and Efficiency
Compared with the measured data, the accuracy and efficiency of the proposed method are verified. The measured data is obtained by a wide range of three-dimensional digitizer, and the process of data acquisition requires two artificial participants. The leaf number, leaf area index are considered as the important indicator of canopy structure, therefore, on the basis of these two indexes, the accuracy of this paper method is compared and analyzed for three evacuation layered form apple trees, and the time consuming ratio of the two methods is recorded. The contrast results are shown in Table 1, the results show that the error rate of blade number is less than 5%, and the error rate of leaf area index is less than 6% by this paper method, and in terms of time efficiency, for a single fruit, this method is more than 5 times digital methods, and for the orchard group modeling, this method is 10 times more than the digital method, and lower labor costs.
5 Conclusions
In this paper, we present an efficient method for obtaining and reconstructing morphological structure of fruit tree canopy based on multi-source. The experimental results show that the method can realize 3D continuous reconstruction of fruit canopy in a growing year. The reconstructed 3D canopy model has a realistic visualization effect, and compared with the manual method, this method improves the efficiency by more than 5 times, and the error rate is less than 6%. So this paper provides a feasible scheme for the continuous data acquisition and canopy 3D reconstruction of fruit trees, and provides technical support for virtual modeling, scientific calculation and experimental simulations. However, our method depends on the foliage growth model. In the future, we will further optimize the growth model through a large number of experimental data, so that it can be applied to different fruit tree shapes.
References
Zhao, C., Lu, S., Guo, X., et al.: Exploration of digital plant and its technology system. Sci. Agricultura Sin. 43(10), 2023–2030 (2010)
Yan, W., Chonghui, F., Daowei, J., et al.: Comparison on fruit crown characteristics and quality of different tree canopy shapes. Acta Agriculturae Boreali-Occidentalis Sin. 20(12), 93–97 (2011)
Gao, Z.Q., Zhao, C.X., Cheng, J.J., et al.: Tree structure and 3-D distribution of radiation in canopy of apple trees with different canopy structures in China. Chin. J. Eco-Agric. 20(1), 63–68 (2012)
Yuan, X., Zhao, C., Wen, W., et al.: Detailed modeling of 3-D configuration of tomato plant. Trans. Chin. Soc. Agric. Mach. 43(12), 204–210 (2012)
Wu, Y., Cao, W., Tang, L., et al.: OpenGL-based visual technology for wheat morphology. Trans. CSAE. 25(1), 121–126 (2009)
Xinyu, G., Chunjiang, Z., Boxiang, X., et al.: Design and implementation of three-dimensional geometric morphological modeling and visualization system for maize. Trans. CSAE. 23(4), 144–148 (2007)
Liu, J., Jiang, Z., Li, H., et al.: Easy modeling of realistic trees from freehand sketches. Front. Comput. Sci. 6(6), 756–768 (2012)
Zhang, X., Li, H., Dai, M., et al.: Data-driven synthetic modeling of trees. IEEE Trans. Vis. Comput. Graph. 20(9), 1214–1226 (2014)
Delagrange, S., Jauvin, C., Rochon, P.: PypeTree: a tool for reconstructing tree perennial tissues from point clouds. Sensors 14(3), 4271–4289 (2014)
Lu, S., Guo, X., Zhao, Z., et al.: Shape reconstruction of fruit tree from colored 3D point cloud. In: The 7th International Conference on Function-Structural Plant Models, Saariselk, Finland, pp. 55–57 (2013)
Wu, S., Xiao, B., Guo, X., Wen, W., Zhao, C.: An accurate fruit tree canopy reconstruction method based on dense point cloud. ICIC Express Lett. Part B: Appl. 8(1), 159–165 (2017)
Shi, Y., Cheng, X., Zhang, H.: Three dimensional trees emulation based on parametric L-system. J. Tongji Univ. (Nat. Sci.) 39(12), 1871–1876 (2011)
Shu, H., et al.: Apple Science. China Agriculture Press, Beijing (1995)
Xingwang, Z., et al.: Cultivation Techniques of Apple in Yunnan. Yunnan Science and Technology Press, Kunming (1995)
Xia, X., Qiu, Y., Li, Z., et al.: Response of key ecological factors of Apple phenology to typical topography of orchard. Jiangsu Agric. Sci. 40(9), 175–181 (2016)
Johnson, M., Liscio, E.: Suspect height estimation using the Faro Focus3D laser scanner. J. Forensic Sci. 60(6), 1582 (2015)
Cao, J., Tagliasacchi, A., Olson, M., et al.: Point cloud skeletons via Laplacian-based contraction. In: Shape Modeling International Conference SMI, Aix En Provence, pp. 187–197 (2010)
Verroust, A., Lazarus, F.: Extracting skeletal curves from 3D scattered data. Vis. Comput. 16(1), 15–25 (2000)
Ma, X., Meng, Q., Zhang, L., et al.: Image mosaics reconstruction of canopy organ morphology of apple trees. Trans. Chin. Soc. Agric. Eng. 30(12), 154–162 (2014)
Lu, S., Guo, X., Zhao, C., et al.: Shape reconstruction of fruit tree from colored 3D point cloud. In: The 7th International Conference on Functional-Structural Plant Models, Saariselkä, Finland, pp. 55–57 (2013)
Sun, Z., Lu, S., Guo, X., et al.: Surfaces reconstruction of plant leaves based on point cloud data. Trans. Chin. Soc. Agric. Eng. 28(3), 184–190 (2012)
Dong, Q., Wang, Y., Yang, L., et al.: Parameter identification of tomato 3D architectural model and simulation. Trans. CSAE. 26(Suppl. 2), 38–42 (2010)
Acknowledgements
This work was supported by Beijing Postdoctoral Research Foundation, Beijing Municipal Natural Science Foundation (Grant NO. 4162028), and, Scientific and Technological Innovation Team of Beijing Academy of Agricultural and Forestry Sciences (JNKYT201604).
Author information
Authors and Affiliations
Corresponding author
Editor information
Editors and Affiliations
Rights and permissions
Copyright information
© 2019 IFIP International Federation for Information Processing
About this paper

Cite this paper
Wu, S., Xiao, B., Wen, W., Guo, X., Liu, L. (2019). Fruit Trees 3D Data Acquisition and Reconstruction Based on Multi-source. In: Li, D., Zhao, C. (eds) Computer and Computing Technologies in Agriculture XI. CCTA 2017. IFIP Advances in Information and Communication Technology, vol 546. Springer, Cham. https://doi.org/10.1007/978-3-030-06179-1_17
Download citation
DOI: https://doi.org/10.1007/978-3-030-06179-1_17
Published:
Publisher Name: Springer, Cham
Print ISBN: 978-3-030-06178-4
Online ISBN: 978-3-030-06179-1
eBook Packages: Computer ScienceComputer Science (R0)