
Abstract
Although process monitoring can facilitate to detect deviations from required part quality and safe process conditions, the analysis and postprocessing of the measured data are not embedded into the CAx workflow. Binding the measurement data together with material removal simulation creates a powerful tool for CAM programmers and process engineers. The user can analyze 3D visualization of the machining process more intuitively. A developed CAM integration simulates material removal considering the actual tool coordinates (measured during the process) and can depict the acquired and simulated cutting conditions (spindle torque, axes accelerations, etc.) with various color schemes on in-process stock simulation.
You have full access to this open access chapter, Download chapter PDF
Keywords
1 Introduction
Over the last century, companies and research institutions have put significant efforts into improving the performance of machining operations. The progress was achieved in improving tool life through optimization of cutting tool geometry, cutting material, coolants, and coatings. Nowadays, these advances can be considered traditional and, to a large extent, this area seems to be over-researched, resulting in marginal output from research. In order to push back the frontiers of industrial practice, more sophisticated tools and approaches must be used to address process monitoring and controlling the conditions of the machine and tool [1].
Since computer numerical controls (CNCs) are used in almost all kinds of production processes, there is a way to improve CNCs such that the entire production chain may benefit from such an improvement. Because CNCs depend on the production cycles of the hardware to which they are connected, CNC implementations need to assure a certain level of interoperability. The technological standards of current CNC user interfaces do not provide the rich user experience expected of today’s HMIs. In addition, not all available information is connected and provided to the user. Information such as the current axis values and machining program are displayed as text, and only experienced users are able to use the information directly. When new data is introduced into these systems, either by exchanging the CNC, by adding hardware to the system or by adding simulation software, it is difficult to connect this new data to the information currently in the system.
Although many researchers and commercial entities are involved into the development of software and hardware solutions for process monitoring, one of the most comprehensive studies in the field [2] reveals marginal exposure of the development in the area of visualization of the process monitoring. In general, the review papers in monitoring of machining operations [2, 3] do not emphasize the importance of visualization. Measurements from additional hardware can be displayed as plots, as shown in Fig. 14.1, but it is difficult to correlate a position on the plot with the programmed toolpath and the machine values at that instance in time.

Visualization of the process parameters is plotted as a set of charts
Moreover, it seems that most of the publications target visualization of simulation results only. Apparently, computing of cutting forces and other process parameters can become an important issue for the industry, because it may facilitate reduction in ramp-up time and associated costs for batch production. Process monitoring data are often used to tune process parameters for batch production. Several parts are machined before the batch production in order to define the specification of a stable process. In contrast, a fully fledged virtual machining environment will result in reliable prediction of cutting conditions without performing real trials. It is likely that postprocessing and analysis of the data acquired after actual machining will become nearly obsolete after virtual manufacturing paradigm becomes an industry standard. Simulation approaches will avoid performing expensive trials. Creating a strategy that combines measurement and simulation data sources has a high potential.
Based on the preliminary studies, several gaps between process monitoring and visualization have been identified. The following list highlights approaches that may bring benefits in the manned analysis of the process monitoring data:
-
Geometric simulation/verification based on the measured machine axis positions;
-
Colorization of the simulated workpiece geometry based on the simulated/measured process parameters (spindle torque, cutting forces, etc.);
-
Comparison of the simulated and measured process parameters.
On the software side, the aim is to replace the standard data display methods (tables, graphs, etc.) with a graphical interface that shows the current shape of the workpiece and the machine to enable users to immediately see what is currently happening. This directly connects the real world of the process, the machine, and the workpiece with the data at a certain instant in time. This allows users to directly find correlations and problems and apply the needed modifications to the process.
This chapter presents visualization functionalities provided by ModuleWorks to Twin-Control. This includes explanation of the principles of the underlying 3D simulation methods along with the description of the developed visualization features providing advanced visualization of measured and simulated cutting force values that are mapped on the predicted shape of the workpiece.
2 3D Volumetric Simulation
There exist several techniques which have been developed to model virtual workpieces and removing any material that interferes with the geometry of a tool moved along a path (solid modeling [4, 5], Z-map [6], and Dexel approach [7]). In this paper, a discrete modeling method based on tri-Dexel volume representation [8] is used, which is an improved version of the Dexel model. The tri-Dexel model represents a volume as a manifold of evenly distributed linear segments, or Dexels, in three orthogonal directions, as depicted in Fig. 14.2a. In the current paper, geometric software which applies the tri-Dexel model is used because tri-Dexel model has proved to be an efficient data structure with reliable performance and precision, which is very important for a computation routine running in an iterative loop. The material removal has been simulated using ModuleWorks engine that calculates discrete intervals intersecting with the swept volume of a moving tool. The start and end points of all subtracted intervals indicate the boundary of the removed volume and hold information about their spatial position and inverted normal vectors of the tool sweep envelop. Dexel spatial positions, surface normal vectors, and signatures of the intersecting tools are sufficient to reconstruct the part surface, as shown in Fig. 14.2b.

Use of the tri-Dexel model: a tri-Dexel model (red, green, and blue segments are the Dexels in X, Y, and Z directions); b triangulation and triangle coloring derived from the Dexel points and normal vectors
3 3D Simulation and Interfaces Combined
To connect the real-world shapes, a virtual representation of the machine and the current shape of the workpiece need to be maintained throughout the entire process. ModuleWorks uses its industry-proven MachSim (the machine and its kinematic) and CutSim (actual shape of the workpiece during the manufacturing process) software to create the 3D representation of the workpiece geometry and machine that can then be integrated into the CNC user interface.
For the Twin-Control project, this methodology has been extended and optimized. It has developed an interface to exchange internal simulation data for processing analytic modules that allow the prediction of process behavior such as stability and cutting forces. To display this information to the user at the machine, a second interface connects this data with the workpiece shape that was calculated in parallel. The other interfaces take real-world measurement data and integrate it into the same representation of the workpiece shape. The virtual system is completed by a system that delivers warnings to users and delivers additional security to the machine. Users can directly correlate data with the current shape of the workpiece. On the machine, this system can stop the process to avoid crashes and other unwanted process errors.
As shown in Fig. 14.3, the process monitoring data are split into spatial data related to the cutter position and a process parameter, which will be visualized. The measured machine axis positions are used to re-simulate material removal in CAM software. The workpiece simulation holds only geometry data describing the material left after the simulation. Finally, the workpiece geometry is enriched with the measurement values. In this particular case, the Genior Modular system provides spindle torque.

Workflow to combine simulation of measured machine movements and process data
To demonstrate developed software features, a simple pocketing operation (four-pocket milling) is used (as shown in Fig. 14.4). In order to improve usability and ergonomics of visual inspection, colorization of milling tool, toolpath, and machined surface has been implemented. However, visualization is only one aspect of part quality inspection. Figure 14.5 depicts a Chiron milling machine equipped with the developed software–hardware functionality. The simulation screen shows the actual status of the workpiece shape, in which material removal simulation is performed considering measured axes positions. Online inspection of the process is always available regardless of the workpiece visibility (for instance, due to coolant mist). Closer look on a single pocket is shown in Fig. 14.4b. The spindle torque (%) was measured every 0.06 mm for constant feed. The length of a pocket toolpath is about 73 mm.

Visualization of pocket milling machine: a colorization of cutting/rapid moves; b colorization of spindle torques

Observation of the milling process on a Chiron machine: a through the machine housing; b on the simulation screen
Another visualization feature, which may not be extremely useful in the industrial settings, is mapping of the difference between measured and expected/simulated data. As an example, researchers or scientists are allowed to depict the relative error of their force models and the measurements of the actual machining. Figure 14.6 shows how two sets of data can be represented on a 3D surface of the simulated part. This approach should ease finding typical machining case scenarios (corner machining, pocket machining, etc.) at which simulation models fail more often by highlighting them.

Visualization of the difference between measured and simulated data: a input data; b mapping of the difference on the 3D surface
Additionally, one experimental visualization feature for advanced simulation has been developed. In generic simulation, all cut points are painted with one uniform color. However, some tool properties, like tool deflection, wear, depend on the point on the tool that removes material. Applying the simulation data along with the feature yields a surface depicting proper input values for the parts of the cutting tool that are in contact in machining time, as shown in Fig. 14.7. Calculation of the contact points considers five-axis motions via quaternion interpolation.

Non-uniform colorization: a tool data set at one tool position; b mapping of all tool data sets onto the machined surface
4 Additional Visualization Features
Besides, there have been developed another several visualization methods that can facilitate to optimize machining operations:
-
Visualization of the tool–workpiece engagement. Figure 14.8 shows the contact area between a tool and the workpiece. This functionality is useful to analyze how cutting forces change along a part program.
Fig. 14.8 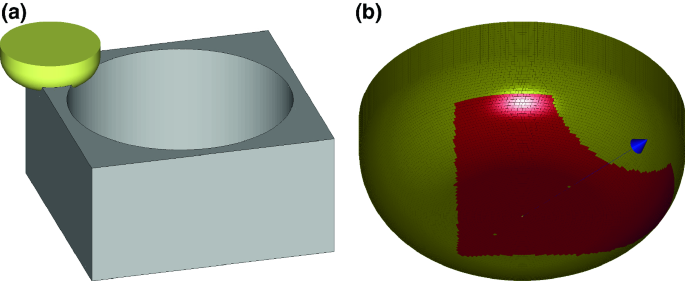
Visualization of the tool-workpiece engagement: a tool-workpiece setup; b engagement area
-
Visualization of the cutting marks on the machined surface. Figure 14.9a shows which surface outlook can be expected after grinding. This feature is expected to be necessary for aesthetic applications.
Fig. 14.9 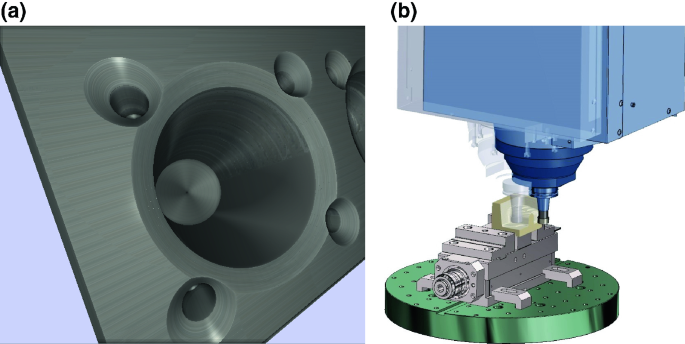
Additional visualization features: a grinding textures using the shader technology; b visualization of the future machine position (transparent)
-
Visualization of future shape and position of machine components. Figure 14.9b shows two tools and spindles. The transparent ones are attributed to the future positions acquired from the CNC as the output of the look-ahead functionality. The real axis positions, machine geometries, and workpiece position are taken into account. The predicted position is examined toward potential collisions and may signal to halt the machine before the actual collision occurs.


5 Conclusions
Integration of the process monitoring data into CAM simulation is a tangible progress in the evolution of the CAx chain. Previously, the analysis of the cutting process measurements could not be performed in the CAM environment. In an extended CAM, immediate access to stored process parameters allows more robust verification and modification of NC programs. Three-dimensional machined surface colored according to the measurement can be analyzed more intuitively than graph plots. Also, it can be detected whether the extreme or unfavorable cutting conditions do really affect the machined surface. In a case of an actual or foreseeable failure, results of cutting force simulation can be exploited for operation re-planning to avoid tool and workpiece damage.
References
Ulsoy, A.G., Koren, Y.: Control of machining processes. J. Dyn. Syst. Meas. Control 115(2B), 301–308 (1993)
Teti, R., Jemielniak, K., ODonnell, G., Dornfeld, D.: Advanced monitoring of machining operations. CIRP Ann. Manuf. Technol. 59(2), 717–739 (2010)
Stavropoulos, P., Chantzis, D., Doukas, C., Papacharalampopoulos, A., Chryssolouris, G.: Monitoring and control of manufacturing processes: a review. In: 14th CIRP Conference on Modeling of Machining Operations (CIRP CMMO), vol. 8, pp. 421–425 (2013)
Lazoglu, I., Boz, Y., Erdim, H.: Five-axis milling mechanics for complex free from machining. CIRP Ann. Manuf. Technol. 60, 117–120 (2011)
Boz, Y., Erdim, H., Lazoglu, I.: Modeling cutting forces for 5-axis machining of sculptured surfaces. In: 2nd International Conference, Process Machine Interactions (2010)
Kim, G., Cho, P., Chu, C.: Cutting force prediction of sculptured surface ball-end milling using Z-map. Int. J. Mach. Tools Manuf 40, 277–291 (2000)
Boess, V., Ammermann, C., Niederwestberg, D., Denkena, B.: Contact zone analysis based on multidexel workpiece model and detailed tool geometry representation. In: 3rd CIRP Conference on Process Machine Interactions (2012)
Benouamer, M.O., Michelucci, D.: Bridging the gap between csg and brep via a triple ray representation. In: Proceedings of the Fourth ACM Symposium on Solid Modeling and Applications, SMA ’97, ACM, pp. 68–79, New York, NY, USA (1997)
Author information
Authors and Affiliations
Corresponding author
Editor information
Editors and Affiliations
Rights and permissions
Open Access This chapter is licensed under the terms of the Creative Commons Attribution 4.0 International License (http://creativecommons.org/licenses/by/4.0/), which permits use, sharing, adaptation, distribution and reproduction in any medium or format, as long as you give appropriate credit to the original author(s) and the source, provide a link to the Creative Commons license and indicate if changes were made.
The images or other third party material in this chapter are included in the chapter's Creative Commons license, unless indicated otherwise in a credit line to the material. If material is not included in the chapter's Creative Commons license and your intended use is not permitted by statutory regulation or exceeds the permitted use, you will need to obtain permission directly from the copyright holder.
Copyright information
© 2019 The Author(s)
About this chapter

Cite this chapter
Plakhotnik, D. et al. (2019). Visualization of Simulated and Measured Process Data. In: Armendia, M., Ghassempouri, M., Ozturk, E., Peysson, F. (eds) Twin-Control. Springer, Cham. https://doi.org/10.1007/978-3-030-02203-7_14
Download citation
DOI: https://doi.org/10.1007/978-3-030-02203-7_14
Published:
Publisher Name: Springer, Cham
Print ISBN: 978-3-030-02202-0
Online ISBN: 978-3-030-02203-7
eBook Packages: EngineeringEngineering (R0)