
Abstract
We explored the dynamics of choice behavior while the values of the options changed, unannounced, several times. In particular, choice dynamics were compared when the outcome values of all available options were known (full feedback) and when the outcome value of only the chosen option was known (partial feedback). The frequency of change, the values of the options, and the difference between them were also manipulated. In an experiment with N = 427, we found that the patterns of choices were different for the two levels of feedback. Whereas behavior in the full-feedback condition showed a tendency to switch choices following a missed opportunity—replicating previous findings—the behavior in the partial-feedback condition was different. It was sensitive to the outcome value of the chosen option in comparison to some memory of the last-experienced outcome value of the unchosen option. However, the comparison of these two values influenced choice behavior only when the outcome of the currently chosen option was satisfactory and the last outcome of the unchosen one was not. As expected, the other manipulated variables (change frequency, the options’ values, and the difference between them) had no effect on the dynamics of behavior.
Life can be perceived as a sequence of choices between available alternatives, the values of which are often unknown. Even when choosing repeatedly between the same alternatives, their values or our tastes may change over time. Nevertheless, it is generally accepted that experience drives choice.
Indeed, ever since the earliest research in learning (e.g., Thorndyke’s, 1927, law of effect), and all the way to modern-day research on decisions from experience (Barron & Erev, 2003; Hertwig, Barron, Weber, & Erev, 2004; Hertwig & Erev, 2009; Rakow & Newell, 2010), it has been well known that repeated choices are outcome-driven. There is less consensus, however, as to what aspects of the outcome of a choice are most critical in determining subsequent choice. Is the absolute level of the reward obtained most important, or is this reward compared to other possible rewards? If the latter, then what is the obtained reward compared to? One possibility is that it is compared to some prior expectation of reward, such as, for example, the highest reward that could have been obtained with the same choice. Another possibility is that the reward obtained is compared to what could have been obtained had a different choice been made (as has often been found before: e.g., Avrahami & Kareev, 2011; Avrahami, Kareev, & Hart, 2014; Grosskopf, Erev, & Yechiam 2006; Hart, Kareev, & Avrahami, 2016; Kareev, Avrahami, & Fiedler, 2014; Yechiam, & Busemeyer, 2006). However, the second possibility has so far been demonstrated only when information about the reward that could have been obtained was available.
But what would explain behavior when only the outcome of the chosen option is available? In the present research, we focused on the effects of the availability of information about counterfactual outcomes on choices—that is, on how choices evolve with and without information about the outcomes of actions that could have been taken but were not. Because the availability of outcome information may be particularly important when the qualities of options are unstable, we studied two levels of information in a changing environment.
Literature review
Oftentimes one learns only about the outcome of the option one has chosen. One knows how tasty the dishes one ordered in the new restaurant were, but not how tasty the other dishes would have been. One knows how well the medical treatment adopted has worked, but not how an alternative treatment would have worked for the same person with the same symptoms. Choice between risky options, when only the outcome of the chosen option is available, has been studied amply before, both theoretically and experimentally, in various Bandit paradigms (Barron & Erev, 2003; Gans, Knox, & Croson, 2007; Gittins, 1979; McNamara & Houston, 2009; Rakow, Demes, & Newell, 2008). These studies were mainly concerned with the goodness of choice: How long should (or does) it take to detect the most valuable option (assuming that one is better than the other) and to what extent do choices maximize the reward available?
Alternatively, choice decisions may take place in an environment in which one knows not only the outcome of the chosen option but also that of the unchosen ones. For example, one can observe the performance not only of the stocks one has bought, but also the performance of the stocks not bought; one experiences the traffic on the road chosen but may also learn, from traffic reports, about the conditions of traffic on the unchosen one. This case of repeated choice with full feedback has been also studied extensively (e.g., Avrahami et al., 2014; Yechiam & Busemeyer, 2006).
Some work has indeed compared behavior under full- and partial feedback (e.g., Camilleri & Newell, 2011; Grosskopf et al., 2006; Newell, Rakow, Yechiam, & Sambur, 2016; Rakow, Newell, & Wright, 2015). However, these previous studies focused mainly on the question whether decision makers maximize their profit given either of the two feedback regimes or to what degree decision makers underweigh small probabilities with these feedback regimes.
It should be noted that most of the above-mentioned studies of repeated choice were carried out in stationary environments, in which the options’ values stayed unchanged throughout the choice process. Only few studies have incorporated changes in the options’ values as their main focus of research.Footnote 1 The pioneering work of Rakow and Miler (2009), and the work of Lejarraga, Lejarraga, and Gonzalez (2014) that came in its wake, are notable exceptions for the case of full feedback. People chose repeatedly between two binary gambles; the value of one gamble remained unchanged throughout the experiment, while another gamble, which started out having a higher (or lower) value than the fixed one, at some point started to change in value, gradually becoming lower (or higher) than the other. In these studies, the researchers found that individual decision makers (and even more so, groups of decision makers under certain conditions (Lejarraga et al., 2014) were quite good at detecting changes. Other studies in which a change in the options’ value occurred are Hart et al. (2016) and Kareev et al. (2014). In a task involving choice between two gambles the values of both changed from high to low or vice versa, abruptly, Hart et al. (2016) observed quick adaptation to change. Quick reaction to change was also found in an interactive choice task in which an abrupt change in the payoff matrix of a counterpart resulted in a switch from one game to another (Kareev et al., 2014). In all four studies just cited, the change was unannounced but, as already mentioned, the feedback concerning the outcome of the choice options was full: The counterfactual outcome (the forgone payoff) was either explicitly stated or could be easily inferred (in the study by Kareev et al., 2014).
Choice in a changing environment when feedback is limited to the chosen options, coined “restless bandits,” has also been studied theoretically (e.g., Whittle, 1988) and experimentally (e.g., Biele, Erev, & Ert, 2009; Speekenbrink & Kostantinidis, 2015), exposing the participants to two different sources of uncertainty. These studies attempted to find a model that best fitted behavior while testing assumptions about participants’ risk aversion, their sensitivity to transition probabilities, and their exploration behavior.
As in our previous studies of repeated choice between risky alternatives (Avrahami et al., 2014; Hart et al., 2016; Kareev et al., 2014), we explored behavior not only through summary statistics but also through the dynamics of choice. In saying that, we mean that we investigated what aspects of a current outcome drive the subsequent choice. The reasons for focusing on the effects of the most recent experience are twofold: One is that, irrespective of how long a prior experience may have an effect on the subsequent choice, the relevant aspects should be evident most strongly in the recent experience. Second, in one of our previous studies (Avrahami & Kareev, 2011) we had compared how well different windows of past experience (with different weights of recency) predicted the upcoming choice. We found that the outcome of the most recent decision was a good predictor of the subsequent choice (see also Ashby & Rakow, 2014; Biele et al., 2009). In the present study, we did not attempt to fit a model to the choice sequence; rather, we explored the manner in which the most recent choice experience affects subsequent choices.
To test these questions, we used a set of options structured like those used in all of our aforementioned studies of choice between risky options: two options that differed in their levels of risk, such that the possible outcome values of the riskier option were more extreme than the values of the safer option, as is presented in Fig. 1. The probabilities with which the two outcomes of each option occurred were such that the variance of the option with the more extreme values, which we regarded as the riskier of the two, was larger than the variance of the other, which we regarded as the safer of the two.

Relationship between the possible outcome values of the riskier option (left) and the values of the safer option (right)
With such a payoff structure, the low value of the riskiest option was always the worst of all possible outcomes, and the high value of the riskiest option was always the best. As a result, if participants were provided with feedback both about the option they chose and about the option they did not, they could easily learn whether or not they had missed a particular opportunity. Notice, however, that if this is what they cared about most, their subsequent choice between the two options should depend only on the outcomes of the riskier option in the current round—whether it was chosen or not. That is, when the riskier option turned out to be High(R), it would likely be chosen in the next round, and if the riskier option turned out to be Low(R), it would not. In addition, if this is indeed what participants did, then the frequency of choosing the riskier option should correspond to the likelihood of its high value. Note, however, that this assumes that what people care about most is whether or not an opportunity was missed; if they cared as much about the size of the miss, then High(S) and Low(S), the outcomes of the safer option, would also have an effect, and the likelihood of High(R), the high outcome of the risky option, would no longer be the sole determiner of the likelihood of choosing the riskier option.
In our previous studies, the outcome in the riskier option was found to be the main determiner of the round-to-round choice dynamics. The overall frequency of choosing the riskier option was related to the likelihood of its high outcome High(R). As such, the results indicated that the size of a miss was only of secondary importance.
In the present study, we expanded the scope of the paradigm and tested it in a number of new situations. First, unlike in most previous studies, change was determined by a Markov chain with a certain change probability, and therefore took place several times across the experiment. Second, the choice options either differed in overall value or had the same overall value. In the former case, one option was better than the other, and a change involved a swap in their values; in the latter case, both options had either a high or a low value, and changes involved transitions between “good” and “bad” worlds. Third, the size of the difference between the good and bad options (when they differed in value) or between the goodnesses of the pairs of options in different states (when their values were the same) was also manipulated.
All of these variable combinations occurred with one of the two feedback levels: either full feedback on both options or partial feedback of only the outcome of the chosen option.
In line with the previously supported hypothesis that choice is driven mainly by reaction to a recently missed opportunity, we could sketch predictions for the effect (or lack of effect) of the manipulated variables. Notice that these predictions hold, for the moment, only for situations in which full feedback is available. Predictions for partial feedback are less straightforward and will be discussed afterward.
-
1.
The probability of change would not be expected to have an effect on behavior if behavior is indeed mainly determined by the most recent outcome. Such a result would be in line with the results reported by Massey and Wu (2005), who observed that overall characteristics of the change process, such as expected rate of change, hardly influenced the participants’ behavior—a phenomenon they termed system neglect.
-
2.
If the retrospective perception of a choice as a missed opportunity is determined by the outcome value of the riskier option, then people would choose the riskier option in the proportion of its high value, irrespective of the relative values of the two options. In the present study, this meant that changes in the values of the options—not only when the options swapped their relative goodness, but even when they occurred in tandem—would result in differences in the likelihoods of choosing the riskier option.
-
3.
If what people care about is mostly whether or not they have missed an opportunity, and not the size of the miss, the difference in value between options would not be expected to have an effect on the dynamics of behavior. It might, however, affect the asymptotic level of the choice reached and, of course, participants’ earnings. This would occur because, if participants detected the better option and tended to choose it, then the higher the better option was, the more they would earn.
Thus, effects of the manipulated variables would be expected on certain of the summary statistics, but not on round-to-round changes in choices.
Regarding the effect of the feedback manipulation, the predictions are not entirely clear, and our study is more exploratory in nature. When feedback is full, participants immediately see whether their current choice has been good or not: If the outcome value of the chosen option is lower than that of the unchosen option, they have missed an opportunity to earn more. Such a realization may give rise to feelings of regret for not having acted differently, and as a result may push participants to switch choices in the next round. This is not the case when feedback is partial, so that participants observe only the outcome of the chosen option, but not the outcome of the unchosen option.
Note, however, that the last sentence needs to be qualified: Even in the partial-feedback condition, after having chosen the riskier option, the participants can infer whether or not the counterfactual outcome was better than the actual outcome (though not by how much), because the task constraints imply that the outcome values of the safer option are either both better (if the riskier outcome came out low) or both worse (if the outcome came out high). Such inference is impossible if the participant has chosen the safer option, because in that case no information is available regarding a possible missed opportunity.
It is thus an open question what aspects of experience might influence participants’ reactions in the partial-feedback condition. One possibility is that they would react only to the most salient part of the available information—namely, to the outcome of the chosen option: feeling happy when it came out high and unhappy when it came out low. In this case, no memory would be required, and choices should follow a win–stay lose–shift rule: Participants should tend to switch their choice when obtaining a low value, and tend to stay when obtaining a high value (also termed positive recency; see Biele et al., 2009). Another possibility is that memory comes into play. Participants might retain some memory of the previous outcome value obtained with the option currently not chosen; namely, they might remember the option’s value when it was last chosen and use it as a proxy for the value that could have been earned. If so, then the last outcome of the unchosen option would also affect the subsequent choice. Moreover, it could be compared to the outcome value of the chosen option, and a sense of missed opportunity might arise from this comparison.
To summarize, by focusing on both aggregated choice behavior and the round-to-round dynamics of choice, we attempted to uncover the main determiners of choice between uncertain options in changing environments, under conditions of both partial and full feedback.
Method
Overview
Participants made 160 incentivized choices between two binary-valued options, one riskier than the other. The possible outcome values were High(R) = 9, Low(R) = –3 for the riskier option, and High(S) = 7, Low(S) = –1 for the safer option. On every round, the outcome of the chosen option was added to the participant’s account, which was exchanged for money at the end of the experimental session. These values remained fixed throughout the experiment, but their likelihood of occurrence changed several times. These changes were not announced and, because the possible outcome values remained constant, the change in likelihood could not be observed directly. Following every choice, feedback was provided: either partial—pertaining only to the outcome of the chosen option—or full—pertaining to the outcomes of both the chosen and nonchosen options. The likelihood that a change occurred in a round was either .025 or .050 (resulting, on average, in four or eight changes per session, respectively). With regard to the options’ expected values (EVs), two pairs of the likelihood of a high outcome of the riskier option were used: In the high-spread condition, these values were 40 and 60 percent, resulting in EVs of 1.8 or 4.2, respectively; in the low-spread conditions, these values were 45 and 55 percent, resulting in EVs of 2.4 and 3.6, respectively. The likelihoods of the values in the safer options were such that the possible EVs of the safer option would assume the same values as those of the riskier option. The EVs of the two options changed concurrently, but their EVs were either the same, in which case the change was from both having a high EV to both having a low EV, or vice versa (i.e., changing between a “good” and a “bad” world, as in Hart et al., 2016), or different, in which case one option had a high and the other a low EV. In the latter case, a change involved a swap between the two options’ EVs. The difference in EVs, either between periods (when they were the same) or between options (when they were different), was either 2.4 or 1.2. Table 1 presents all of the values, probabilities, and resulting EVs of the options, and Fig. 2 presents the possible changes in the options’ EVs across the experiment.

Example of the expected values (EVs) of the options in four periods between which a change occurred
Recall that the outcome values in the riskier option were 9, –3, and those in the safer option were 7, –1. When the riskier option had an EV of 4.2, the probability of the value 9 was .60, and when the safer option had an EV of 4.2, its probability of the value 7 was .65. When the riskier option had an EV of 3.6, the probability of the value 9 was .55, and when the safer option had an EV of 3.6, the probability of the value 7 was .575. In the corresponding low EVs, the probabilities were the complements of these.
Design and participants
Four variables were manipulated between participants: feedback (partial vs. full), likelihood of a change (.050 vs. .025), EV sameness (options’ EVs same vs. different), and difference in EV (large [2.4] vs. small [1.2]). The factorial combination of these variables resulted in 16 experimental conditions.
Participants were recruited from various social networks. The sampling process was based on self-selection: Because payment was done offline, on campus, only people who had some business at the university participated. Participants who entered the program were randomly assigned to one of the 16 conditions available at the time of registration. The total number of participants was 427, of whom 241 (56%) were female. Among this total, 250 participants experienced the partial- and 177 the full-feedback condition; for 237 participants both options had the same EV, and for 190 they differed; the probability of a change was .050 for 188 participants, and .025 for 239. The change in EV was small for 225 participants, and large for 202 of them. The analyses of variance (ANOVAs) reported below all used an unweighted means model, so differences in the sizes of a group could be expected to be of little consequence.
Participants earned, on average, 20.0 New Israeli shekels (NIS, with 1 NIS worth about $0.25 at the time the experiment was conducted). Earnings ranged from a minimum of 16 to a maximum of 24 NIS.
Procedure
The experiment was computerized and available on the Internet. First, participants saw a screen with the instructions and had to enter their gender and ID. Obtaining their ID allowed us to verify the participants’ identities at the time of payment, as well as to block them from participating more than once. Then the choice rounds began: Two buttons, representing the two options, were drawn on the screen, and participants had to choose by clicking one of them. After making their choice and confirming it (by pressing an OK button that appeared below the two options’ buttons) or after a timeout occurred (if no response was provided in 10 s; timeouts occurred in only 0.02% of the rounds), feedback was provided and a new round began. The outcome value of the chosen option was added to the participant’s total earnings; in the case of a timeout, the value earned was always –3. Points earned were exchanged for money at the end of the experiment at a rate of 25 points per 1 NIS. A translation of the instructions from Hebrew into English is provided in Appendix A. The left–right locations of the riskier and safer options were randomly determined for each participant.
Results
Before turning to the dynamics of choice, we shall present summary statistics pertaining to participants’ behavior, from which some conclusions about the effects of the manipulated variables could already be drawn. We shall first examine the participants’ earnings in the two feedback conditions. We shall see whether feedback level, the difference in EVs, and the frequency of change affected earnings. We also analyze the frequency of switching between options, as a proxy for exploration in the partial-feedback condition, to see whether feedback or any of the other manipulated variables had an effect. Furthermore, we compare the frequency of switching in a “good” versus a “bad” world, which is meaningful only in the same-EV conditions. We then examine the rate at which participants chose the better option (the one with higher EV)—which is meaningful only in the different-EVs conditions—and the frequency with which participants chose the riskier option—which is illuminating only in the same-EV conditions.
Earnings
Participants, naturally, earned the average (3) when both options had the same EV; they earned 3.113 when the options differed in EV (cf. Table 1). The latter value is significantly different from 3 [F(1, 181) = 61.924, p < .001, η p 2 = .255]. The size of the difference in EVs (which determined how high the EV of the better option was) also had a significant effect: Participants earned 3.061 in the smaller spread, when the better option’s EV was 3.6, as compared to 3.164 when the better option’s EV was 4.2 [F(1, 181) = 13.016, p = .001, η p 2 = .067]. Earnings did not vary significantly between different probabilities of change [F(1, 181) = 1.919, p = .168, η p 2 = .010]. Most interestingly, participants’ earnings were similar when they received either partial or full feedback [F(1, 181) = 1.131, p = .289, η p 2 = .006)! This was so in spite of the fact that they had much less information about the current state of their environment in the partial-feedback case.
Although the differences in earnings may seem small, they are still impressive, given that (a) the differences in the probabilities of the good outcome were rather small, with a maximum at 60/40, and (b) choice immediately after a change was, naturally, mostly of the less-valuable option (which had been the better one until the moment of change).
Choosing the option with a higher EV
Since the participants in the conditions with different EVs earned on average more than the mean of 3, they must have noticed the better option at some point after a change. We therefore inspected the rate at which participants chose the better option on the very round of the change (i.e., just before the change could be experienced, practically at the end of stretches of rounds of a certain value combination). This was found to be .55, which is significantly different from chance [F(1, 180) = 14.35, p < .001, η p 2 = .074].Footnote 2 None of the manipulated variables had a significant effect on this measure (the Fs of all main effects were less than 1).
It is noteworthy that the reaction to change was immediate: On the very first round after it had become the better option of the two, the proportion of choices of the now-better option rose from .450 (see note 2) to .493 (pooling across all changes experienced by all participants, Z = 3.127, p = .0009).
Choosing the riskier option when both options have the same EV Footnote 3
As we have already reasoned above, if participants care only about whether or not they have missed an opportunity, when both values of the safer option lie between the two values of the riskier option, the frequency of their choosing the riskier option should be commensurate with the likelihood of its high value. As we explained above, this is the telltale sign of reaction to missed opportunities.
In the present study, we expected a similar effect to appear several rounds after a change had occurred. Because this prior evidence was only based on full feedback, it remained an open question whether a similar pattern would be observed with partial feedback—namely, whether the pattern of the choice rate of the riskier option corresponding to the likelihood of the high outcome in that option would be observed in the partial-feedback condition as well. The relation between the likelihood of a high value in the riskier option and the likelihood of choosing the risky option—from the sixth round after a change had occurred and onward, shown separately for the two feedback conditions—is depicted in Fig. 3.

Rates of choosing the riskier option as a function of the likelihood of the high outcome value in that option (for the same-EV conditions)
As is evident from the figure, the correspondence is quite strong in the full-feedback condition [for the linear contrast: F(1, 9413) = 46.46, p < .001; contrast estimate = .086, CI(95%) = .118, .055],Footnote 4 replicating prior findings. It should be recalled that the line representing the full-feedback condition would have been flat if choices were only related to reward (since the rewards were identical in the two options), and negatively sloped if choices were following the win-stay–lose-shift rule.Footnote 5
In the partial-feedback condition, however, no such relation was observed, as is evident from the flat curve in Fig. 3. Here the rate of choosing the riskier option was unrelated to the likelihood of the riskier option’s high outcome [for the linear contrast: F(1, 18840) = .34, n.s.; contrast estimate = –.003, CI(95%) = –.017, .011]. We take this as an indication that the dynamics in the partial-feedback condition are different from those in the full-feedback condition.
In this context, it is worth noting that, overall, participants preferred the riskier option more in the full-feedback condition (choosing it in .53 of the rounds) than in the partial-feedback condition (choosing it in .46 of the rounds) [F(1, 406) = 16.840, p < .001, η p 2 = .040]. This finding replicates those of Newell et al. (2016), who found that with a higher level of information, participants became less risk-averse than with lower levels. The reason for this difference will become clearer when we explore the dynamics of choice in the two conditions, to which we turn now.
Rate of switching
The mean of switching rounds was .337. None of the manipulated variables had a significant effect on this rate (all Fs < 1.2).
Second, we compared the rates of switching for the same-EV conditions, in periods when both EVs were high versus periods when both were low (i.e., in a “good” versus a “bad” world). Here, too, although switching was somewhat higher in a bad than in a good world (M = .34 vs. .33), the difference was not significant [F(1, 228) = 1.377, p = .242, η p 2 = .006], nor did the interaction between world and feedback reach significance (F < 1). Some hint of an effect of feedback was found, with more switching in the partial- than in the full-feedback condition (M = .35 vs. .31), but this difference also did not reach significance [F(1, 228) = 2.202, p = .139, η p 2 = .010].
The dynamics of choice
We start by considering the results for the full-feedback condition. We performed this analysis to find out (a) whether the results replicate previous findings and (b) whether they extend to a condition of different EVs. Figure 4 depicts the likelihood of choice-switching from the current to the next round as a function of the outcomes in the chosen and the unchosen options. Figures 4.1.1 and 4.1.2 provide the likelihoods of switching after choosing the riskier and the safer options, respectively, in the same-EV condition. One can see that, having chosen the riskier option (Fig. 4.1.1), the main determiner of switching concerns the outcome in the chosen—that is, the riskier—option. The outcome in the unchosen, safer, option hardly has an effect. The pattern is completely different after having chosen the safer option (Fig. 4.1.2). Here, the main determiner of switching rate is the outcome in the unchosen, riskier option, although some difference in rates is also due to the outcome in the chosen, safer, option. In either case, the outcome in the riskier option is what mainly determines switching—irrespective of the option chosen.

Rates of switching in the full-feedback condition as a function of the outcome values of the chosen and the unchosen options: (4.1.1) following a choice of the riskier option in the same-EV condition; (4.1.2) following a choice of the safer option in the same-EV condition; (4.2.1) following a choice of the riskier option in the different-EV condition; (4.2.2) following a choice of the safer option in the different-EV condition
Figures 4.2.1 and 4.2.2 present the same information for the different-EV conditions. It is easy to see that the dynamics are practically identical to those in the same-EV condition.
To provide a stringent statistical test, the data underlying the figures were submitted to an ANOVA on the probabilities of switching, with choice and the outcome in both options as within-subjects variables and sameness of EV as a between-subjects variable. To do that, we first calculated the mean switch proportion for every participant in each of the eight combinations of choice and outcome (two possible choices, with two possible outcomes in the chosen option and two in the unchosen, as they appear in Fig. 4). The ANOVA revealed a strong effect of the outcome in the riskier option on the next choice [F(1, 167) = 230.18, p < .001, η p 2 = .580], and a significant but weaker effect of the outcome in the safer option [F(1, 167) = 70.34, p < .001, η p 2 = .296]. Importantly, the three-way interaction between choice and the two outcomes was negligible (F < 1), providing no support for the possibility that the size of the difference also mattered.
The sameness of the EV did not have any effect (no main effect and no interaction with any of the other variables). One may wonder how it is possible that the manipulations would have no effect from round to round, but when the data were aggregated (across rounds) into summary statistics, some effect did appear. This is the whole point of our thesis: When people’s choices are just reactions to outcomes, but the frequency with which different outcomes occur changes, the likelihood of people’s choosing each option should also change.
Let us now turn to the corresponding results for the partial-information condition. Figures 5.1.1 and 5.1.2 present the results for the same-EV condition; Figs. 5.2.1 and 5.2.2 pertain to the different-EV condition. Notice that, again, there is practically no difference between the two pairs of patterns. However, it is obvious that the patterns of results are systematically different from those in the full-information condition. Here, in the partial-feedback condition, all four graphs have a similar pattern, with switching hardly depending on which option had been chosen. The switching rate is low only when the value of the chosen option turned out high and the last obtained value of the unchosen option was low. In all other cases, rates of switching are more or less the same. For example, unlike in the full-feedback condition, here, obtaining –1 and recalling –3 was not a good enough reason to repeat the current choice.
Does the pattern of results support either of the two accounts offered above concerning the impact of partial feedback on choice behavior?
-
1.
Reacting only to the outcome in the chosen option. The marked differences due to the last-obtained outcome in the unchosen option (between adjacent darker and lighter bars in the figures) are not compatible with the possibility that choices in the partial-feedback condition were exclusively determined by the outcome of the chosen option. Apparently, the last obtained value of the currently unchosen option (and the one most likely to have been remembered) also affected the decision of whether or not to switch choices.
-
2.
Reacting to missed opportunities (with memory-based counterfactual). If people remembered well the last value obtained of the currently unchosen option, then one would expect to see a pattern similar to that in the full-feedback condition. Comparing Figs. 4 and 5 reveals that this account is also not supported. In fact, it seems that the outcomes (experienced or remembered) of both the riskier and the safer options exert the same effect: The likelihood of a switch is particularly low when the actual outcome of the chosen option is high and the last value previously obtained (and likely remembered) of the currently unchosen option is low. The likelihood of a switch is otherwise pretty high; it is, nevertheless, somewhat higher when the last experienced outcome is high than when it is low. This means that in the partial-feedback condition an obtained low and/or a remembered high were both reasons to switch. This is in contrast to the full-feedback condition, in which when participants obtained the lowest outcome (that of the riskier option), they found reason to switch almost independently of the outcome in the safer option, and they hardly found reason to switch when they had obtained the highest outcome.
Fig. 5 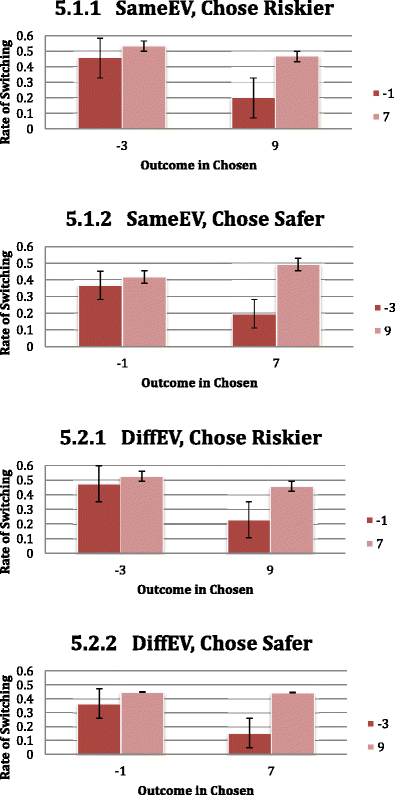
Rates of switching in the partial-feedback condition as a function of the outcome value of the chosen option and the most recently obtained value of the unchosen option: (5.1.1) following a choice of the riskier option in the same-EV condition; (5.1.2) following a choice of the safer option in the same-EV condition; (5.2.1) following a choice of the riskier option in the different-EV condition; (5.2.2) following a choice of the safer option in the different-EV condition

An ANOVA on the probability of switching, similar to that for the full-feedback condition, was conducted for the partial-feedback condition, with choice and the outcomes for both options (either currently or previously experienced) as within-subjects variables and sameness of the EVs as a between-subjects variable. The analysis revealed that the outcome in the riskier option and that in the safer option had relatively similar effects [F(1, 209) = 141.536, p < .001, η p 2 = .404, and F(1, 209) = 91.657, p < .001, η p 2 = .305, respectively]. We also observed a significant interaction between the two variables [F(1, 209) = 38.554, p < .001, η p 2 = .156]. Unlike in the full-feedback condition, here the three-way interaction of choice and the two outcomes also reached significance [F(1, 209) = 10.916, p = .001, η p 2 = .050], indicating that the size of the difference also played a role. As can be seen in Fig. 5, these interactions are driven by the particularly low tendency to switch when the actual outcome is high and the (likely) remembered outcome is low. Sameness of the EVs once again did not have any effect on the tendency to switch.
One may wonder to what extent the average patterns of reactions shown in the figures represent the individual participants who took part in the study. To find out, we used a two-step cluster analysis on the switching rates in the eight combinations of choices and outcomes of the two options—separately for the two levels of feedback.
In both feedback conditions, three clusters were detected: a large cluster (representing 56.8% in the full-feedback condition and 46.4% in the partial), and two smaller clusters. The larger clusters correspond (no wonder) to the overall pattern shown in Figs. 4 and 5. The average switching rates in these clusters were .41 and .52 in the full- and partial-feedback conditions, respectively. The other two represent participants with strong inertia (with switching rates of .22 and .36 in the full- and partial-feedback conditions, respectively) and participants with a strong tendency to switch (with switching rates of .55 and .58 in the full- and partial-feedback conditions, respectively). Participants in the latter, smaller clusters were little sensitive to the outcome combinations.
Being able to inspect the cluster of the majority of participants who were sensitive to outcome combinations, we could reestablish that most of the participants in the full-feedback conditions were mostly sensitive to the mere fact of missing an opportunity, but only little sensitive to its size. Furthermore, we could now say with confidence that in the partial-feedback condition, the participants forming the largest cluster were indeed reactive to the last experienced outcome of the nonchosen option, taking into account not only the mere fact of a miss, but also its size.
Discussion
When designing the present study, we had clear predictions for the conditions in which both the outcome of the chosen option and that of the unchosen option were known (the full-feedback condition). We expected choices to be strongly determined by the occurrence of a missed opportunity in the recent decision. Given the structure of the environment—with two options differing in riskiness and with the outcome values of the safer option embedded within those of the riskier option—choice would be determined mostly by the outcome in the riskier option. Therefore, the likelihood of choosing either option would be related to the likelihood of the outcome values in the riskier option. This should also have determined to what degree the better option would be chosen. Notice that these predictions were expected to hold in spite of the frequent changes in the likelihoods of the outcome values along the experiment.
We did not start with fully specified predictions as to what would drive choice when only the outcome of the chosen option was known (the partial-feedback condition). Thinking of learning models that assume the accumulation of information from past experience, whether the whole experience (either weighted or not) or just a sample from that experience, it is clear that in the partial-feedback condition, participants receive only half the information that they receive in the full-feedback condition. One might therefore expect to see similar patterns in both conditions, but a weaker one in the partial-information condition. Another possibility is that participants ignore the previous outcomes of the unchosen option and react only to the outcome of the chosen one. Still another possibility is that participants memorize the last outcome in the currently unchosen option and compare their reward to what they might have obtained—with the remembered value serving as a proxy for the counterfactual reward.
The results support neither of the first two hypotheses. At the same time, they offer some support to the third, revealing a new pattern of reactions to outcomes: Participants do react to both the outcome value of the chosen option and the last-experienced value of the unchosen option. Unlike in the full-feedback condition, though, participants are also somewhat sensitive to the size of the difference in the two values. This is most evident in their tendency to repeat a choice when the outcome value of the chosen option is high and the value last experienced in the nonchosen option is low. Unlike in the full-feedback condition, they do so both after choosing the riskier option and after choosing the safer one.
As we mentioned in the introduction, because of the structure of the set of options, the participants could know that they missed an opportunity when they chose the riskier option and obtained its low outcome value, even in the partial-feedback condition. This was because that outcome was the lowest value possible. They could not know whether they missed when they chose the safer option. One would therefore expect them to switch more often after receiving the low outcome for the riskier option than after receiving the low outcome for the safer one. Collapsing the data in the partial-feedback condition over the conditions of same and different EVs, and examining only the cases of receiving the low outcome in the chosen option, we see that switching was indeed more frequent after a low in the riskier option than after a low in the safer one [F(1, 394) = 10.475, p = .001, η p 2 = .026]. This result can be seen as a (faint) indication that regret for a missed opportunity was at play.
The difference in choice dynamics between the two feedback conditions eliminated the relation between the outcome probabilities and choice of the riskier option. At the same time, the overall choices of the better option, and hence levels of earnings, were practically the same in both information conditions. Thus, in both information conditions we found that participants were reactive to the recent outcome, which, in turn, allowed them to adapt quickly to changes in their environment.
In view of the ubiquity of change in the environment—such that the best alternative today may not remain so tomorrow—we suggest reconsidering using the measure of optimality as a benchmark for repeated choice behavior, and using instead a measure of how quickly change is reacted to. To allow us to study adaptation to new situations not only from the very first periods of experience, experiments should include changes in the values of the options comprising the choice sets.
Notes
Note that the value of a .55 probability of choosing the better option on the round on which a change occurred means that, at the point of change, the proportion of what had now became the more profitable choice was .45.
We report the relation between choosing the riskier option and EV only for the same-EV condition because such a relation would be trivial when the EVs are different.
Unlike all other analyses reported in the article, for this analysis we used round, rather than subject, as the unit of analysis. This was done for two reasons: First, aggregating first within subjects and then over subjects would give too much weight to subjects who contributed only a few observations of certain kinds (because of extreme risk attitudes—whether positive or negative). Second, observations at the .4 and .6 points came from participants in the “large differences” conditions, and those in the .45 and .55 points from participants in the “small differences” conditions, complicating the statistical analysis.
This is so because the relative frequency of low outcomes (a “loss”) for both the riskier and safer options changes with the “goodness” of the world. For example, in the best world, the low outcome occurs 40% of the time for the riskier option and 35% of the time for the safer; in the worse world, the low outcome occurs 60% of the time for the riskier option and 65% of the time for the safer. As a result, according to the win-stay–lose-shift rule, the safer option would be chosen more often in the good world and less often in the bad one.
References
Ashby, N. J. S., & Rakow, T. (2014). Forgetting the past: Individual differences in recency in participantive valuations from experience. Journal of Experimental Psychology: Learning, Memory, and Cognition, 4, 1153–1162. doi:10.1037/a0036352
Avrahami, J., & Kareev, Y. (2011). The role of impulses in shaping decisions. Journal of Behavioral Decision Making, 24, 515–529.
Avrahami, J., Kareev, Y., & Hart, E. (2014). Taking the sting out of choice: Diversification of investments. Judgment and Decision Making, 9, 373–386.
Barron, G., & Erev, I. (2003). Small feedback-based decisions and their limited correspondence to description-based decisions. Journal of Behavioral Decision Making, 16, 215–233.
Biele, G., Erev, I., & Ert, E. (2009). Learning, risk attitude and hot stoves in restless bandit problems. Journal of Mathematical Psychology, 53, 155–167.
Brown, S., & Steyvers, M. (2005). The dynamics of experimentally induced criterion shifts. Journal of Experimental Psychology: Learning, Memory, and Cognition, 31, 587–599. doi:10.1037/0278-7393.31.3.587
Brown, S. D., & Steyvers, M. (2009). Detecting and predicting changes. Cognitive Psychology, 58, 49–67. doi:10.1016/j.cogpsych.2008.09.002
Brown, S. D., Steyvers, M., & Hemmer, P. (2007). Modeling experimentally induced strategy shifts. Psychological Science, 18, 40–45.
Camilleri, A. R., & Newell, B. R. (2011). When and why rare events are underweighted: A direct comparison of the sampling, partial feedback, full feedback and description choice paradigms. Psychonomic Bulletin & Review, 18, 377–384. doi:10.3758/s13423-010-0040-2
Fiedler, K., Kareev, Y., Avrahami, J., Beier, S., Kutzner, F., & Hütter, M. (2016). Anomalies in the detection of change: When changes in sample size are mistaken for changes in proportions. Memory & Cognition, 44, 143–161. doi:10.3758/s13421-015-0537-z
Gans, N., Knox, G., & Croson, R. (2007). Simple models of discrete choice and their performance in bandit experiments. Manufacturing and Service Operations Management, 9, 383–408.
Gittins, J. C. (1979). Bandit processes and dynamic allocation indices. Journal of the Royal Statistical Society: Series B, 41, 148–177.
Grosskopf, B., Erev, I., & Yechiam, E. (2006). Forgone with the wind: Indirect payoff information and its implications for choice. International Journal of Game Theory, 34, 285–302.
Hart, E., Kareev, Y., & Avrahami, J. (2016). Good times, bad times: Reversal of risk preferences. Decision, 3, 132–145. doi:10.1037/dec0000026
Hertwig, R., Barron, G., Weber, E., & Erev, I. (2004). Decisions from experience and the effect of rare events in risky choice. Psychological Science, 15, 534–539. doi:10.1111/j.0956-7976.2004.00715.x
Hertwig, R., & Erev, I. (2009). The description–experience gap in risky choice. Trends in Cognitive Sciences, 13, 517–523.
Kareev, Y., Avrahami, J., & Fiedler, K. (2014). Strategic interactions, affective reactions, and fast adaptations. Journal of Experimental Psychology: General, 143, 1112–1126.
Lejarraga, T., Lejarraga, J., & Gonzalez, C. (2014). Decisions from experience: How groups and individuals adapt to change. Memory & Cognition, 42, 1384–1397. doi:10.3758/s13421-014-0445-7
Massey, C., & Wu, G. (2005). Detecting regime shifts: The causes of under-and overreaction. Management Science, 51, 932–947.
McNamara, J. M., & Houston, A. I. (2009). Integrating function and mechanism. Trends in Ecology and Evolution, 24, 670–675. doi:10.1016/j.tree.2009.05.011
Newell, B. R., Rakow, T., Yechiam, E., & Sambur, M. (2016). Rare disaster information can increase risk- taking. Nature Climate Change, 6, 158–161.
Osman, M. (2010). Controlling uncertainty: A review of human behavior in complex dynamic environments. Psychological Bulletin, 136, 65–86.
Rakow, T., Demes, K. A., & Newell, B. R. (2008). Biased samples not mode of presentation: Re-examining the apparent underweighting of rare events in experience-based choice. Organizational Behavior and Human Decision Processes, 106, 168–179.
Rakow, T., & Miler, K. (2009). Doomed to repeat the successes of the past: History is best forgotten for repeated choices with nonstationary payoffs. Memory & Cognition, 37, 985–1000. doi:10.3758/MC.37.7.985
Rakow, T., & Newell, B. R. (2010). Degrees of uncertainty: An overview and framework for future research on experience-based choice. Journal of Behavioral Decision Making, 23, 1–14.
Rakow, T., Newell, B. R., & Wright, L. (2015). Forgone but not forgotten: The effects of partial and full feedback in “harsh” and “kind” environments. Psychonomic Bulletin & Review, 22, 1807–1813. doi:10.3758/s13423-015-0848-x
Speekenbrink, M., & Kostantinidis, E. (2015). Uncertainty and exploration in a restless bandit problem. Topics in Cognitive Science, 7, 351–367.
Speekenbrink, M., & Shanks, D. R. (2010). Learning in a changing environment. Journal of Experimental Psychology: General, 139, 266–298.
Thorndike, E. L. (1927). The law of effect. American Journal of Psychology, 39, 212–222.
Whittle, P. (1988). Restless bandits: Activity allocation in a changing world. Journal of Applied Probability, 25A, 287–298.
Yechiam, E., & Busemeyer, J. R. (2006). The effect of foregone payoffs on underweighting small probability events. Journal of Behavioral Decision Making, 19, 1–16.
Author note
The authors gratefully acknowledge the support of the German Israeli Foundation, Grant GIF-2008/120, to all three of them.
Author information
Authors and Affiliations
Corresponding author
Appendix: A translation of the instructions to participants
Appendix: A translation of the instructions to participants
In this experiment you have to choose between two options. After choosing you will learn the value of the option you chose and this value will be added to the points you collect.
During the experiment two rectangles will be displayed repeatedly on the screen and you will have to choose one of them. After choosing, a number will be shown on the rectangle of your choice representing the number of points you won (or lost) in the round.
All in all there will be 160 rounds in the experiment.
At the end, the points will be exchanged for NIS; every 25 points are worth one NIS.
Please note:
You have to perform the experiment in one go, without breaks. A round in which no rectangle is chosen, in a reasonable time, will result in loss of points and transition to the next round.
Please enter the experiment only once.
It will be possible to get the payment, when showing a student’s ID, during the month of . . . in room . . . at the department of . . . on days . . . between time . . . and time . . .
Thank you and good luck!
Rights and permissions
About this article

Cite this article
Avrahami, J., Kareev, Y. & Fiedler, K. The dynamics of choice in a changing world: Effects of full and partial feedback. Mem Cogn 45, 1–11 (2017). https://doi.org/10.3758/s13421-016-0637-4
Published:
Issue Date:
DOI: https://doi.org/10.3758/s13421-016-0637-4