
Abstract
Single-case data often contain trends. Accordingly, to account for baseline trend, several data-analytical techniques extrapolate it into the subsequent intervention phase. Such extrapolation led to forecasts that were smaller than the minimal possible value in 40% of the studies published in 2015 that we reviewed. To avoid impossible predicted values, we propose extrapolating a damping trend, when necessary. Furthermore, we propose a criterion for determining whether extrapolation is warranted and, if so, how far out it is justified to extrapolate a baseline trend. This criterion is based on the baseline phase length and the goodness of fit of the trend line to the data. These proposals were implemented in a modified version of an analytical technique called Mean phase difference. We used both real and generated data to illustrate how unjustified extrapolations may lead to inappropriate quantifications of effect, whereas our proposals help avoid these issues. The new techniques are implemented in a user-friendly website via the Shiny application, offering both graphical and numerical information. Finally, we point to an alternative not requiring either trend line fitting or extrapolation.
Several features of single-case experimental design (SCED) data have been mentioned as potential reasons for the difficulty of analyzing such data quantitatively, for the lack of consensus regarding the most appropriate statistical analyses, and for the continued use of visual analysis (Campbell & Herzinger, 2010; Kratochwill, Levin, Horner, & Swoboda, 2014; Parker, Cryer, & Byrns, 2006; Smith, 2012). Some of the data features that have received the most attention are serial dependence (Matyas & Greenwood, 1997; Shadish, Rindskopf, Hedges, & Sullivan, 2013), the common use of counts or other outcome measures that are not continuous or normally distributed (Pustejovsky, 2015; Sullivan, Shadish, & Steiner, 2015), the shortness of the data series (Arnau & Bono, 1998; Huitema, McKean, & McKnight, 1999), and the presence of trends (Mercer & Sterling, 2012; Parker et al., 2006; Solomon, 2014). In the present article we focus on trends. The reason for this focus is that trend is a data feature whose presence, if not taken into account, can invalidate conclusions regarding an intervention’s effectiveness (Parker et al., 2006). Even when there is an intention to take the trend into account, several challenges arise. First, linear trend has been defined in several ways in the context of SCED data (Manolov, 2018). Second, there has been recent emphasis on the need to consider nonlinear trends (Shadish, Rindskopf, & Boyajian, 2016; Swan & Pustejovsky, 2018; Verboon & Peters, 2018). Third, some techniques for controlling trend may provide insufficient control (see Tarlow, 2017, regarding Tau-U by Parker, Vannest, Davis, & Sauber, 2011), leading applied researchers to think that their results represent an intervention effect beyond baseline trend, which may not be justified. Fourth, other techniques may extrapolate baseline trend regardless of the degree to which the trend line is a good representation of the baseline data, and despite the possibility of impossible values being predicted (see Parker et al.’s, 2011, comments on the regression model by Allison & Gorman, 1993). The latter two challenges compromise the interpretation of results.
Aim, focus, and organization of the article
Aim
The aim of the present article is to provide further discussion on four issues related to baseline trend extrapolation, based on the comments by Parker et al. (2011). As part of this discussion, we propose tentative solutions to the issues identified. Moreover, we specifically aim to improve one analytical procedure, which extrapolates baseline trend and compares this extrapolation to the actual intervention-phase data: the mean phase difference (MPD; Manolov & Solanas, 2013; see also the modification and extension in Manolov & Rochat, 2015).
Focus
Most single-case data-analytical techniques focus on linear trend, although there are certain exceptions. One exception is a regression-based analysis (Swaminathan, Rogers, Horner, Sugai, & Smolkowski, 2014), for which the possibility of modeling quadratic trend has been discussed explicitly. Another is Tau-U, developed by Parker et al. (2011), which deals more broadly with monotonic (not necessarily linear) trends. We stick here to linear trends and their extrapolation, a decision that reflects Chatfield’s (2000) statement that relatively simple forecasting methods are preferred, because they are potentially more easily understood. Moreover, this focus is well aligned with our willingness to improve the MPD, a procedure for fitting a linear trend line to baseline data. Despite this focus, three of the four issues identified by Parker et al. (2011), and the corresponding solutions we propose, are also applicable to nonlinear trends.
Organization
In the following sections, first we mention procedures that include extrapolating the trend line fitted in the baseline, and distinguish them from procedures that account for baseline trend but do not extrapolate it. Second, we perform a review of published research in order to explore how frequently trend extrapolation leads to out-of-bounds predicted values for the outcome variable. Third, we deal separately with the four main issues of extrapolating a baseline trend, as identified by Parker et al. (2011), and we offer tentative solutions to these issues. Fourth, on the basis of the proposals from the previous two points, we propose a modification of the MPD. In the same section, we also provide examples, based on previously published data, of the extent to which our modification helps avoid misleading results. Fifth, we include a small proof-of-concept simulation study.
Analytical techniques that entail extrapolating baseline trend
Visual analysis
When discussing how visual analysis should be carried out, Kratochwill et al. (2010) stated that “[t] he six visual analysis features are used collectively to compare the observed and projected patterns for each phase with the actual pattern observed after manipulation of the independent variable” (p. 18). Moreover, the conservative dual criteria for carrying out structured visual analysis (Fisher, Kelley, & Lomas, 2003) entail extrapolating split-middle trend in addition to extrapolating mean level. This procedure has received considerable attention recently as a means of improving decision accuracy (Stewart, Carr, Brandt, & McHenry, 2007; Wolfe & Slocum, 2015; Young & Daly, 2016).
Regression-based analyses
Among the procedures based on regression analysis, the last treatment day procedure (White, Rusch, Kazdin, & Hartmann, 1989) entails fitting ordinary least squares (OLS) trend lines to the baseline and intervention phases separately, and comparison between the two is performed for the last intervention phase measurement occasion. In the Allison and Gorman (1993) regression model, baseline trend is extrapolated before it is removed from both the A and B phases’ data. Apart from OLS regression, the generalized least squares proposal by Swaminathan et al. (2014) fits trend lines separately to the A and B phases, but baseline trend is still extrapolated for carrying out the comparisons. The overall effect size described by the authors entails comparing the treatment data as estimated from the treatment-phase trend line to the treatment data as estimated from the baseline-phase trend line.
Apart from the procedures based on the general linear model (assuming normal errors), generalized linear models (Fox, 2016) need to be mentioned as well in the present subsection. Such models can deal with count data, which are ubiquitous in single-case research (Pustejovsky, 2018a), specifying a Poisson model (rather than a normal one) for the conditional distribution of the response variable (Shadish, Kyse, & Rindskopf, 2013). Other useful models are based on the binomial distribution, specifying a logistic model (Shadish et al., 2016), when the data are proportions that have a natural floor (0) and ceiling (100). Despite dealing with certain issues arising from single-case data, these models are not flawless. Note that a Poisson model may present limitations when the data are more variable than expected (i.e., alternative models have been proposed for overdispersed count data; Fox, 2016), whereas a logistic model may present the difficulty of not knowing the floor or ceiling (i.e., the upper asymptote) or of forcing artificial limits. Finally, what is most relevant to the topic of the present text is that none of these generalized linear models necessarily includes an extrapolation of baseline trend. Actually, some of them (Rindskopf & Ferron, 2014; Verboon & Peters, 2018) consider the baseline data together with the intervention-phase data in order to detect when the greatest change is produced. Other models (Shadish, Kyse, & Rindskopf, 2013) include an interaction term between the dummy phase variable and the time variable, making possible the estimation of change in slope.
Nonregression procedures
MPD involves estimating baseline trend and extrapolating it into the intervention phase in order to compare the predictions with the actual intervention-phase data. Another nonregression procedure, Slope and level change (SLC; Solanas, Manolov, & Onghena, 2010), involves estimating baseline trend and removing it from the whole series before quantifying the change in slope and the net change in level (hence, SLC). In one of the steps of the SLC, baseline trend is removed from the nA baseline measurements and the nB intervention-phase measurements by subtracting from each value (yi) the slope estimate (b1), multiplied by the measurement occasion (i). Formally, \( {\overset{\sim }{y}}_i={y}_i-i\times {b}_1;i=1,2,\dots, \left({n}_A+{n}_B\right) \). This step does resemble extrapolating baseline trend, but there is no estimation of the intercept of the baseline trend line, and thus a trend line is not fitted to the baseline data and then extrapolated, which would lead to obtaining residuals as in Allison and Gorman’s (1993) model. Therefore, we consider that it is more accurate to conceptualize this step as removing baseline trend from the intervention-phase trend for the purpose of comparison.
Nonoverap indices
Among nonoverlap indices, the percentage of data points exceeding median trend (Wolery, Busick, Reichow, & Barton, 2010) involves fitting a split-middle (i.e., bi-split) trend line and extrapolating it into the subsequent phase. Regarding Tau-U (Parker et al., 2011), it only takes into account the number of baseline measurements that improve previous baseline measurements, and this number is subtracted from the number of intervention-phase values that improve the baseline-phase values. Therefore, no intercept or slope is estimated, and no trend line is fitted or extrapolated, either. The way in which trend is controlled for in Tau-U cannot be described as trend extrapolation in a strict sense.
Two other nonoverlap indices also entail baseline trend control. According to the “additional output” calculated at http://ktarlow.com/stats/tau/, the baseline-corrected Tau (Tarlow, 2017) removes baseline trend from the data using the expression \( {\overset{\sim }{y}}_i={y}_i-i\times {b}_{1(TS)};i=1,2,\dots, \left({n}_A+{n}_B\right) \), where b1(TS) is the Theil–Sen estimate of slope. In the percentage of nonoverlapping corrected data (Manolov & Solanas, 2009), baseline trend is eliminated from the n values via the same expression as for baseline-corrected Tau, \( {\overset{\sim }{y}}_i={y}_i-i\times {b}_{1(D)};i=1,2,\dots, \left({n}_A+{n}_B\right) \), but slope is estimated via b1(D) (see Appendix B) instead of via b1(TS). Therefore, as we discussed above for SLC, there is actually no trend extrapolation in the baseline-corrected Tau or percentage-of-nonoverlapping-corrected data.
Procedures not extrapolating trend
The analytical procedures included in the present subsection do not extrapolate baseline trend, but they do take baseline trend into account. We decided to mention these techniques for three reasons. First, we wanted to provide a broader overview of analytical techniques applicable to single-case data. Second, we wanted to make it explicit that not all analytical procedures entail baseline trend extrapolation, and therefore, such extrapolation is not an indispensable step in single-case data analysis. Stated in other words, it is possible to deal with baseline trend without extrapolating it. Third, the procedures mentioned here were those more recently developed or suggested for single-case data analysis, and so they may be less widely known. Moreover, they can be deemed more sophisticated and more strongly grounded on statistical theory than is MPD, which is the focus of the present article.
The between-case standard mean difference, also known as the d statistic (Shadish, Hedges, & Pustejovsky, 2014), assumes stable data, but the possibility of detrending has been mentioned (Marso & Shadish, 2015) if baseline trend is present. It is not clear that a regression model using time and its interaction with a dummy variable representing phase entails baseline trend extrapolation. Moreover, a different approach was suggested by Pustejovsky, Hedges, and Shadish (2014) for obtaining a d statistic—namely, in relation to multilevel analysis. In multilevel analysis, also referred to as hierarchical linear models, the trend in each phase can be modeled separately, and the slopes can be compared (Ferron, Bell, Hess, Rendina-Gobioff, & Hibbard, 2009). Another statistical option is to use generalized additive models (GAMs; Sullivan et al., 2015), in which there is greater flexibility for modeling the exact shape of the trend in each phase, without the need to specify a particular model a priori. GAMs that have been specifically suggested include the use of cubic polynomial curves fitted to different portions of the data and joined at the specific places (called knots) that divide the data into portions. Just like when using multilevel models, trend lines are fitted separately to each phase, without the need to extrapolate baseline trend.
A review of research published in 2015
Aim of the review
It has already been stated (Parker et al., 2011) and illustrated (Tarlow, 2017) that baseline trend extrapolation can lead to impossible forecasts for the subsequent intervention-phase data. Accordingly, the research question we chose was the percentage of studies in which extrapolating the baseline trend of the data set (across several different techniques for fitting the trend line) leads to values that are below the lower bound or above the upper bound of the outcome variable.
Procedure
Search strategy
We focused on the four journals that have published most SCED research, according to the review by Shadish and Sullivan (2011). These journals are Journal of Applied Behavior Analysis, Behavior Modification, Research in Autism Spectrum Disorders, and Focus on Autism and Other Developmental Disabilities. Each of these four journals published more than ten SCED studies in 2008, and the 76 studies they published represent 67% of all studies included in the Shadish and Sullivan review. Given that the bibliographic search was performed in September 2016, we focused on the year 2015 and looked for any articles using phase designs (AB designs, variations, or extensions) or alternation designs with a baseline phase and providing a graphical representation of the data, with at least three measurements in the initial baseline condition.
Techniques for finding a best fitting straight line
For the present review, we selected five techniques for finding a best-fitting straight line: OLS, split-middle, tri-split, Theil–Sen, and differencing. The motivation for this choice was that these five techniques are included in single-case data-analytical procedures (Manolov, 2018), and therefore, applied researchers can potentially use them. The R code used for checking whether out-of-bounds forecasts are obtained is available at https://osf.io/js3hk/.
Upper and lower bounds
The data were retrieved using Plot Digitizer for Windows (https://plotdigitizer.sourceforge.net). We counted the number and percentage of studies in which values out of logical bounds were obtained after extrapolating the baseline trend, estimated either from an initial baseline phase or from a subsequent withdrawal phase (e.g., in ABAB designs) for at least one of the data sets reported graphically in the article. The “logical bounds” were defined as 0 as a minimum and 1 or 100 as a maximum, when the measurement provided was a proportion or a percentage, respectively. Additional upper bounds included the maximal scores obtainable for an exam (e.g., Cheng, Huang, & Yang, 2015; Knight, Wood, Spooner, Browder, & O’Brien, 2015), for the number of steps in a task (e.g., S. J. Gardner & Wolfe, 2015), for the number of trials in the session (Brandt, Dozier, Juanico, Laudont, & Mick, 2015; Cannella-Malone, Sabielny, & Tullis, 2015), or for the duration of transition between a stimulus and reaching a location (Siegel & Lien, 2015), or the total duration of a session, when quantifying latency (Hine, Ardoin, & Foster, 2015). We chose a conservative approach, and did not to speculateFootnote 1 about upper bounds for behaviors that were expressed as either a frequency (e.g., Fiske et al., 2015; Ledbetter-Cho et al., 2015) or a rate (e.g., Austin & Tiger, 2015; Fahmie, Iwata, & Jann, 2015; Rispoli et al., 2015; Saini, Greer, & Fisher, 2015).Footnote 2
Results of the review
The numbers of articles included per journal are as follows. From the Journal of Applied Behavior Analysis, 27 SCED studies were included from the 46 “research articles” published (excluding three alternating-treatment designs without a baseline), and 20 more SCED studies were included from the 30 “reports” published (excluding two alternating-treatments design without a baseline and one changing-criterion design). From Behavior Modification, eight SCED studies were included from the 39 “articles” published (excluding two alternating-treatments design studies without a baseline, two studies with other designs without phases, one study with phases but only two measurements in the baseline phase, meta-analyses of single cases, and data analysis for single-case articles). From Research in Autism Spectrum Disorders, seven SCED studies were included from the 67 “original research articles” published (excluding one SCED study that did not have a minimum of three measurements per phase, as per Kratochwill et al., 2010). From Focus on Autism and Other Developmental Disabilities, six SCED studies were included from the 21 “articles” published. The references to all 68 articles reviewed are available in Appendix A at https://osf.io/js3hk/.
The results of this review are as follows. Extrapolation led to impossibly small values for all five trend estimators in 27 studies (39.71%), in contrast to 34 studies (50.00%) in which that did not happen for any of the trend estimators. Complementarily, extrapolation led to impossibly large values for all five trend estimators in eight studies (11.76%), in contrast to 56 studies (82.35%) in which that did not happen for any of the trend estimators. In terms of when the extrapolation led to an impossible value, a summary is provided in Table 1. Note that this table refers to the data set in each article, including the earliest out-of-bounds forecast. Thus, it can be seen that for all trend-line-fitting techniques, it was most common to have out-of-bounds forecasts already before the third intervention phase measurement occasion. This is relevant, considering that an immediate effect can be understood to refer to the first three intervention data points (Kratochwill et al., 2010).
These results suggest that researchers using techniques to extrapolate baseline trend should be cautious about downward trends that would apparently lead to negative values, if continued. We do not claim that the four journals and the year 2015 are representative of all published SCED research, but the evidence obtained suggests that trend extrapolation may affect the meaningfulness of the quantitative operations performed with the predicted data frequently enough for it to be considered an issue worth investigation.
Main issues when extrapolating baseline trend, and tentative solutions
The main issues when extrapolating baseline trend that were identified by Parker et al. (2011) include (a) unreliable trend lines being fitted; (b) the assumption that trends will continue unabated; (c) no consideration of the baseline phase length; and (d) the possibility of out-of-bounds forecasts. In this section, we comment on each of these four issues identified by Parker et al. (2011) separately (although they are related), and we propose tentative solutions, based on the existing literature. However, we begin by discussing in brief how these issues could be avoided rather than simply addressed.
Avoiding the issues
Three decisions can be made in relation to trend extrapolation. First, the researcher may wonder whether there is any clear trend at all. For that purpose, a tool such as a trend stability envelope (Lane & Gast, 2014) can be used. According to Lane and Gast, a within-phase trend would be considered stable (or clear) when at least 80% of the data points fell within the envelope defined by the split-middle trend line plus/minus 25% of the baseline median. Similarly, Mendenhall and Sincich (2012) suggested, although not in the context of single-case data, that a good fit of an OLS trend line would be represented by a coefficient of variation of 10% or smaller. We consider that either of these descriptive approaches is likely to be more reasonable than testing the statistical significance of the baseline trend before deciding whether or not to take it into account, because such a statistical test might lack power for short baselines (Tarlow, 2017). Using Kendall’s tau as a measure of the percentage of improving data points (Vannest, Parker, Davis, Soares, & Smith, 2012) would not inform one about whether a clear linear trend were present, because it refers more generally to a monotonic trend.
Second, if the data show considerable variability and no clear trend, it is possible to use a quantification that does not rely on (a) linear trend, (b) any specific nonlinear trend, or (c) any average level whatsoever, by using a nonoverlap index. Specifically, the nonoverlap of all pairs (NAP; Parker & Vannest, 2009) can be used when the baseline data do not show a natural improvement, whereas Tau-U (Parker et al., 2011) can be used when such an improvement is apparent but it is not necessarily linear.Footnote 3 A different approach could be to quantify the difference in level (e.g., using a d statistic) after showing that the assumption of no trend is plausible via a GAM (Sullivan et al., 2015). Thus, there would be no trend line fitting and no trend extrapolation.
Third, if the trend looks clear (visually or according to a formal rule) and the researcher decides to take it into account, it is also possible not to extrapolate trend lines. For instance, it is possible to fit separate trend lines to the different phases and compare the slopes and intercepts of these trend lines, as in piecewise regression (Center, Skiba, & Casey, 1985–1986).
Although these potential solutions seem reasonable, here we deal with another option: namely, the case in which baseline extrapolation is desired (because it is part of the analytical procedure chosen prior to data collection), but the researcher is willing to improve the way in which such extrapolation is performed.
First issue: Unreliable trend lines fitted
If an unreliable linear trend is fitted (e.g., the relation between the time variable and the measurements would be described by a small R2 value), then the degree of confidence we have in the representation of the baseline data is reduced. If the fit of the baseline trend line to the data is poor, its extrapolation would also be problematic. It is expected that, if the amount of variability were the same, shorter baselines would result in more uncertain estimates. In that sense, this issue is related to the next one.
Focusing specifically on reliability, we advocate quantifying the amount of fit of the trend line and using this information when deciding on baseline trend extrapolation. Regarding the comparison between actual and fitted values, Hyndman and Koehler (2006) reviewed the drawbacks of several measures of forecast accuracy, including widely known options such as the minimum square error (\( \frac{{\left({y}_i-{\widehat{y}}_i\right)}^2}{n} \), based on a quadratic loss function and inversely related to R2) or the minimum absolute error (\( \frac{\left|{y}_i-{\widehat{y}}_i\right|}{n} \), based on a linear loss function). Hyndman and Koehler proposed the mean absolute scaled error (MASE). For a trend line fitted to the nA baseline measurements, MASE can be written as follows:
Hyndman and Koehler (2006, p. 687) stated that MASE is “easily interpretable, because values of MASE greater than one indicate that the forecasts are worse, on average, than in-sample one-step forecasts from the naïve method.” (The naïve method entails predicting a value from the previous one—i.e., the random-walk model that has frequently been used to assess the degree to which more sophisticated methods provide more accurate forecasts that this simple procedure; Chatfield, 2000.) Thus, values of MASE greater than one could be indicative that a general trend (e.g., a linear one, as in MPD) does not provide a good enough fit to the data from which it was estimated, because it does not improve the fit of the naïve method.
Second issue: Assuming that trend continues unabated
This issue refers to treating baseline trend as if it were always the same for the whole period of extrapolation. By default, all the analytical techniques mentioned in the “Analytical Techniques That Entail Extrapolating Baseline Trend” section extrapolate baseline trend until the end of the intervention phase. Thus, one way of dealing with this issue would be to limit the extrapolation, following Rindskopf and Ferron (2014), who stated that “for a short period, behavior may show a linear trend, but we cannot project that linear behavior very far into the future” (p. 229). Similarly, when discussing the gradual-effects model, Swan and Pustejovksy (2018) also cautioned against long extrapolations, although their focus was on the intervention phase and not on the baseline phase.
An initial approach could be to select how far out to extrapolate baseline trend prior to gathering and plotting the data, by selecting a number that would be the same across studies. When discussing an approach for comparing levels when trend lines are fitted separately to each phase, it has been suggested that a comparison can be performed at the fifth intervention-phase measurement occasion (Rindskopf & Ferron; 2014; Swaminathan et al., 2014). It is possible to extend this recommendation to the present situation and state that the baseline trend should be extrapolated until the fifth intervention-phase measurement occasion. The choice of five measurements is arbitrary, but it is well-aligned with the minimal phase length required in the What Works Clearinghouse Standards (Kratochwill et al., 2010). Nonetheless, our review (Table 1) suggests that impossible extrapolations are common even before the fifth intervention-phase measurement occasion, and thus a comparison at that point might not avoid comparison with an impossible projection from the baseline. Similarly, when presenting the gradual-effects model, Swan and Pustejovsky (2018) defined the calculation of the effect size for an a priori set number of intervention-phase measurement occasions. In their study, this number depends on the actually observed intervention-phase lengths. Moreover, Swan and Pustejovsky suggested a sensitivity analysis, comparing the results of several possible a-priori-set numbers. It could be argued that a fixed choice would avoid making data-driven decisions that could favor finding results in line with the expectations of the researchers (Wicherts et al., 2016). A second approach would be to choose how far away to extrapolate on the basis of both a design feature (baseline phase length; see the next section) and a data feature (the amount of fit of the trend line to the data, expressed as the MASE). In the following discussion, we present a tentative solution including both these aspects.
Third issue: No consideration of baseline-phase length
Parker et al. (2011) expressed a concern that baseline trend correction procedures do not take into consideration the length of the baseline phase. The problem is that a short baseline is potentially related to unreliable trend, and it could also entail predicting many values (i.e., a longer intervention phase) from few values, which is not justified.
To take baseline length (nA) into account, one approach would be to limit the extrapolation of baseline trend to the first nA treatment-phase measurement occasions. This approach introduces an objective criterion based on a characteristic of the design. A conservative version of this alternative would be to estimate how far out to extrapolate using the following expression: \( {\widehat{n}}_B=\left\lfloor {n}_A\times \left(1- MASE\right)\right\rfloor \), applying the restriction that \( 0\le {\widehat{n}}_B\le {n}_B \). Thus, the extrapolation is determined by both the number of baseline measurements (nA) and the goodness of fit of the trend line to the data. When MASE > 1, the expression for \( {\widehat{n}}_B \) would give a negative value, precluding extrapolation. For data in which MASE < 1, the better the fit of the trend line to the data, the further out extrapolation could be considered justified. From the expression presented for \( {\widehat{n}}_B \), it can be seen that if the result of the multiplication is not an integer, the value representing the number of intervention-phase measurement occasions to which to extend the baseline trend (\( {\widehat{n}}_B \)) would be truncated. Finally, note the restriction that \( {\widehat{n}}_B \) should be equal to or smaller than nB, because it is possible that the baseline is longer than the intervention phase (nA > nB) and that, even after applying the correction factor representing the fit of the trend line \( {\widehat{n}}_B>{n}_B \). Thus, whenever \( {\widehat{n}}_B>{n}_B \), it is reset to \( {\widehat{n}}_B={n}_B \).
Fourth issue: Out-of-bounds forecasts
Extrapolating baseline trend for five, nA, or \( {\widehat{n}}_B \) measurement occasions may make trend extrapolation more reasonable (or, at least, less unreasonable), but none of these options precludes out-of-bounds forecasts. When Parker et al. (2011) discussed the issue that certain procedures to control for baseline trend could lead to projecting trend beyond rational limits, they proposed the conservative trend correction procedure implemented in Tau-U. This procedure could be useful for statistically controlling baseline trend, although the evidence provided by Tarlow (2017) suggests that the trend control incorporated in Tau-U is insufficient (i.e., leads to false positive results), especially as compared to other procedures, including MPD. An additional limitation of this trend correction procedure is that it cannot be used when extrapolating baseline trend. Therefore, we consider other options in the following text.
Nonlinear models
One option, suggested by Rindskopf and Ferron (2014), is to use nonlinear models for representing situations in which a stable and low initial level during the baseline phase experiences a change due to the intervention (e.g., an upward trend) before settling at a stable high level. Rindskopf and Ferron suggested using logistic regression with an additional term for identifying the moment at which the response has gone halfway between the floor and the ceiling. Similarly, Shadish et al. (2016) and Verboon and Peters (2018) used a logistic model for representing data with clear floor and ceiling effects. The information that can be obtained by fitting a generalized logistic model is in terms of the floor and ceiling levels, the rate of change, and the moments at which the change from the floor to the ceiling plateau starts and stops (Verboon & Peters, 2018). Shadish et al. (2016) acknowledged that not all analysts are expected to be able to fit intrinsically nonlinear models and that choosing one model over another is always partly arbitrary, suggesting nonparametric smoothing as an alternative.
Focusing on the need to improve MPD, the proposals by Rindskopf and Ferron (2014) and Verboon and Peters (2018) are not applicable, since the logistic model they present deals with considering the data of a baseline phase and an intervention phase jointly, whereas in MPD baseline trend is estimated and extrapolated in order to allow for a comparison between projected and observed patterns of the outcome variable (as suggested by Kratochwill et al., 2010, and Horner, Swaminathan, Sugai, & Smolkowski, 2012, when performing visual analysis). In contrast, Shadish et al. (2016) used the logistic model for representing the data within one of the phases in order to explore whether any within-phase change took place, but they were not aiming to use the within-phase model for extrapolating to the subsequent phase.
Although not all systematic changes in the behavior of interest are necessarily linear, there are three drawbacks to applying nonlinear models to single-case data, or even to usually longer time-series data (Chatfield, 2000). First, there has not been extensive research with short-time-series data and any of the possible nonlinear models (e.g., logistic, Gompertz, or polynomial) applicable for modeling growth curves in order to ensure that known minimal and maximal values of the measurements are not exceeded. Second, it may be difficult to distinguish between a linear model with disturbance and an inherently nonlinear model. Third, a substantive justification is necessary, based either on theory or on previously fitted nonlinear models, for preferring one nonlinear model instead of another or for preferring a nonlinear model instead of the more parsimonious linear model. However, the latter two challenges are circumvented by GAMs, because they allow one to avoid the need to explicitly posit a specific model for the data (Sullivan et al., 2015).
Winsorizing
Faith, Allison, and Gorman (1997) suggested rescaling manually out-of-bounds predicted scores within limits, a manipulation similar to winsorization. Thus, a trend is extrapolated until the values predicted are no longer possible, and then a flat line is set at the minimum/maximum possible value (e.g., 0 when the aim is to eliminate a behavior, or 100% when the aim is to improve in the completion of a certain task). The “manual” rescaling of out-of-bounds forecasts could be supported by Chatfield’s (2000, pp. 175–179) claim that it is possible to make judgmental adjustments to forecasts and also to use the “eyeball test” for checking whether forecasts are intuitively reasonable, given that background knowledge (albeit background as simple as knowing the bounds of the outcome variable) is part of nonautomatic univariate methods for forecasting in time-series analysis. In summary, just as in the logistic model, winsorizing the trend line depends on the data at hand. As a limitation, Parker et al. (2011) claimed that such a correction would impose an artificial ceiling on the effect size. However, it could also be argued that computing an effect size on the basis of impossible values is equally (or more) artificial, since it involves only crunching numbers, some of which (e.g., negative frequencies) are meaningless.
Damping trend
A third option arises from time-series forecasting, in which exponential smoothing is one of the methods commonly used (Billah, King, Snyder, & Koehler, 2006). Specifically, in double exponential smoothing, which can be seen as a special case of Holt’s (2004) linear trend procedure, it is possible to include a damping parameter (E. S. Gardner & McKenzie, 1985) that indicates how much the slope of the trend is reduced in subsequent time periods. According to the review performed by E. S. Gardner (2006), the damped additive trend is the model of choice when using exponential smoothing. A damped trend can be interpreted as an attenuation reflecting the gradual reduction of the trend until the behavior eventually settles at an upper or a lower asymptote. This would address Parker et al.’s (2011) concern that it may not be reasonable to consider that the baseline trend will continue unabated until the end of the intervention phase in the absence of an effect. Moreover, the behavioral progression is more gradual than the one implied when winsorizing. Furthermore, a gradual change is also the basis of recent proposals for modeling longitudinal data using generalized additive models (Bringmann et al., 2017).
Aiming for a tentative solution for out-of-bounds forecasts for techniques such as MPD, we consider it reasonable to borrow the idea of damping the trend from the linear trend model by Holt (2004). In contrast, the application of that model in its entirety to short SCED baselines (Shadish & Sullivan, 2011; Smith, 2012; Solomon, 2014) is limited by the need to estimate several parameters (a smoothing parameter for level, a smoothing parameter for trend, a damping parameter, the initial level, and the initial trend).
We consider that a gradually reduced trend conceptualization seems more substantively defensible than abruptly winsorizing the trend line. In that sense, instead of extrapolating the linear trend until the lower or upper bound is reached and then flattening the trend line, it is possible to estimate the damping coefficient in such a way as to ensure that impossible forecasts are not obtained during the period of extrapolation (i.e., in the \( {\widehat{n}}_B \)or nB measurement occasions after the last baseline data point, according to whether extrapolation is limited, as we propose here, or not). The damping parameter is usually represented by the Greek letter phi (φ), so that the trend line extrapolated into the intervention phase would be based on the baseline trend (b1) as follows: \( {b}_1\times {\varphi}^i;i=1,2,\dots, {\widehat{n}}_B \), so that the first predicted intervention-phase measurement is \( {\widehat{y}}_1={\widehat{y}}_{n_A}+{b}_1\times \varphi \), and the subsequent forecasts (for \( i=2,3,\dots, {\widehat{n}}_B \)) are obtained via \( {\widehat{y}}_i={\widehat{y}}_{i-1}+{b}_1\times {\varphi}^i \). The previous expressions are presented using \( {\widehat{n}}_B \), but they can be rewritten using nB in the case that extrapolation is not limited in time. For avoiding extrapolation to impossible values, the damping parameter would be estimated from the data in such a way that the final predicted value \( {\widehat{y}}_{{\widehat{n}}_B} \) would still be within the bounds of the outcome variable. We propose an iterative process checking the values of φ from 0.05 to 1.00 in steps of 0.001, in order to identify the largest φ value k for which there are no out-of-bounds values, whereas for (k + 0.001) there is one or more such values. The closer φ is to 1, the farther away in the intervention phase is the first out-of-bounds forecast produced. Estimating φ from the data and not setting it to an a-priori-chosen value is in accordance with the usually recommended practice in exponential smoothing (Billah et al., 2006).
Justification of the tentative solutions
Our main proposal is to combine the quantitative criterion for how far out to extrapolate baseline trend (\( {\widehat{n}}_B \)) with damping, in case the latter is necessary within the \( {\widehat{n}}_B \) limit. The fact that both \( {\widehat{n}}_B \) and the damping parameter φ are estimated from the data rather than being predetermined implies that this proposal is data-driven. We consider that the data-driven quantification of \( {\widehat{n}}_B \)is also not necessarily a drawback, due to three reasons: (a) An objective formula was proposed for estimating how far out it is reasonable to extrapolate the baseline trend, according to the data at hand; that is, the choice is not made subjectively by the researcher in order to favor his/her hypotheses. (b) This formula is based on both a design feature (i.e., the baseline phase length) and a data feature (i.e., the MASE as a measure of the accuracy of the trend line fitted). And (c) no substantive reason may be available a priori regarding when extrapolation becomes unjustified.
We also consider that estimating the damping parameter from the data is not a drawback, either, given that (a) φ is estimated from the data in Holt’s linear trend model for which it was proposed; (b) damping trend can be considered conceptually similar to choosing a function, in a growth curve model, that makes possible incorporating an asymptote (Chatfield, 2000), because both methods model decisions made by the researcher on the basis of knowing the characteristics of the data and, in both cases, the moment at which the asymptote is reached depends on the data at hand and not on a predefined criterion; and (c) the use of regression splines (Bringmann et al., 2017; Sullivan et al., 2015) for modeling a nonlinear relation is also data-driven, despite the fact that a predefined number of knots may be used.
The combined use of \( {\widehat{n}}_B \) plus the estimation of φ can be applied to the OLS baseline trend (as used in the Allison & Gorman, 1993, model), to the split-middle trend (as used in the conservative dual criterion, Fisher et al., 2003; or in the percentage of data points exceeding the median trend, Wolery et al., 2010), or to the trend extrapolation that is part of MPD (Manolov & Solanas, 2013). In the following section, we focus on MPD.
The present proposal is also well-aligned with Bringmann et al.’s (2017) recommendation for models that do not require existing theories about the expected nature of the change in the behavior, excessively high computational demands, or long series of measurements. Additionally, as these authors suggested, the methods need to be readily usable by applied researchers, which is achieved by the software implementations we have created.
Limitations of the tentative solutions
As we mentioned previously, it could be argued that the tentative solutions are not necessary if the researcher simply avoids extrapolation. Moreover, we do not argue that the expressions presented for deciding whether and how far to extrapolate are the only possible, or necessarily the optimal, ones; we rather aimed at defining an objective rule on a solid, albeit arbitrary, basis. An additional limitation, as was suggested by a reviewer, is that for a baseline with no variability, MASE would not be defined. In such a case, when the same value is repeated nA times (e.g., when the value is 0 because the individual is unable to perform the action required), we do consider that an unlimited extrapolation would be warranted, because the reference to which the intervention-phase data would be compared would be clear and unambiguous.
Incorporating the tentative solutions in a data-analytical procedure
Modifying the MPD
The revised version of the MPD includes the following steps:
- 1.
Estimate the slope of the baseline trend as the average of the differenced data (b1(D)).
- 2.
Fit the trend line, choosingFootnote 4 one of the three definitions of the intercept (see Appendix B at https://osf.io/js3hk/), according to the value of the MASE.
- 3.
Extrapolate the baseline trend, if justified (i.e., if MASE < 1), for as many intervention-phase measurement occasions as is justified (i.e., for the first \( {\widehat{n}}_B \) measurement occasions of the intervention phase) and considering the need for damping the trend to avoid out-of-bounds forecasts. The damping parameter φ would be equal to 1 when all \( {\widehat{n}}_B \)forecasts are within bounds, or φ < 1, otherwise.
- 4.
Compute MPD as the difference between the actually obtained and the forecast first \( {\widehat{n}}_B \) intervention-phase values.
Illustration of the proposal for modifying MPD
Procedure
In the present section, we chose three of the studies included in the review that we performed (all three data sets are available at https://osf.io/js3hk/, in the format required by the Shiny application, http://manolov.shinyapps.io/MPDExtrapolation, implementing the modified version of MPD). From the illustrations it is clear that, although the focus of the present text is comparison between a pair of phases, such a comparison can be conceptualized to be part of a more appropriate design structure, such as ABAB or multiple-baseline designs (Kratochwill et al., 2010; Tate et al., 2013), by replicating the same procedure for each AB comparison. Such a means of analyzing data corresponds to the suggestion by Scruggs and Mastropieri (1998) to perform comparisons only for data that maintain the AB sequence.
Example 1
The Ciullo, Falcomata, Pfannenstiel, and Billingsley (2015) data were chosen because their multiple-baseline design includes short baselines and extrapolation to out-of-bounds forecasts (impossibly low values) for both the first tierFootnote 5 (Fig. 1) and the third tier. In Fig. 1, trend extrapolation was not limited (i.e., the baseline trend was extrapolated for all nB = 7 values), to allow for comparing winsorizing and damping the trend. Limiting the extrapolation to \( {\widehat{n}}_B \) = 2 would have made either winsorizing or damping the trend unnecessary, because no out-of-bound forecasts would have been obtained; MPD would have been equal to 40.26.
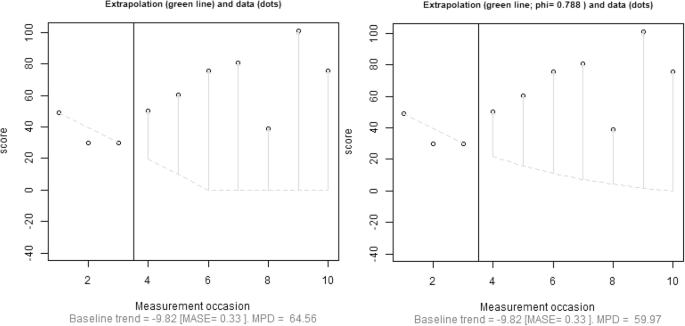
Results for mean phase difference (MPD) with the slope estimated through differencing and the intercept computed as in the Theil–Sen estimator. The results in the left panel are based on winsorizing the trend line when the lower bound is reached. The results in the right panel are based on damping the trend. Trend extrapolation is not limited. The data correspond to the first tier (a participant called Salvador) in the Ciullo et al. (2015) multiple-baseline design study
Limiting the amount of extrapolation seems reasonable, because for both of methods the intervention phase is almost three times as long as the baseline phase; using \( {\widehat{n}}_B \) leads to avoiding impossibly low forecasts for these data and to more conservative estimates of the magnitude of the effect. Damping the trend line was necessary for three of the four tiers, where it also led to more conservative estimates, given that the out-of-bounds forecasts were in a direction opposite from the one desired with the intervention. The numerical results are available in Table 2.
Example 2
The data from Allen, Vatland, Bowen, and Burke (2015) were chosen, because this study represents a different data pattern: Longer baselines are available, which could allow for better estimation of the trend, but the baseline data are apparently very variable. Intervention phases were also longer, which required extrapolations farther out in time. Thus, we wanted to illustrate how limiting extrapolations affects the quantification of an effect.
For Tier 1, out-of-bounds forecasts (impossible high values in the same direction as desired for the intervention) are obtained. However, damping the trend led to avoiding such forecasts and also to greater estimates of the effect. For Tiers 2 and 3 (the latter is represented in Fig. 2), limiting the amount of extrapolation had a very strong effect, due to the high MASE values, and only a very short extrapolation was justified for Tiers 2 and 3. The limited extrapolation is also related to greater estimates of the magnitude of the effect for Tiers 2 and 3.
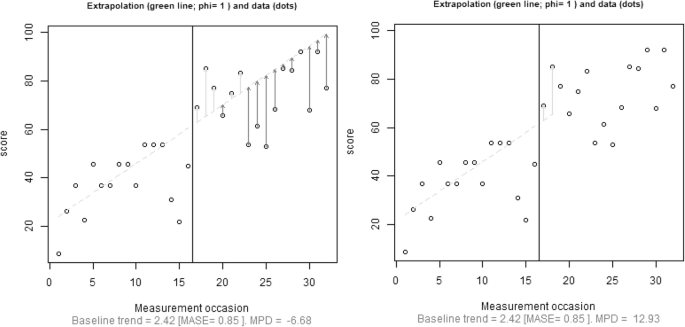
Results for mean phase difference (MPD) with the slope estimated through differencing and the intercept computed as in the Theil–Sen estimator. Trend extrapolation was not limited (left) versus limited (right). Damping the trend was not necessary in either case (φ = 1). The data correspond to the third tier of the Allen et al. (2015) multiple-baseline design study
Therefore, using only the first \( {\widehat{n}}_B \) intervention-phase data points for the comparison reflects a reasonable doubt regarding whether the (not sufficiently clear) improving baseline trend would have continued unchanged throughout the whole intervention phase (i.e., for 23 or 16 measurement occasions, for Tiers 2 and 3, respectively). The numerical results are available in Table 3.
Example 3
The data from Eilers and Hayes (2015) were chosen because they include baselines of varying lengths, out-of-bounds forecasts for Tiers 1 and 2, and a nonlinear pattern in Tier 3 (to which a linear trend line is expected to show poor fit). For these data, damping and limiting the extrapolation, when applied separately, both correct overestimation of the effect that would arise from out-of-bounds (high) forecasts in a direction opposite from the one desired in the intervention. Such an overestimation, in the absence of damping, would lead to MPD values implying more than a 100% reduction, which is meaningless (see Fig. 3).
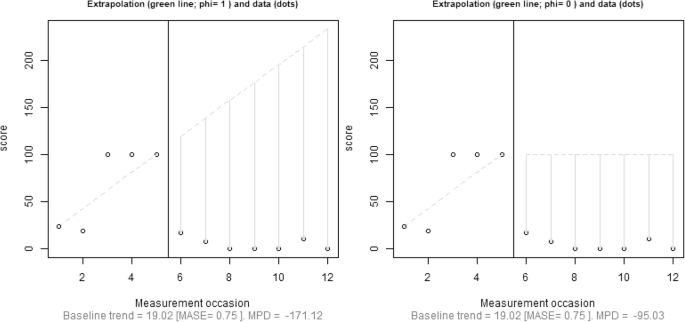
Results for mean phase difference (MPD) with the slope estimated through differencing and the intercept computed as in the Theil–Sen estimator. Trend was damped completely (right; φ = 0) versus not damped (left; φ = 1). Trend extrapolation is not limited in this figure. The data correspond to the second tier of the Eilers and Hayes (2015) multiple-baseline design study
Specifically, damping the trend is necessary in Tiers 1 and 2 to avoid such forecasts. Note that for Tier 3, the fact that a straight line does not represent the baseline data well is reflected by MASE > 1 and \( {\widehat{n}}_B<1 \), leading to a recommendation not to extrapolate the baseline trend. The numerical results are available in Table 4.
General comments
In general, the modifications introduced in MPD achieve the aims to (a) avoid extrapolating from a short baseline to a much longer intervention phase (Example 1); (b) avoid assuming that the trend will continue exactly the same for many measurement occasions beyond the baseline phase (Example 2); (c) follow an objective criterion regarding a baseline trend line that is not justified in being extrapolated at all (Example 3); and (d) avoid excessively large quantifications of effect when comparing to impossibly bad (countertherapeutic) forecasts in the absence of an effect (Examples 1 and 3). Furthermore, note that for all the data sets included in this illustration, the smallest MASE values were obtained using the Theil–Sen definition of the intercept.
Small-scale simulation study
To obtain additional evidence regarding the performance of the proposals, an application to generated data was a necessary complement to the application of our proposals to previously published real behavioral data. The simulation presented in this section should be understood as a proof of concept, rather than as a comprehensive source of evidence. We consider that further thought and research should be dedicated to simulating discrete bounded data (e.g., counts, percentages) and to studying the present proposals for deciding how far to extrapolate baseline trend and how to deal with impossible extrapolations.
Data generation
We simulated independent and autocorrelation count data using a Poisson model, following the article by Swan and Pustejovsky (2018) and adapting the R code available in the supplementary material to their article (https://osf.io/gaxrv and https://www.tandfonline.com/doi/suppl/10.1080/00273171.2018.1466681). The adaptation consisted in adding the general trend for certain conditions (denoted here by β1, whereas β2 denotes the change-in-level parameter, unlike in Swan & Pustejovsky, 2018, who denoted the change in level by β1) and simulating immediate instead of delayed effects (i.e., we set ω = 0). Given that ω = 0, the simulation model, as described by Swan and Pustejovsky, is as follows. The mathematical expectancy for each measurement occasion is μt = exp(β0 + β1t + β2D), where t is the time variable defined taking values 1, 2, . . . , nA + nB, and D is a dummy variable for change in level, taking nA values of 0 followed by nB values of 1. The first value, Y1, is simulated from a Poisson distribution with a mean set to λ1 = μ1. Subsequent values (j = 2, 3, . . . , nA + nB) are simulated taking autocorrelation into account (φj = min {φ, μj/μj − 1}), leading to the following mean for the Poisson distribution: λj = μj − φjμj − 1. Finally, the values from second to last were simulated as Yj = Xj + Zj, where Zj follows a Poisson distribution with mean λj, and Xj follows a binomial distribution with Yj − 1 trials and a probability of φj.
The specific simulation parameters for defining μt were eβ0 = 50 (representing the baseline frequency), β1 = 0, − 0.1, − 0.2, β2 = − 0.4 (representing the intervention effect as an immediate change in level), and autocorrelation φ = 0 or 0.4. Regarding the intervention effect, according to the formula %change = 100 % × [exp(β2) − 1] (Pustejovsky, 2018b), the effect was a reduction of approximately 33%, or 16.5 points, from the baseline level (eβ0), set to 50. The phase lengths (nA = nB) were 5, 7, and 10.
The specific simulation parameters β, as well as simulating the intervention effect as a reduction, were chosen in such a way as to produce a floor effect for certain simulation conditions. That is, for some of the conditions, the values of the dependent variable were equal or close to zero before the end of the intervention phase, and thus could not improve any more. For these conditions, extrapolating the baseline trend would lead to impossible negative forecasts. Such a data pattern represents well the findings from our review, according to which in almost 40% of the articles at least one AB comparison led to impossible negative predictions if the baseline trend were continued. Example data sets of the simulation conditions are presented as figures at https://osf.io/js3hk/. A total of 10,000 iterations were performed for each condition using R code (https://cran.r-project.org).
Data analysis
Six different quantifications of the intervention effect were computed. First, an immediate effect was computed, as defined in piecewise regression (Center et al., 1985–1986) and by extension in multilevel models (Van den Noortgate & Onghena, 2008). This immediate effect represents a comparison, for the first intervention-phase measurement occasion, between the extrapolated baseline trend and the fitted intervention-phase trend. Second, an average effect was computed, as defined in the generalized least squares proposal by Swaminathan et al. (2014). This average effect (δAB) is based on the expression by Rogosa (1980), initially proposed for computing an overall effect in the context of the analysis of covariance when the regression slopes were not parallel. The specific expressions are (1) for the baseline data, \( {y}_t^A={\beta}_0^A+{\beta}_0^At+{e}_t \), where t = 1, 2, . . ., nA; (2) for the intervention-phase data, \( {y}_t^B={\beta}_0^B+{\beta}_0^Bt+{e}_t \), where t = nA + 1, nA + 2, . . ., nA + nB; and (3) \( {\delta}_{AB}=\left({\beta}_0^A-{\beta}_0^B\right)+\left({\beta}_1^A-{\beta}_1^B\right)\frac{2{n}_A+{n}_B+1}{2} \). Additionally, four versions of the MPD were computed: (a) one estimating the baseline trend line using the Theil–Sen estimator, with no limitation of the extrapolation and no correction for impossible forecasts; (b) MPD incorporating \( {\widehat{n}}_B \) for limiting the extrapolation [MPD Limited]; (c) MPD incorporating \( {\widehat{n}}_B \) and using flattening to correct impossible forecasts [MPD Limited Flat]; and (d) MPD incorporating \( {\widehat{n}}_B \) and using damping to correct impossible forecasts [MPD Limited Damping]. Finally, we obtained two additional pieces of information: the percentage of iterations in which \( {\widehat{n}}_B<1 \) (due to MASE being greater than 1) and the quartiles (plus minimum and maximum) corresponding to \( {\widehat{n}}_B \) for each experimental condition.
Results
The results of the simulation are presented in Tables 5, 6, and 7, for phase lengths of five, seven, and ten measurements, respectively. When there is an intervention effect (β2 = − 0.4) but no general trend (β1 = 0), all quantifications lead to very similar results, which are also very similar to the expected overall difference of 16.5. The most noteworthy result for these conditions is that, when there is autocorrelation, for phase lengths of seven and ten data points, the naïve method is more frequently a better model for the baseline data than the Theil–Sen trend (e.g., 17.51% for autocorrelated data vs. 6.61% for independent data when nA = nB = 10). This is logical because, according to the naïve method each data point is predicted from the previous one, and positive first-order autocorrelation entails that adjacent values are more similar to each other than would be expected by chance.
When there is a general trend and nA = nB = 5 (Table 5), the floor effect means that only the immediate effect remains favorable for the intervention (i.e., lower values for the dependent variable in the intervention phase). In contrast, a comparison between the baseline extrapolation and the treatment data leads to overall quantifications (δAB and MPD) suggesting deterioration. This is because of the impossible (negative) predicted values. The other versions of MPD entail quantifications that are less overall (i.e., \( {\widehat{n}}_B<{n}_B\Big) \), and the MPD version that both limits extrapolation and uses damping to avoid impossible projections is the one that leads to values more similar to the immediate effect.
For conditions with nA = nB = 7 (Table 6), the results and the comments are equivalent. The only difference is that for a general trend expressed as β1 = − 0.2, the baseline “spontaneous” reduction is already large enough to reach the floor values, and thus even the immediate effect is unfavorable for the intervention. The results for nA = nB = 10 (Table 7) are similar. For nA = nB = 10, we added another condition in which the general trend was not so pronounced (i.e., β1 = − 0.1) as to lead to a floor effect already during the baseline. For these conditions, the results are similar to the ones for nA = nB = 5 and β1 = − 0.2.
Discussion
In summary, when there is a change in level in the absence of a general trend, the proposals for limiting the extrapolation and avoiding impossible forecasts do not affect the quantification of an overall effect. Additionally, in situations in which impossible forecasts would be obtained, these proposals lead to quantifications that better represent the data pattern. We consider that for data patterns in which the floor is reached soon after introducing the intervention, an immediate effect and subsequent values at the floor level (e.g., as quantified by the percentage zero data; Scotti, Evans, Meyer, & Walker, 1991) should be considered sufficient evidence (if they are replicated) for an intervention effect. That is, we consider that such quantifications would be a more appropriate evaluation of the data pattern than an overall quantification, such as δAB and MPD in absence of the proposals. Thus, we consider the proposals to be useful. Still, the specific quantifications obtained when the proposals are applied to MPD should not be considered perfect, because they will depend on the extent to which the observed data pattern matches the expected data pattern (e.g., whether a spontaneous improvement is expected, whether an immediate effect is expected) and on the type of quantification preferred (e.g., a raw difference as in MPD, a percentage change such as the one that could be obtained from the log response ratio [Pustejovsky, 2018b], or a difference in standard deviations, such as the BC-SMD [Shadish et al., 2014]).
In terms of the \( {\widehat{n}}_B \) values obtained, Tables 5, 6, and 7 show that most typically (i.e., the central 50%), extrapolations were considered justified from two to four measurement occasions into the interventions phase. This is well-aligned with the idea of an immediate effect consisting of the first three intervention phase measurement occasions (Kratochwill et al., 2010) and is broader than the immediate effect defined in piecewise regressions and multilevel models (focusing only on the first measurement occasion). Such a short extrapolation would avoid the untenable assumption that the baseline trend would continue unabated for too long. Moreover, damping the baseline trend helps identify a more appropriate reference for comparing the actual intervention data points.
General discussion
Extrapolating baseline trend: Issues, breadth of these issues, and tentative solutions
Several single-case analytical techniques entail extrapolating baseline trend—for instance, the Allison and Gorman (1993) regression model, the nonregression technique called mean phase difference (Manolov & Solanas, 2013), and the nonoverlap index called the percentage of data points exceeding the median trend (Wolery et al., 2010). An initial aspect to take into account is that these three techniques estimate the intercept and slope of the trend line in three different ways. When a trend line is fitted to the baseline data, the amount of fit of the trend line to the data has to be considered, plus whether it is reasonable to consider that the trend will continue unchanged and whether extrapolating the trend would lead to predicted values that are impossible in real data. The latter issue appeared to be present in SCED data published in 2015, given that in approximately 10% of the studies reviewed, forecasts above the maximal possible value were obtained, and in 40% the forecasts were below the minimal possible value, for all five trend line fitting procedures investigated. The proposals we make here take into account the length of the baseline phase, the amount of fit of the trend line to the data, and the need to avoid meaningless comparisons between actual values and impossible predicted values. Moreover, limiting the extrapolation emphasizes the idea that a linear trend is only a model that serves as an approximation of how the data would behave if the baseline continued for a limited amount of time, rather than assuming that a linear trend is necessarily the correct model for the progression of the measurements in the absence of an intervention.
The examples provided with real data and the simulation results from applying the proposals to the MPD illustrate how the present proposal for correcting out-of-bounds forecasts avoids both excessively low and excessively high effect estimates when the bounds of the measurement units are considered. Moreover, the quantitative criterion for deciding how far out to extrapolate baseline trend serves as an objective rule for not extrapolating a trend line into the intervention phase when the baseline data are not represented well by such a line.
Recommendations for applied researchers
In relation to our proposals, we recommend both limiting the extrapolation and allowing for damping the trend. Limiting the extrapolation leads to a quantification that combines to criteria mentioned in the What Works Clearninghouse Standards (Kratochwill et al., 2010): immediate change and comparison of the projected versus observed data pattern, whereas damping a trend avoids completely meaningless comparisons. Moreover, in relation to the MPD, we advocate defining its intercept according to the smallest MASE value. In relation to statistical analysis in general, we do not recommend that applied researchers should necessarily always use analytical techniques to extrapolate a baseline trend (e.g., MPD, generalized least squares analysis by Swaminathan et al., 2014, or the Allison & Gorman, 1993, OLS model). Rather, we caution regarding the use of such techniques for certain data sets and propose a modification of MPD that avoids obtaining quantifications of effects that are based on unreasonable comparisons. Additionally, we also caution researchers that when a trend line is fitted to the data, in order to improve transparency, it is important to report the technique used for estimating the intercept and slope of this trend line, given that several such techniques are available (Manolov, 2018). Finally, for cases in which the data show substantial variability and are not represented well by a straight line, or even by a curved line, we recommend applying the nonoverlap of all pairs, which makes use of all the data and not only of the first \( {\widehat{n}}_B \) measurements of the intervention-phase data.
Beyond the present focus on trend, some desirable features of analytical techniques have been suggested by Wolery et al. (2010) and expanded on by Manolov, Gast, Perdices, and Evans (2014). Readers interested in broader reviews of analytical techniques can also consult Gage and Lewis (2013) and Manolov and Moeyaert (2017). In general, we echo the recommendation to use quantitative analysis together with visual analysis (e.g., Campbell & Herzinger, 2010; Harrington & Velicer, 2015; Houle, 2009), and we further reflect on this point in the following section.
Validating the quantifications and enhancing their interpretation: Software developments
Visual analysis is regarded as a tool for verifying the meaningfulness of the quantitative results yielded by statistical techniques (Parker et al., 2006). In that sense, representing visually the trend line fitted and extrapolated or the transformed data after baseline trend has been removed is crucial. Accordingly, recent efforts have focused on using visual analysis to help choose the appropriate multilevel model (Baek, Petit-Bois, Van Den Noortgate, Beretvas, & Ferron, 2016). To make more transparent what exactly is being done with the data to obtain the quantifications, the output of the modified MPD is both graphical and numerical (see http://manolov.shinyapps.io/MPDExtrapolation, which allows for choosing whether to limit the extrapolation of the baseline trend and whether to use damping or winsorizing in the case of out-of-bounds forecasts). For MPD, in which the quantification is the average difference between the extrapolated baseline trend and the actual intervention phase measurements, the graphical output clearly indicates which are the forecast values (plus whether a trend is maintained or damped) and how far away the baseline trend is extrapolated. Moreover, the color of the arrows from predicted to actual intervention-phase values we have used in the figures of this article indicated, for a comparison, whether (green) or not (red) the difference was in the direction desired. In summary, the graphical representation of comparisons performed in MPD makes easier using visual analysis to validate and help interpret the information obtained.
Limitations in relation to the alternatives for extrapolating linear baseline trend for forecasting
In the present study, we discussed extrapolating linear trends because the MPD, our focal analytical technique, fits a straight line to the baseline data before extrapolating them. Nevertheless, it would be possible to fit a nonlinear (e.g., logistic) model to the baseline data (Shadish et al., 2016). Furthermore, there are many other alternative procedures for estimating and extrapolating trend, especially in the context of time-series analysis.
Among univariate time-series procedures for forecasting, Chatfield (2000) distinguished formal statistical models, that is, mathematical representations of reality (e.g., ARIMA; state space; growth curve models, such as logistic and Gompertz; nonlinear models, including artificial neural networks) and ad hoc methods, that is, formulas for computing forecasts. Among the ad hoc methods the most well-known and frequently used options are exponential smoothing (which can be expressed within the framework of state space models; De Gooijer & Hyndman, 2006) and the related Holt linear-trend procedure or the Holt–Winters procedure including a seasonal component. As we mentioned previously, the idea of damping a trend is borrowed from the Holt linear-trend procedure, on the basis of the work of E. S. Gardner and McKenzie (1985).
Regarding ARIMA, according to the Box–Jenkins approach already introduced in the single-case designs context, the aim is to identify the best parsimonious model by means of three steps: model identification, parameter estimation, and diagnostic checking. An appropriate model would then be used for forecasting. The difficulties of correctly identifying the ARIMA model for single-case data, via the analysis of autocorrelations and partial autocorrelations, have been documented (Velicer & Harrop, 1983), leading to fewer plausible models being proposed that would avoid this initial step (Velicer & McDonald, 1984). The simulation evidence available (Harrop & Velicer, 1985) for these models refers to data series of 40 measurements (i.e., 20 per phase), which is more than might be expected from typical single-case baselines (almost half of the initial baselines contained four or fewer data points) or series lengths (median of 20, according to the review by Shadish & Sullivan, 2011, with most series containing fewer than 40 measurements). Moreover, to the best of our knowledge, the possibility of obtaining out-of-bounds predicted values has not been discussed, nor have tentative solutions been proposed for this issue.
Holt’s (2004) linear-trend procedure is another option for forecasting that is available in textbooks (e.g., Mendenhall & Sincich, 2012), and therefore is potentially accessible to applied researchers. Holt’s model is an extension of simple exponential smoothing including a linear trend. This procedure can be extended further by including a damping parameter (E. S. Gardner & McKenzie, 1985) that indicates how much the slope of the trend is reduced in subsequent time periods. The latter model is called the additive damped trend model, and according to the review by E. S. Gardner (2006), it is the model of choice when using exponential smoothing. The main issue with the additive damped trend model is that it requires estimating three parameters—one smoothing parameter for the level, one smoothing parameter for the trend, and the damping parameter—and it is also recommended to estimate the initial level and trend via optimization. It is unclear whether reliable estimates can be obtained with the usually short baseline phases in single-case data. We performed a small-scale check using the R code by Hyndman and Athanasopoulos (2013, chap. 7.4). For instance, for the Ciullo et al. (2015) data with nA ≤ 4 and the multiple-baseline data by Eilers and Hayes (2015) with nA equal to 3, 5, and 8, the number of measurements was not sufficient to estimate the damping parameter, and thus only a linear trend was extrapolated. The same was the case for the Allen et al. (2015) data for nA = 5 and 9, whereas for nA = 16, it was possible to use the additive damped trend model. Our check suggested that the minimum baseline length required for applying the additive damped trend model is 10, which is greater than (a) the value found in at least 50% of the data sets reviewed by Shadish and Sullivan (2011); (b) the modal value of six baseline data points reported in Smith’s (2012) review; and (c) the average baseline length in the Solomon (2014) review.
Therefore, the reader should be aware that there are alternatives for estimating and extrapolating trend for forecasting. However, to the best of our knowledge, none of these alternatives is directly applicable to single-case data without any issues, or without the need to explore which model or method is more appropriate, and in which circumstances, questions that do not have clear answers even for the usually longer time-series data (Chatfield, 2000).
Future research
One line of future research could be to focus on testing the proposals via a broader simulation, such as one that applied different analytical techniques: for instance, the MPD, before computing δAB in the context of regression analysis, and the percentage of data points exceeding the median trend. Another line of research could focus on a comparison between the version of MPD incorporating the proposals and the recently developed generalized logistic model of Verboon and Peters (2018). Such a comparison could entail a field test and a survey among applied researchers on the perceived ease of use and the utility of the information provided.
Author note
The authors thank Patrick Onghena for his feedback on previous versions of this article.
Notes
In contrast, in the meta-analysis by Chiu and Roberts (2018), for outcomes for which there was no true maximum, the largest value actually obtained was treated as a maximum, before converting the values into percentages. If we had followed the same procedure, we would have found a greater frequency of impossibly high forecasts.
The references in this paragraph correspond to the studies included in the review and are available in Appendix A at our Open Science Framework site: https://osf.io/js3hk/.
Note that Tarlow (2017) identified several issues with Tau-U and proposed the “baseline-corrected Tau,” which, however, corrects the data using the linear trend as estimated with the Theil–Sen estimator, and thus implicitly assumes that a straight line is a good representation of the baseline data.
It could be argued that having three different ways of defining the intercept available (i.e., in the Shiny application) may prompt applied researchers to choose the definition that favors their hypotheses or expectations. Nevertheless, we advocate using the definition of the intercept that provides a better fit to the data, both visually and quantitatively, as assessed via the MASE.
Following Tate and Perdices (2018), we use the term “tier” to refer to each AB comparison within a multiple-baseline design. Therefore, “tiers” could refer to different individuals, if the multiple-baseline design entails a staggered replication across participants, or to different behaviors or settings, if there is replication across behaviors or settings. Additionally, the term “tier” enables us to avoid confusion with the term “baseline,” which denotes only the A phase of the AB comparison.
References
Allen, K. D., Vatland, C., Bowen, S. L., & Burke, R. V. (2015). Parent-produced video self-modeling to improve independence in an adolescent with intellectual developmental disorder and an autism spectrum disorder: A controlled case study. Behavior Modification, 39, 542–556.
Allison, D. B., & Gorman, B. S. (1993). Calculating effect sizes for meta-analysis: The case of the single case. Behaviour Research and Therapy, 31, 621−631.
Arnau, J., & Bono, R. (1998). Short time series analysis: C statistic vs. Edgington model. Quality & Quantity, 32, 63–75.
Austin, J. E., & Tiger, J. H. (2015). Providing alternative reinforcers to facilitate tolerance to delayed reinforcement following functional communication training. Journal of Applied Behavior Analysis, 48, 663−668.
Baek, E. K., Petit-Bois, M., Van Den Noortgate, W., Beretvas, S. N., & Ferron, J. M. (2016). Using visual analysis to evaluate and refine multilevel models of single-case studies. Journal of Special Education, 50, 18–26.
Billah, B., King, M. L., Snyder, R. D., & Koehler, A. B. (2006). Exponential smoothing model selection for forecasting. International Journal of Forecasting, 22, 239–247.
Brandt, J. A. A., Dozier, C. L., Juanico, J. F., Laudont, C. L., & Mick, B. R. (2015). The value of choice as a reinforcer for typically developing children. Journal of Applied Behavior Analysis, 48, 344−362.
Bringmann, L. F., Hamaker, E. L., Vigo, D. E., Aubert, A., Borsboom, D., & Tuerlinckx, F. (2017). Changing dynamics: Time-varying autoregressive models using generalized additive modeling. Psychological Methods, 22, 409–425. https://doi.org/10.1037/met0000085
Campbell, J. M., & Herzinger, C. V. (2010). Statistics and single subject research methodology. In D. L. Gast (Ed.), Single subject research methodology in behavioral sciences (pp. 417–453). London: Routledge.
Cannella-Malone, H. I., Sabielny, L. M., & Tullis, C. A. (2015). Using eye gaze to identify reinforcers for individuals with severe multiple disabilities. Journal of Applied Behavior Analysis, 48, 680–684. https://doi.org/10.1002/jaba.231
Center, B. A., Skiba, R. J., & Casey, A. (1985–1986). A methodology for the quantitative synthesis of intra-subject design research. Journal of Special Education, 19, 387–400.
Chatfield, C. (2000). Time-series forecasting. London: Chapman & Hall/CRC.
Cheng, Y., Huang, C. L., & Yang, C. S. (2015). Using a 3D immersive virtual environment system to enhance social understanding and social skills for children with autism spectrum disorders. Focus on Autism and Other Developmental Disabilities, 30, 222−236.
Chiu, M. M., & Roberts, C. A. (2018). Improved analyses of single cases: Dynamic multilevel analysis. Developmental Neurorehabilitation, 21, 253–265.
Ciullo, S., Falcomata, T. S., Pfannenstiel, K., & Billingsley, G. (2015). Improving learning with science and social studies text using computer-based concept maps for students with disabilities. Behavior Modification, 39, 117–135.
De Gooijer, J. G., & Hyndman, R. J. (2006). 25 years of time series forecasting. International Journal of Forecasting, 22, 443–473.
Eilers, H. J., & Hayes, S. C. (2015). Exposure and response prevention therapy with cognitive defusion exercises to reduce repetitive and restrictive behaviors displayed by children with autism spectrum disorder. Research in Autism Spectrum Disorders, 19, 18–31.
Fahmie, T. A., Iwata, B. A., & Jann, K. E. (2015). Comparison of edible and leisure reinforcers. Journal of Applied Behavior Analysis, 48, 331−343.
Faith, M. S., Allison, D. B., & Gorman, D. B. (1997). Meta-analysis of single-case research. In R. D. Franklin, D. B. Allison, & B. S. Gorman (Eds.), Design and analysis of single-case research (pp. 245–277). Mahwah: Erlbaum.
Ferron, J. M., Bell, B. A., Hess, M. R., Rendina-Gobioff, G., & Hibbard, S. T. (2009). Making treatment effect inferences from multiple-baseline data: The utility of multilevel modeling approaches. Behavior Research Methods, 41, 372–384. https://doi.org/10.3758/BRM.41.2.372
Fisher, W. W., Kelley, M. E., & Lomas, J. E. (2003). Visual aids and structured criteria for improving visual inspection and interpretation of single-case designs. Journal of Applied Behavior Analysis, 36, 387–406.
Fiske, K. E., Isenhower, R. W., Bamond, M. J., Delmolino, L., Sloman, K. N., & LaRue, R. H. (2015). Assessing the value of token reinforcement for individuals with autism. Journal of Applied Behavior Analysis, 48, 448−453.
Fox, J. (2016). Applied regression analysis and generalized linear models (3rd). London: Sage.
Gage, N. A., & Lewis, T. J. (2013). Analysis of effect for single-case design research. Journal of Applied Sport Psychology, 25, 46–60.
Gardner, E. S., Jr. (2006). Exponential smoothing: The state of the art—Part II. International Journal of Forecasting, 22, 637–666.
Gardner, E. S., Jr., & McKenzie, E. (1985). Forecasting trends in time series. Management Science, 31, 1237–1246.
Gardner, S. J., & Wolfe, P. S. (2015). Teaching students with developmental disabilities daily living skills using point-of-view modeling plus video prompting with error correction. Focus on Autism and Other Developmental Disabilities, 30, 195−207.
Harrington, M., & Velicer, W. F. (2015). Comparing visual and statistical analysis in single-case studies using published studies. Multivariate Behavioral Research, 50, 162–183.
Harrop, J. W., & Velicer, W. F. (1985). A comparison of alternative approaches to the analysis of interrupted time-series. Multivariate Behavioral Research, 20, 27–44.
Hine, J. F., Ardoin, S. P., & Foster, T. E. (2015). Decreasing transition times in elementary school classrooms: Using computer-assisted instruction to automate intervention components. Journal of Applied Behavior Analysis, 48, 495–510. https://doi.org/10.1002/jaba.233
Holt, C. C. (2004). Forecasting seasonals and trends by exponentially weighted moving averages. International Journal of Forecasting, 20, 5–10.
Horner, R. H., Swaminathan, H., Sugai, G., & Smolkowski, K. (2012). Considerations for the systematic analysis and use of single-case research. Education and Treatment of Children, 35, 269–290.
Houle, T. T. (2009). Statistical analyses for single-case experimental designs. In D. H. Barlow, M. K. Nock, & M. Hersen (Eds.), Single case experimental designs: Strategies for studying behavior change (3rd, pp. 271–305). Boston: Pearson.
Huitema, B. E., McKean, J. W., & McKnight, S. (1999). Autocorrelation effects on least-squares intervention analysis of short time series. Educational and Psychological Measurement, 59, 767–786.
Hyndman, R. J., & Athanasopoulos, G. (2013). Forecasting: Principles and practice. Retrieved March 24, 2018, from https://www.otexts.org/fpp/7/4
Hyndman, R. J., & Koehler, A. B. (2006). Another look at measures of forecast accuracy. International Journal of Forecasting, 22, 679–688.
Knight, V. F., Wood, C. L., Spooner, F., Browder, D. M., & O’Brien, C. P. (2015). An exploratory study using science eTexts with students with Autism Spectrum Disorder. Focus on Autism and Other Developmental Disabilities, 30, 86−99.
Kratochwill, T. R., Hitchcock, J. H., Horner, R. H., Levin, J. R., Odom, S. L., Rindskopf, D. M., & Shadish, W. R. (2010). Single case designs technical documentation. In the What Works Clearinghouse: Procedures and standards handbook (Version 1.0). Available at http://ies.ed.gov/ncee/wwc/pdf/reference_resources/wwc_scd.pdf
Kratochwill, T. R., Levin, J. R., Horner, R. H., & Swoboda, C. M. (2014). Visual analysis of single-case intervention research: Conceptual and methodological issues. In T. R. Kratochwill & J. R. Levin (Eds.), Single-case intervention research: Methodological and statistical advances (pp. 91–125). Washington, DC: American Psychological Association.
Lane, J. D., & Gast, D. L. (2014). Visual analysis in single case experimental design studies: Brief review and guidelines. Neuropsychological Rehabilitation, 24, 445–463.
Ledbetter-Cho, K., Lang, R., Davenport, K., Moore, M., Lee, A., Howell, A., . . . O’Reilly, M. (2015). Effects of script training on the peer-to-peer communication of children with autism spectrum disorder. Journal of Applied Behavior Analysis, 48, 785−799.
Manolov, R. (2018). Linear trend in single-case visual and quantitative analyses. Behavior Modification, 42, 684–706.
Manolov, R., Gast, D. L., Perdices, M., & Evans, J. J. (2014). Single-case experimental designs: Reflections on conduct and analysis. Neuropsychological Rehabilitation, 24, 634−660. https://doi.org/10.1080/09602011.2014.903199
Manolov, R., & Moeyaert, M. (2017). Recommendations for choosing single-case data analytical techniques. Behavior Therapy, 48, 97−114.
Manolov, R., & Rochat, L. (2015). Further developments in summarising and meta-analysing single-case data: An illustration with neurobehavioural interventions in acquired brain injury. Neuropsychological Rehabilitation, 25, 637−662.
Manolov, R., & Solanas, A. (2009). Percentage of nonoverlapping corrected data. Behavior Research Methods, 41, 1262–1271. https://doi.org/10.3758/BRM.41.4.1262
Manolov, R., & Solanas, A. (2013). A comparison of mean phase difference and generalized least squares for analyzing single-case data. Journal of School Psychology, 51, 201−215.
Marso, D., & Shadish, W. R. (2015). Software for meta-analysis of single-case design: DHPS macro. Retrieved January 22, 2017, from http://faculty.ucmerced.edu/wshadish/software/software-meta-analysis-single-case-design
Matyas, T. A., & Greenwood, K. M. (1997). Serial dependency in single-case time series. In R. D. Franklin, D. B. Allison, & B. S. Gorman (Eds.), Design and analysis of single-case research (pp. 215–243). Mahwah: Erlbaum.
Mendenhall, W., & Sincich, T. (2012). A second course in statistics: Regression analysis (7th). Boston: Prentice Hall.
Mercer, S. H., & Sterling, H. E. (2012). The impact of baseline trend control on visual analysis of single-case data. Journal of School Psychology, 50, 403–419.
Parker, R. I., Cryer, J., & Byrns, G. (2006). Controlling baseline trend in single-case research. School Psychology Quarterly, 21, 418−443.
Parker, R. I., & Vannest, K. (2009). An improved effect size for single-case research: Nonoverlap of all pairs. Behavior Therapy, 40, 357–367. https://doi.org/10.1016/j.beth.2008.10.006
Parker, R. I., Vannest, K. J., Davis, J. L., & Sauber, S. B. (2011). Combining nonoverlap and trend for single-case research: Tau-U. Behavior Therapy, 42, 284−299. https://doi.org/10.1016/j.beth.2010.08.006
Pustejovsky, J. E. (2015). Measurement-comparable effect sizes for single-case studies of free-operant behavior. Psychological Methods, 20, 342−359.
Pustejovsky, J. E. (2018a). Procedural sensitivities of effect sizes for single-case designs with directly observed behavioral outcome measures. Psychological Methods. Advance online publication. https://doi.org/10.1037/met0000179
Pustejovsky, J. E. (2018b). Using response ratios for meta-analyzing single-case designs with behavioral outcomes. Journal of School Psychology, 68, 99–112.
Pustejovsky, J. E., Hedges, L. V., & Shadish, W. R. (2014). Design-comparable effect sizes in multiple baseline designs: A general modeling framework. Journal of Educational and Behavioral Statistics, 39, 368–393.
Rindskopf, D. M., & Ferron, J. M. (2014). Using multilevel models to analyze single-case design data. In T. R. Kratochwill & J. R. Levin (Eds.), Single-case intervention research: Methodological and statistical advances (pp. 221−246). Washington, DC: American Psychological Association.
Rispoli, M., Ninci, J., Burke, M. D., Zaini, S., Hatton, H., & Sanchez, L. (2015). Evaluating the accuracy of results for teacher implemented trial-based functional analyses. Behavior Modification, 39, 627−653.
Rogosa, D. (1980). Comparing nonparallel regression lines. Psychological Bulletin, 88, 307–321. https://doi.org/10.1037/0033-2909.88.2.307
Saini, V., Greer, B. D., & Fisher, W. W. (2015). Clarifying inconclusive functional analysis results: Assessment and treatment of automatically reinforced aggression. Journal of Applied Behavior Analysis, 48, 315–330. https://doi.org/10.1002/jaba.203
Scotti, J. R., Evans, I. M., Meyer, L. H., & Walker, P. (1991). A meta-analysis of intervention research with problem behavior: Treatment validity and standards of practice. American Journal on Mental Retardation, 96, 233–256.
Scruggs, T. E., & Mastropieri, M. A. (1998). Summarizing single-subject research: Issues and applications. Behavior Modification, 22, 221–242.
Shadish, W. R., Hedges, L. V., & Pustejovsky, J. E. (2014). Analysis and meta-analysis of single-case designs with a standardized mean difference statistic: A primer and applications. Journal of School Psychology, 52, 123–147.
Shadish, W. R., Kyse, E. N., & Rindskopf, D. M. (2013). Analyzing data from single-case designs using multilevel models: New applications and some agenda items for future research. Psychological Methods, 18, 385–405. https://doi.org/10.1037/a0032964
Shadish, W. R., Rindskopf, D. M., & Boyajian, J. G. (2016). Single-case experimental design yielded an effect estimate corresponding to a randomized controlled trial. Journal of Clinical Epidemiology, 76, 82–88.
Shadish, W. R., Rindskopf, D. M., Hedges, L. V., & Sullivan, K. J. (2013). Bayesian estimates of autocorrelations in single-case designs. Behavior Research Methods, 45, 813–821.
Shadish, W. R., & Sullivan, K. J. (2011). Characteristics of single-case designs used to assess intervention effects in 2008. Behavior Research Methods, 43, 971−980. https://doi.org/10.3758/s13428-011-0111-y
Siegel, E. B., & Lien, S. E. (2015). Using photographs of contrasting contextual complexity to support classroom transitions for children with Autism Spectrum Disorders. Focus on Autism and Other Developmental Disabilities, 30, 100−114.
Smith, J. D. (2012). Single-case experimental designs: A systematic review of published research and current standards. Psychological Methods, 17, 510–550. https://doi.org/10.1037/a0029312
Solanas, A., Manolov, R., & Onghena, P. (2010). Estimating slope and level change in N = 1 designs. Behavior Modification, 34, 195−218.
Solomon, B. G. (2014). Violations of assumptions in school-based single-case data: Implications for the selection and interpretation of effect sizes. Behavior Modification, 38, 477−496.
Stewart, K. K., Carr, J. E., Brandt, C. W., & McHenry, M. M. (2007). An evaluation of the conservative dual-criterion method for teaching university students to visually inspect AB-design graphs. Journal of Applied Behavior Analysis, 40, 713−718.
Sullivan, K. J., Shadish, W. R., & Steiner, P. M. (2015). An introduction to modeling longitudinal data with generalized additive models: Applications to single-case designs. Psychological Methods, 20, 26−42. https://doi.org/10.1037/met0000020
Swaminathan, H., Rogers, H. J., Horner, R., Sugai, G., & Smolkowski, K. (2014). Regression models for the analysis of single case designs. Neuropsychological Rehabilitation, 24, 554−571.
Swan, D. M., & Pustejovsky, J. E. (2018). A gradual effects model for single-case designs. Multivariate Behavioral Research, 53, 574–593. https://doi.org/10.1080/00273171.2018.1466681
Tarlow, K. (2017). An improved rank correlation effect size statistic for single-case designs: Baseline corrected Tau. Behavior Modification, 41, 427–467.
Tate, R. L., & Perdices, M. (2018). Single-case experimental designs for clinical research and neurorehabilitation settings: Planning, conduct, analysis and reporting. London: Routledge.
Tate, R. L., Perdices, M., Rosenkoetter, U., Wakima, D., Godbee, K., Togher, L., & McDonald, S. (2013). Revision of a method quality rating scale for single-case experimental designs and n-of-1 trials: The 15-item Risk of Bias in N-of-1 Trials (RoBiNT) Scale. Neuropsychological Rehabilitation, 23, 619–638. https://doi.org/10.1080/09602011.2013.824383
Van den Noortgate, W., & Onghena, P. (2008). A multilevel meta-analysis of single-subject experimental design studies. Evidence-Based Communication Assessment and Intervention, 2, 142–151.
Vannest, K. J., Parker, R. I., Davis, J. L., Soares, D. A., & Smith, S. L. (2012). The Theil–Sen slope for high-stakes decisions from progress monitoring. Behavioral Disorders, 37, 271–280.
Velicer, W. F., & Harrop, J. (1983). The reliability and accuracy of time series model identification. Evaluation Review, 7, 551–560.
Velicer, W. F., & McDonald, R. P. (1984). Time series analysis without model identification. Multivariate Behavioral Research, 19, 33–47.
Verboon, P., & Peters, G. J. (2018). Applying the generalized logistic model in single case designs: Modeling treatment-induced shifts. Behavior Modification. Advance online publication. https://doi.org/10.1177/0145445518791255
White, D. M., Rusch, F. R., Kazdin, A. E., & Hartmann, D. P. (1989). Applications of meta-analysis in individual subject research. Behavioral Assessment, 11, 281–296.
Wicherts, J. M., Veldkamp, C. L., Augusteijn, H. E., Bakker, M., van Aert, R. C., & Van Assen, M. A. (2016). Degrees of freedom in planning, running, analyzing, and reporting psychological studies: A checklist to avoid p-hacking. Frontiers in Psychology, 7, 1832. https://doi.org/10.3389/fpsyg.2016.01832
Wolery, M., Busick, M., Reichow, B., & Barton, E. E. (2010). Comparison of overlap methods for quantitatively synthesizing single-subject data. Journal of Special Education, 44, 18–29.
Wolfe, K., & Slocum, T. A. (2015). A comparison of two approaches to training visual analysis of AB graphs. Journal of Applied Behavior Analysis, 48, 472–477. https://doi.org/10.1002/jaba.212
Young, N. D., & Daly, E. J., III. (2016). An evaluation of prompting and reinforcement for training visual analysis skills. Journal of Behavioral Education, 25, 95–119.
Author information
Authors and Affiliations
Corresponding author
Additional information
Publisher’s Note
Springer Nature remains neutral with regard to jurisdictional claims in published maps and institutional affiliations.
Appendices
Appendix A
References to the studies included in the present review of single-case research published in 2015 in four journals: Journal of Applied Behavior Analysis, Behavior Modification, Research in Autism Spectrum Disorders, and Focus on Autism and Other Developmental Disabilities.
- 1.
Allen, K. D., Vatland, C., Bowen, S. L., & Burke, R. V. (2015). An evaluation of parent-produced video self-modeling to improve independence in an adolescent with intellectual developmental disorder and an autism spectrum disorder: A controlled case study. Behavior Modification, 39, 542–556.
- 2.
Austin, J. E., & Tiger, J. H. (2015). Providing alternative reinforcers to facilitate tolerance to delayed reinforcement following functional communication training. Journal of Applied Behavior Analysis, 48, 663–668.
- 3.
Austin, J. L., Groves, E. A., Reynish, L. C., & Francis, L. L. (2015). Validating trial-based functional analyses in mainstream primary school classrooms. Journal of Applied Behavior Analysis, 48, 274–288.
- 4.
Boudreau, B. A., Vladescu, J. C., Kodak, T. M., Argott, P. J., & Kisamore, A. N. (2015). A comparison of differential reinforcement procedures with children with autism. Journal of Applied Behavior Analysis, 48, 918–923.
- 5.
Brandt, J. A. A., Dozier, C. L., Juanico, J. F., Laudont, C. L., & Mick, B. R. (2015). The value of choice as a reinforcer for typically developing children. Journal of Applied Behavior Analysis, 48, 344–362.
- 6.
Cannella-Malone, H. I., Sabielny, L. M., & Tullis, C. A. (2015). Using eye gaze to identify reinforcers for individuals with severe multiple disabilities. Journal of Applied Behavior Analysis, 48, 680–684.
- 7.
Carroll, R. A., Joachim, B. T., St Peter, C. C., & Robinson, N. (2015). A comparison of error-correction procedures on skill acquisition during discrete-trial instruction. Journal of Applied Behavior Analysis, 48, 257–273.
- 8.
Cheng, Y., Huang, C. L., & Yang, C. S. (2015). Using a 3D immersive virtual environment system to enhance social understanding and social skills for children with autism spectrum disorders. Focus on Autism and Other Developmental Disabilities, 30, 222–236.
- 9.
Ciccone, F. J., Graff, R. B., & Ahearn, W. H. (2015). Increasing the efficiency of paired-stimulus preference assessments by identifying categories of preference. Journal of Applied Behavior Analysis, 48, 221–226.
- 10.
Ciullo, S., Falcomata, T. S., Pfannenstiel, K., & Billingsley, G. (2014). Improving learning with science and social studies text using computer-based concept maps for students with disabilities. Behavior Modification, 39, 117–135.
- 11.
Daar, J. H., Negrelli, S., & Dixon, M. R. (2015). Derived emergence of WH question–answers in children with autism. Research in Autism Spectrum Disorders, 19, 59–71.
- 12.
DeQuinzio, J. A., & Taylor, B. A. (2015). Teaching children with autism to discriminate the reinforced and nonreinforced responses of others: Implications for observational learning. Journal of Applied Behavior Analysis, 48, 38–51.
- 13.
Derosa, N. M., Fisher, W. W., & Steege, M. W. (2015). An evaluation of time in establishing operation on the effectiveness of functional communication training. Journal of Applied Behavior Analysis, 48, 115–130.
- 14.
Ditzian, K., Wilder, D. A., King, A., & Tanz, J. (2015). An evaluation of the performance diagnostic checklist–human services to assess an employee performance problem in a center-based autism treatment facility. Journal of Applied Behavior Analysis, 48, 199–203.
- 15.
Donaldson, J. M., Wiskow, K. M., & Soto, P. L. (2015). Immediate and distal effects of the good behavior game. Journal of Applied Behavior Analysis, 48, 685–689.
- 16.
Downs, H. E., Miltenberger, R., Biedronski, J., & Witherspoon, L. (2015). The effects of video self-evaluation on skill acquisition with yoga postures. Journal of Applied Behavior Analysis, 48, 930–935.
- 17.
Dupuis, D. L., Lerman, D. C., Tsami, L., & Shireman, M. L. (2015). Reduction of aggression evoked by sounds using noncontingent reinforcement and time-out. Journal of Applied Behavior Analysis, 48, 669–674.
- 18.
Eilers, H. J., & Hayes, S. C. (2015). Exposure and response prevention therapy with cognitive defusion exercises to reduce repetitive and restrictive behaviors displayed by children with autism spectrum disorder. Research in Autism Spectrum Disorders, 19, 18–31.
- 19.
Engstrom, E., Mudford, O. C., & Brand, D. (2015). Replication and extension of a check-in procedure to increase activity engagement among people with severe dementia. Journal of Applied Behavior Analysis, 48, 460–465.
- 20.
Fahmie, T. A., Iwata, B. A., & Jann, K. E. (2015). Comparison of edible and leisure reinforcers. Journal of Applied Behavior Analysis, 48, 331–343.
- 21.
Fichtner, C. S., & Tiger, J. H. (2015). Teaching discriminated social approaches to individuals with Angelman syndrome. Journal of Applied Behavior Analysis, 48, 734–748.
- 22.
Fisher, W. W., Greer, B. D., Fuhrman, A. M., & Querim, A. C. (2015). Using multiple schedules during functional communication training to promote rapid transfer of treatment effects. Journal of Applied Behavior Analysis, 48, 713–733.
- 23.
Fiske, K. E., Isenhower, R. W., Bamond, M. J., Delmolino, L., Sloman, K. N., & LaRue, R. H. (2015). Assessing the value of token reinforcement for individuals with autism. Journal of Applied Behavior Analysis, 48, 448–453.
- 24.
Fox, A. E., & Belding, D. L. (2015). Reducing pawing in horses using positive reinforcement. Journal of Applied Behavior Analysis, 48, 936–940.
- 25.
Frewing, T. M., Rapp, J. T., & Pastrana, S. J. (2015). Using conditional percentages during free-operant stimulus preference assessments to predict the effects of preferred items on stereotypy preliminary findings. Behavior Modification, 39, 740–765.
- 26.
Fu, S. B., Penrod, B., Fernand, J. K., Whelan, C. M., Griffith, K., & Medved, S. (2015). The effects of modeling contingencies in the treatment of food selectivity in children with autism. Behavior Modification, 39, 771–784.
- 27.
Gardner, S. J., & Wolfe, P. S. (2014). Teaching students with developmental disabilities daily living skills using point-of-view modeling plus video prompting with error correction. Focus on Autism and Other Developmental Disabilities, 30, 195–207.
- 28.
Gilroy, S. P., Lorah, E. R., Dodge, J., & Fiorello, C. (2015). Establishing deictic repertoires in autism. Research in Autism Spectrum Disorders, 19, 82–92.
- 29.
Groskreutz, M. P., Peters, A., Groskreutz, N. C., & Higbee, T. S. (2015). Increasing play-based commenting in children with autism spectrum disorder using a novel script-frame procedure. Journal of Applied Behavior Analysis, 48, 442–447.
- 30.
Haq, S. S., & Kodak, T. (2015). Evaluating the effects of massed and distributed practice on acquisition and maintenance of tacts and textual behavior with typically developing children. Journal of Applied Behavior Analysis, 48, 85–95.
- 31.
Hayes, L. B., & Van Camp, C. M. (2015). Increasing physical activity of children during school recess. Journal of Applied Behavior Analysis, 48, 690–695.
- 32.
Hine, J. F., Ardoin, S. P., & Foster, T. E. (2015). Decreasing transition times in elementary school classrooms: Using computer-assisted instruction to automate intervention components. Journal of Applied Behavior Analysis, 48, 495–510.
- 33.
Kelley, M. E., Liddon, C. J., Ribeiro, A., Greif, A. E., & Podlesnik, C. A. (2015). Basic and translational evaluation of renewal of operant responding. Journal of Applied Behavior Analysis, 48, 390–401.
- 34.
Kodak, T., Clements, A., Paden, A. R., LeBlanc, B., Mintz, J., & Toussaint, K. A. (2015). Examination of the relation between an assessment of skills and performance on auditory–visual conditional discriminations for children with autism spectrum disorder. Journal of Applied Behavior Analysis, 48, 52–70.
- 35.
Knight, V. F., Wood, C. L., Spooner, F., Browder, D. M., & O’Brien, C. P. (2015). An exploratory study using science eTexts with students with Autism Spectrum Disorder. Focus on Autism and Other Developmental Disabilities, 30, 86–99.
- 36.
Kuhl, S., Rudrud, E. H., Witts, B. N., & Schulze, K. A. (2015). Classroom-based interdependent group contingencies increase children’s physical activity. Journal of Applied Behavior Analysis, 48, 602–612.
- 37.
Lambert, A. M., Tingstrom, D. H., Sterling, H. E., Dufrene, B. A., & Lynne, S. (2015). Effects of tootling on classwide disruptive and appropriate behavior of upper-elementary students. Behavior Modification, 39, 413–430.
- 38.
Lambert, J. M., Bloom, S. E., Samaha, A. L., Dayton, E., & Rodewald, A. M. (2015). Serial alternative response training as intervention for target response resurgence. Journal of Applied Behavior Analysis, 48, 765–780.
- 39.
Ledbetter-Cho, K., Lang, R., Davenport, K., Moore, M., Lee, A., Howell, A., . . . O’Reilly, M. (2015). Effects of script training on the peer-to-peer communication of children with autism spectrum disorder. Journal of Applied Behavior Analysis, 48, 785–799.
- 40.
Lee, G. P., Miguel, C. F., Darcey, E. K., & Jennings, A. M. (2015). A further evaluation of the effects of listener training on derived categorization and speaker behavior in children with autism. Research in Autism Spectrum Disorders, 19, 72–81.
- 41.
Lerman, D. C., Hawkins, L., Hillman, C., Shireman, M., & Nissen, M. A. (2015). Adults with autism spectrum disorder as behavior technicians for young children with autism: Outcomes of a behavioral skills training program. Journal of Applied Behavior Analysis, 48, 233–256.
- 42.
Mechling, L. C., Ayres, K. M., Foster, A. L., & Bryant, K. J. (2014). Evaluation of generalized performance across materials when using video technology by students with autism spectrum disorder and moderate intellectual disability. Focus on Autism and Other Developmental Disabilities, 30, 208–221.
- 43.
Miller, S. A., Rodriguez, N. M., & Rourke, A. J. (2015). Do mirrors facilitate acquisition of motor imitation in children diagnosed with autism? Journal of Applied Behavior Analysis, 48, 194–198.
- 44.
Mitteer, D. R., Romani, P. W., Greer, B. D., & Fisher, W. W. (2015). Assessment and treatment of pica and destruction of holiday decorations. Journal of Applied Behavior Analysis, 48, 912–917.
- 45.
Neely, L., Rispoli, M., Gerow, S., & Ninci, J. (2014). Effects of antecedent exercise on academic engagement and stereotypy during instruction. Behavior Modification, 39, 98–116.
- 46.
O’Handley, R. D., Radley, K. C., & Whipple, H. M. (2015). The relative effects of social stories and video modeling toward increasing eye contact of adolescents with autism spectrum disorder. Research in Autism Spectrum Disorders, 11, 101–111.
- 47.
Paden, A. R., & Kodak, T. (2015). The effects of reinforcement magnitude on skill acquisition for children with autism. Journal of Applied Behavior Analysis, 48, 924–929.
- 48.
Pence, S. T., & St Peter, C. C. (2015). Evaluation of treatment integrity errors on mand acquisition. Journal of Applied Behavior Analysis, 48, 575–589. https://doi.org/10.1002/jaba.238
- 49.
Peters, L. C., & Thompson, R. H. (2015). Teaching children with autism to respond to conversation partners’ interest. Journal of Applied Behavior Analysis, 48, 544–562.
- 50.
Peterson, K. M., Volkert, V. M., & Zeleny, J. R. (2015). Increasing self-drinking for children with feeding disorders. Journal of Applied Behavior Analysis, 48, 436–441.
- 51.
Protopopova, A., & Wynne, C. D. (2015). Improving in-kennel presentation of shelter dogs through response-dependent and response-independent treat delivery. Journal of Applied Behavior Analysis, 48, 590–601.
- 52.
Putnam, B. C., & Tiger, J. H. (2015). Teaching braille letters, numerals, punctuation, and contractions to sighted individuals. Journal of Applied Behavior Analysis, 48, 466–471.
- 53.
Quinn, M. J., Miltenberger, R. G., & Fogel, V. A. (2015). Using TAGteach to improve the proficiency of dance movements. Journal of Applied Behavior Analysis, 48, 11–24.
- 54.
Rispoli, M., Ninci, J., Burke, M. D., Zaini, S., Hatton, H., & Sanchez, L. (2015). Evaluating the accuracy of results for teacher implemented trial-based functional analyses. Behavior Modification, 39, 627–653.
- 55.
Rosales, R., Gongola, L., & Homlitas, C. (2015). An evaluation of video modeling with embedded instructions to teach implementation of stimulus preference assessments. Journal of Applied Behavior Analysis, 48, 209–214.
- 56.
Saini, V., Greer, B. D., & Fisher, W. W. (2015). Clarifying inconclusive functional analysis results: Assessment and treatment of automatically reinforced aggression. Journal of Applied Behavior Analysis, 48, 315–330.
- 57.
Saini, V., Gregory, M. K., Uran, K. J., & Fantetti, M. A. (2015). Parametric analysis of response interruption and redirection as treatment for stereotypy. Journal of Applied Behavior Analysis, 48, 96–106.
- 58.
Scalzo, R., Henry, K., Davis, T. N., Amos, K., Zoch, T., Turchan, S., & Wagner, T. (2015). Evaluation of interventions to reduce multiply controlled vocal stereotypy. Behavior Modification, 39, 496–509.
- 59.
Siegel, E. B., & Lien, S. E. (2014). Using photographs of contrasting contextual complexity to support classroom transitions for children with Autism Spectrum Disorders. Focus on Autism and Other Developmental Disabilities, 30, 100–114.
- 60.
Slocum, S. K., & Vollmer, T. R. (2015). A comparison of positive and negative reinforcement for compliance to treat problem behavior maintained by escape. Journal of Applied Behavior Analysis, 48, 563–574.
- 61.
Smith, K. A., Shepley, S. B., Alexander, J. L., Davis, A., & Ayres, K. M. (2015). Self-instruction using mobile technology to learn functional skills. Research in Autism Spectrum Disorders, 11, 93–100.
- 62.
Sniezyk, C. J., & Zane, T. L. (2014). Investigating the effects of sensory integration therapy in decreasing stereotypy. Focus on Autism and Other Developmental Disabilities, 30, 13–22.
- 63.
Speelman, R. C., Whiting, S. W., & Dixon, M. R. (2015). Using behavioral skills training and video rehearsal to teach blackjack skills. Journal of Applied Behavior Analysis, 48, 632–642.
- 64.
Still, K., May, R. J., Rehfeldt, R. A., Whelan, R., & Dymond, S. (2015). Facilitating derived requesting skills with a touchscreen tablet computer for children with autism spectrum disorder. Research in Autism Spectrum Disorders, 19, 44–58.
- 65.
Vargo, K. K., & Ringdahl, J. E. (2015). An evaluation of resistance to change with unconditioned and conditioned reinforcers. Journal of Applied Behavior Analysis, 48, 643–662.
- 66.
Vedora, J., & Grandelski, K. (2015). A comparison of methods for teaching receptive language to toddlers with autism. Journal of Applied Behavior Analysis, 48, 188–193.
- 67.
Wilder, D. A., Majdalany, L., Sturkie, L., & Smeltz, L. (2015). Further evaluation of the high-probability instructional sequence with and without programmed reinforcement. Journal of Applied Behavior Analysis, 48, 511–522.
- 68.
Wunderlich, K. L., & Vollmer, T. R. (2015). Data analysis of response interruption and redirection as a treatment for vocal stereotypy. Journal of Applied Behavior Analysis, 48, 749–764.
Appendix B: Versions of the mean phase difference
In the initial proposal (Manolov & Solanas, 2013), MPD.2013 entails the following steps:
Estimate baseline trend as the average of the differenced baseline phase data:
- 1.
Extrapolate baseline trend, adding the trend estimate (b1(D)) to the last baseline phase data point (\( {y}_{n_A} \)) to predict the first intervention phase data point (\( {\widehat{y}}_{n_A+1} \)). Formally, \( {\widehat{y}}_{n_A+1}={y}_{n_A}+{b}_{1(D)} \). This entails that the intercept of the baseline trend line is \( {b}_{0(MPD.2013)}={y}_{n_A}-{n}_A\times {b}_{1(D)} \).
- 2.
Continue extrapolating adding the trend estimate to the previously obtained forecast. Formally, \( {\widehat{y}}_{n_A+j}={\widehat{y}}_{n_A+j-1}+{b}_{1(D)};j=2,3,\dots, {n}_B \).
- 3.
Obtain MPD as the difference between the actually obtained treatment data (yj) and the treatment measurements as predicted from baseline trend (\( {\widehat{y}}_j \)): \( {MPD}_{2013}=\frac{\sum_{j=1}^{n_B}\left({y}_j-{\widehat{y}}_j\right)}{n_B} \).
In its modified version (Manolov & Rochat, 2015), MPD.2015 entails the following steps:
- 1.
Estimate baseline trend as the average of the differenced baseline phase data: the same b1(D) previously defined.
- 2.
Establish the pivotal point in the baseline at the crossing of Md(x) = Md(1, 2, …, nA) on the abscissa and \( Md(y)= Md\left({y}_1,{y}_2,\dots, {y}_{n_A}\right) \) on the ordinate.
- 3.
Establish a fitted value at an existing baseline measurement occasion around Md(y). Formally, \( {\widehat{y}}_{\left\lfloor Md(x)\right\rfloor }= Md(y)-\left( Md(x)-\left\lfloor Md(x)\right\rfloor \right)\times {b}_1 \).
- 4.
Fit the baseline trend to the whole baseline, subtracting and adding the estimated baseline slope from the fitted value obtained in the previous step, according to the measurement occasion.
Therefore, the intercept of the baseline trend line is defined as:
- 5.
Extrapolate the baseline trend into the treatment phase, starting from the last fitted baseline value: \( {\widehat{y}}_{n_A+1}={\widehat{y}}_{n_A}+{b}_{1(D)} \).
- 6.
Continue extrapolating adding the trend estimate to the previously obtained forecast: \( {\widehat{y}}_{n_A+j}={\widehat{y}}_{n_A+j-1}+{b}_{1(D)};j=2,3,\dots, {n}_B \).
- 7.
Obtain MPD as the difference between the actually obtained treatment data and the treatment measurements as predicted from baseline trend: \( {MPD}_{2015}=\frac{\sum_{j=1}^{n_B}\left({y}_j-{\widehat{y}}_j\right)}{n_B} \).
We propose a third way of defining the intercept, namely, in the same way as estimated in the Theil–Sen estimator, that is, as the median difference between actual data points and the trend multiplied by the measurement occasion: b0(TS) = Md(yi − b1(D) × i); i = 1, 2, …, nA. Note that the slope is still estimated as in the original proposal (Manolov & Solanas, 2013).
Rights and permissions
About this article

Cite this article
Manolov, R., Solanas, A. & Sierra, V. Extrapolating baseline trend in single-case data: Problems and tentative solutions. Behav Res 51, 2847–2869 (2019). https://doi.org/10.3758/s13428-018-1165-x
Published:
Issue Date:
DOI: https://doi.org/10.3758/s13428-018-1165-x