
Abstract
Background
Remote sensing techniques and data are becoming increasingly popular in forest management, e.g. for change detection and health condition analysis. Tree species recognition is a fundamental issue in taking forest inventories, especially in carbon budget modelling. Hyperspectral imagery provides an accurate classification results for large areas based on a relatively small amount of training data.
Results
A hyperspectral image of a forest stand in north-eastern Poland taken using an AISA (Airborne Imaging Spectrometer for Application) Eagle camera was transformed to extract the most valuable spectral differences and was classified into seven tree types (birch, European beech, oak, hornbeam, European larch, Scots pine, and Norway spruce) using nine classification algorithms. The highest overall accuracy and kappa coefficient were 90.3% and 0.9 respectively using three minimum noise fraction bands and maximum likelihood classifier.
Conclusions
Hyperspectral imaging of forests can be used to classify major forest tree species with a good degree of accuracy. It is time-efficient and user-friendly; however, the data and software required means that this approach is still expensive at present.
Background
Remote sensing is the science of acquiring information about objects or areas from a distance, typically from aircraft or satellites.
In tree canopies, the amount of radiation reflected in regions of different wavelengths is related to the chemical and physical properties of single trees as well as biotic and abiotic characteristics of an entire stand. Among the chemical properties of single trees are the levels of lignin, cellulose, nitrogen, chlorophyll, carotenoids, anthocyanins (Asner 1998; Clark et al. 2005; Grant 1987; Clark and Roberts 2012; Ustin et al. 2009), and water (Asner 1998, Gao and Hoetz 1990, Zarco-Tejada et al. 2003, Lee et al. 2010); these affect the health status of the trees (Waser et al. 2014). Among the physical properties of single trees are leaf and wood morphology, transmission characteristics (Asner 1998; Clark et al. 2005; Grant 1987; Clark and Roberts 2012; Ustin et al. 2009), vertical leaf area density (Treuhaft et al. 2002), and age (Ghiyamat et al. 2013; Roberts et al. 1997; Einzmann et al. 2014). The biotic characteristics of the whole stands include leaf and branch density, angular distribution, clumping, tree size compared to neighbours (Leckie et al. 2005, Korpela et al. 2011), and lichens, mosses, herbaceous vegetation, lianas, or other epiphytes (Clark and Roberts 2012). The abiotic characteristics of whole stands include topography, soil type (and its influence), moisture, and microclimate (Portigal et al. 1997).
It is hardly feasible to identify species-specific absorption features in the visible and near-infrared (VIS-NIR) spectral region; however, this is much easier in the shortwave infrared (SWIR) spectral region (Asner 1998). Salisbury (1986) presented leaf-level thermal infrared (TIR) spectra of four species and identified well-defined and notably different spectral features. Salisbury and Milton (1998) obtained close-range thermal reflectance measurements for several other species and reported differences in the spectra in most of them. Ribeiro da Luz and Crowley (2007) found that TIR spectra were associated with several chemical and structural compounds of plants such as cellulose, silica, xylan, and oleanolic acid levels, and reported that TIR signals were much more species-specific than the reflectance signals observed in the visible, shortwave, and infrared regions. Many plants develop chemical and aromatic compounds that might help define species-specific middle infrared and TIR signatures (Ribeiro da Luz and Crowley 2007; Ullah et al. 2012).
Identifying tree species using remote sensing data is useful in the context of detecting changes (Adams et al. 1995) and managing water stress (Cho et al. 2010; Fassnacht et al. 2016). It helps in the development of sustainable management policies (Dalponte et al. 2012, Jones et al. 2010, Plourde et al. 2007, Heinzel and Koch 2012, Kennedy and Southwood 1984) and performance of forest resource (Van Aardt and Wynne 2007) and single tree inventories (Korpela and Tokola 2006; Immitzer et al. 2015; Tompalski et al. 2014). It enables the assessment and monitoring of biodiversity, species compositions (Shang and Chisholm 2014; Wulder et al. 2006), wildlife habitats (Jansson and Angelstam 1999; Pausas et al. 1997), invasive species migrations (Chambers et al. 2013; Van Ewijk et al. 2014), and in the understanding of tree ecology (Chambers et al. 2013, Van Ewijk et al. 2014). It can also be applied to the estimation of insect abundance in forests (Kennedy and Southwood 1984) and the development of species-specific growth and yield models as well as allometric equations (Ørka et al. 2013; Vauhkonen et al. 2014).
Proper forest management and planning based on accurate distinction of tree species requires highly accurate classification maps that cannot yet be produced using the multispectral images typically acquired in four to eight wide spectral bands. Hyperspectral data are more useful for classifying tree species: the only condition is that the species must appear significantly different in the spectral reflectance measured in dozens of narrow spectral intervals (Clark et al. 2005, Heinzel and Koch 2012, Carlson et al. 2010, Dalponte et al. 2010, Dalponte et al. 2011, Stavrakoudis et al. 2014, Farreira et al. 2016). The reflectance of individual tree species is dependent on numerous factors, and the differences are sometimes too subtle to be observed using wide, multispectral bands (Dalponte et al. 2009; Mickelson et al. 1998). Since the technology was released, the cost of hyperspectral images has decreased gradually. It is expected that it will be soon possible to use hyperspectral imagery to study forest ecology and develop management and planning techniques (Innes and Koch 1998; Dalponte et al. 2008; Voss and Sugumaran 2008).
However, hyperspectral images contain a huge amount of auto-correlated data. Principal component analysis (PCA) is often used to solve this problem (Zagajewski 2010; Olesiuk and Zagajewski 2008; Bartold 2008). This widely known technique creates a set of artificial bands in which each band is less informative than the previous one. The minimum noise fraction (MNF) transformation works in a similar manner but reduces the noise first. More detailed information on these transformations is provided later in this paper. This method (MNF) was used by Zagajewski (2010) to classify vegetation in the Tatra Mountains, by Olesiuk and Zagajewski (2008) to classify the land cover of the Bystrzanka river drainage basin, and by Bartold (2008), Dian et al. (2014), and Han et al. (2004) to classify forest tree species. Han et al. (2004) compared the results with those obtained by canonical transformation, while Harsanyi (1994) used the ‘orthogonal subspace projection’ method. This method eliminates the response from non-targets while applying a filter to match desired targets in the data, and is most efficient and effective when the target signatures are distinct.
Algorithms such as the Pixel Purity Index (PPI) (Zagajewski 2010, Olesiuk and Zagajewski 2008, Bartold 2008) or linear spectral unmixing (LSU), which produces ‘maps of abundance’ in which each pixel is assigned to more than one class with a specified probability level (Luo and Chanussot 2009; Villa et al. 2013; Li et al. 2014), can be used to extract the pixels most useful for the classification (endmembers). Schull et al. (2010) also used pure spectral pixels to classify forests in the north-eastern USA and achieved an overall accuracy of 92%.
The ability to successfully classify forest tree species using hyperspectral data was proven for forests in the equatorial zone (Clark et al. 2005; Mickelson et al. 1998; Peerbhay et al. 2013; Goodwin et al. 2005), when seven tree species were classified using linear discriminant analysis (LDA), maximum likelihood (ML), and spectral angle mapping (SAM) methods, with accuracies of 80 to 100%. The hyperspectral data were also used in the tropical and sub-tropical zones (Dalponte et al. 2008, Dian et al. 2014, Dennison and Roberts 2003, Lucas et al. 2008, Yang et al. 2009, Gong et al. 1997, Van Aarst and Norris-Rogers 2008, Bellanti et al. 2016) with accuracies of over 90% and in the temperate zone (Zagajewski 2010; Olesiuk and Zagajewski 2008; Bartold 2008; Dian et al. 2014; Martin et al. 1998; Dalponte et al. 2013; Dmitriev 2014; Tarabalka 2010; Richter et al. 2016) with accuracies of 74 to 93%.
Classification results may be improved using hyperspectral data with light detection and ranging (LIDAR) data (Alonzo et al. 2014). For the temperate and sub-tropical (Hainzel and Koch 2012; Dalponte et al. 2008; Caiyun and Fang 2012) zones, the accuracies were over 80%. Passive optical systems, particularly hyperspectral ones, generally showed higher potential for tree species classification than active synthetic aperture radar (SAR) or LIDAR sensor systems. However, LIDAR data have proven suitable for regions with a low number of species (Fassnacht et al. 2016). Forest stands classified with the highest accuracy in the European temperate zone include mostly homogenous ones, dominated by Scots pine (Pinus sylvestris L.) and Norway spruce (Picea abies L.). Of the broadleaved species, European beech (Fagus sylvatica L.) and oak (Quercus spp. L.) are classified with the highest accuracy, but these classifications have lower accuracies than those of coniferous species (Wietecha et al. 2017).
The aim of this study was to evaluate the accuracy of tree species classification methods using a hyperspectral Airborne Imaging Spectrometer for Application (AISA) Eagle image for a forested area in northern Poland. The following algorithms were evaluated in the study: PCA and MNF transformation (to reduce noise and auto-correlated data), parallelepiped (P), minimum distance (MD1), Mahalanobis distance (MD2), ML, SAM, spectral information divergence (SID), neural net (NN), and support vector machine (SVM) to perform the supervised classification). The results were evaluated using a set of 300 test pixels, deployed randomly across the study/sample plots area, to achieve the most reliable assessment of accuracy.
Materials and methods
Study area
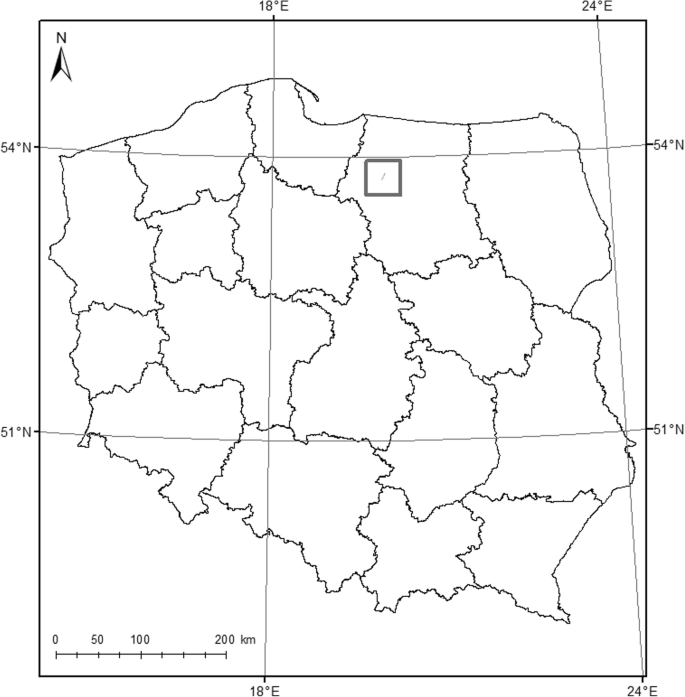
The survey was performed in the Miłomłyn Forest District in the north-eastern Poland (Fig. 1). Background information about this area was obtained from www.milomlyn.olsztyn.lasy.gov.pl/zasoby-lesne. The size of the area and relative tree composition is given in Table 1 and detailed information is listed in Appendix 1. The individual compositions of Scots pine (Pinus sylvestris L.) and European larch (Larix decidua L.) were not provided. The study area was a 15 km2 (10 km long and 1.5 km wide) rectangle including three lakes: Szeląg Wielki, Tabórz (southern part), and Długie (northern part) (Fig. 2.).
The study area

AISA EAGLE hyperspectral image (natural colour composite) constructed by MGGP AERO; the sample plots
A local survey was performed on 9.85 ha of the Miłomłyn Forest District using a series of circular test plots (radius: 12.62 m; area: 500.34 m2) in March 2014. The sample plots were surveyed individually to achieve the highest level of diversity for various forest characteristics (e.g. age, species, forest type), where the influence of slope was minimal (Fig. 2). We corrected for the influence of slope on the tree-position measurements. Each tree with a diameter at breast height (dbh) over 5 cm was inventoried and had the following information recorded: distance from centre of the plot, azimuth (measured from the centre of the plot to each tree), defoliation (assessed using an expert method), and height. The centre of the test plot was determined using the Pathfinder ProXT (Trimble, Sunnyvale, California), Global Navigation Satellite System (GNSS) which functions in the DGPS (Differential Global Positioning System) mode. Its vertical and horizontal accuracy was estimated to be 1.4 m and 0.97 m respectively. Tree heights were measured using a Vertex IV device (Haglof Sweden AB, Langsele, Sweden) and dbh was measured using a Codimex calliper (Codimex, Warsaw, Poland). The data collected were used to calibrate and verify the hyperspectral image classification process. No grey alder trees were found in the plots so this species was not considered further. Although hornbeam occurs only occasionally in the forest, it was found in one plot so was included in the analysis.
Data and software
The hyperspectral image was provided by MGGP AERO and taken by the AISA Eagle camera (SPECIM) on 3 August 2013 at an altitude of 2303–2328 m (single flight). The spectral resolution of the image was 400–970 nm (129 spectral bands, 4–5 nm wide); the radiometric resolution was 12 bits, while the spatial resolution was 1.5 m. The lens size was 18.5 mm and the field of view (FOV) was 37.7°.
The hyperspectral image classification process (as detailed below) was performed using ENVI 5.0 (developed by Exelis Inc.), ArcGIS 10.3 (developed by ESRI), and Statistica 8.0 (developed by StatSoft). The atmospheric correction was carried out using a Quick Atmospheric Correction (Quack) method, radiometric calibration, data reduction (PCA and MNF transformations), band selection, and classifications using nine different algorithms; the accuracy analysis was performed using ENVI 5.0, and ArcGIS 10.3 was used to select training and test pixels. Figures were created using the ETRS 1989 Poland C92 Projected Coordinate System.
Pre-processing
The image was geometrically corrected by MGGP AERO (UTM, Zone 34N, WGS-84). It was also subject to radiometric calibration (using the ENVI ‘Radiometric calibration’ tool–calibration type: reflectance, output interleave: BSQ (band sequential), output data type: float, scale factor: 1.00) and ‘Quick Atmospheric Correction–Quack’ atmospheric correction (Sensor Type: AISA) (Dalponte et al. 2012; Bernstein et al. 2005) (Appendix 2).These procedures were performed using ENVI 5.0.
Data reduction
After the atmospheric correction, the amount of data was reduced. The image containing 129 bands was not an ideal data set with which to perform supervised classification, because it contained too much auto-correlated data. The reduction of the data may be performed using one of two types of methods: data transformation (PCA or MNF transformation) (Clark et al. 2005) or band selection. Data transformation is fully automatic but is based on artificial bands. Band selection is based on original bands but is also very subjective. Both methods were tested. The data reduction was performed using ENVI 5.0 software.
Classification
Finally, four sets of data were classified (using four algorithms):
-
The result of the PCA transformation—first three bands
-
The result of the MNF transformation—first seven bands
-
All 129 bands
-
36 original bands with the largest differences in the spectral profiles generated from training pixels for each tree species
To perform the supervised classification, it was important to choose representative pixels with which to train the algorithm. This was performed using two MNF band compositions and the data from the test plots. A total of 260 training pixels were selected: 15 of which represented birch, 80—European beech, 30—European larch, 30—Scots pine, 30—oak, 10—hornbeam, 15—Norway spruce, and 50—no forest. The pixels of each class were randomly divided into training and validation sets within each plot. There was no spatial distinction between individual plots of training and test pixels; however, in some cases, only training or only test pixels might have been chosen for a single plot.
The spectral reflectance of more than one object (tree, bare ground, or any other) could have been contained in a single 1.5-m pixel. The GNSS device could also have introduced an error. Therefore, the normalised Digital Surface Model (nDSM) was used to overcome this problem. All areas below 1 m were removed. The spatial resolution of the nDSM was 0.5 m, so it was possible to choose training and test pixels containing a single tree or at least a group of trees of a single species. The species were identified using data points representing the location of tree tops. We assumed that they were directly above the section of trunks that had their location mapped during field measurements. By the end of the classification process, the entire area was classified since all pixels, not only the ‘clear’ ones, were used. The classifications were verified on separate data sets and evaluated at the sample plot level.
To perform the supervised classification, nine algorithms were used on three out of four datasets: P, BE, SID, MD1, MD2, ML, SVM, SAM, and NN. The settings for the algorithms are provided in Appendix 2. The classification was performed using ENVI 5.0 software.
Accuracy assessment
The accuracy analysis was performed using 300 test pixels and 2 MNF-band compositions (5-4-3 and 4-3-2) in which the differences in colour among the species were most observable. Some of the pixels representing trees in the sample plots were used as test pixels, but only those that were most recognisable were used (European beech: 50, birch: 20, oak: 50, hornbeam: 10, European larch: 50, no forest: 50, Scots pine: 50, and Norway spruce: 20).
The pixels of each class within each plot were randomly divided into training and validation data sets. There was no spatial distinction between the plots of individual training and test pixels; however, in some cases, only training or only test pixels might have been chosen for a single plot. Nevertheless, both data sets covered the entire study area randomly.
A normalised Digital Surface Model was used to choose the test pixels representing only one particular species and to overcome inaccuracies caused by the spatial resolution of the image and the GNSS device. Only pixels in which a tree top was located close to the centre were selected as test pixels. The accuracy assessment was performed using ENVI 5.0 software.
The classification results of 98 individual sample plots (values represented in %) were compared to the number of trees (values represented in %) belonging to individual species on each plot using the coefficient of determination (R2) calculated in Statistica 8.0. Only trees from the upper canopy were taken into consideration.
Results
The highest accuracy was obtained by the ML algorithm and the data set of the seven MNF bands. The final map was subjected to Majority Filter analysis. The overall accuracy was 91.3% (Kappa—0.9) (Fig. 3.).

Classification results (maximum likelihood on seven minimum noise fraction bands). Legend: red—birch, orange—European beech, yellow—oak, pink—hornbeam, pale blue—European larch, green—Scots pine, dark blue—Norway spruce
The classification performed on all 129 bands ranged from 31 (BE) to 76.7% (SVM), excluding P and NN (below 10%). Spectral Information Divergence also performed relatively well (64.7%). There were not enough training pixels to perform ML and MD2. The classification performed on the 36 original bands ranged from 33.6 (BE) to 66.3% (NN), excluding P (below 20%). Support vector machine also performed relatively well (58.7%). There were not enough training pixels to perform ML and MD2. The classification performed on the first three PCA bands ranged from 30.3 (P) to 88.3% (ML). NN, SAM, and MD2 ranged from 68.3 to 72.7%. The classification performed on the first seven MNF bands ranged from 10.3 (P) to 90.7% (ML). Spectral information divergence and SAM also performed relatively well (84.7%–85%) (Table 2).
The producer’s and user’s accuracy for the four best classification results (each based on a different data set) is provided in Table 3. The producer’s accuracy is the fraction of correctly classified pixels with regard to all pixels of that ground truth class. The user’s accuracy is the fraction of correctly classified pixels with regard to all pixels classified as this class in the classified image.
For the classification based on all 129 spectral bands performed with the SVM algorithm, the highest producer’s accuracy was observed for European larch, no-forest, and Scots pine (92–98%) and the lowest was for birch and hornbeam (10%). The highest user accuracy was observed for Scots pine and hornbeam (94–100%) and the lowest was for European beech (52.4%).
For the classification based on 36 spectral bands performed with the NN algorithm, the highest producer’s accuracy was observed for European larch, no-forest, and Scots pine (94%) and the lowest was observed for birch and hornbeam (0%). The highest user accuracy was observed for Scots pine and hornbeam (71.2–77.4%) and the lowest was for birch, hornbeam, and Norway spruce (0%).
For the classification based on three PCA spectral bands performed with the ML algorithm, the highest producer’s accuracy was observed for European larch and no-forest (100%) and the lowest was for birch (10%). The highest user’s accuracy was observed for Scots pine and Norway spruce (100%) and the lowest was for birch (40%).
For the classification based on 7 MNF spectral bands performed with the ML algorithm, the highest producer’s accuracy was observed for beech, European larch, and no-forest (100%) and the lowest was for birch (10%). The highest user’s accuracy was observed for hornbeam, European larch, Scots pine, and Norway spruce (100%) and the lowest was for birch (33.33%) (Table 3). Birch was spread across the study area with no observable concentration while hornbeam was very rare; only one sample plot contained enough of the latter (85%) to be observable from the aerial ceiling.
The visual comparison of these four classification approaches on a single-plot scale is shown for two chosen plots in Figs. 4 and 5. The best results were achieved using the ML algorithm.

Comparison of the results of four classification techniques (SVM-129, NN-36, ML-PCA, ML-MNF) on a single sample plot (Adams et al. 1995). Legend: red—birch, orange—European beech, yellow—oak, pink—hornbeam, pale blue—European larch, green—Scots pine, dark blue—Norway spruce

Comparison of the results of four classification techniques (SVM-129, NN-36, ML-PCA, ML-MNF) on a single sample plot (Alonzo et al. 2014). Legend: red—birch, orange—European beech, yellow—oak, pink—hornbeam, pale blue—European larch, green—Scots pine, dark blue—Norway spruce
The coefficient of determination between the number of trees and the classification results of individual sample plots ranged from 0.68 (birch) to 0.99 (European larch), while those of Norway spruce, hornbeam, and oak were approximately 0.9 (Table 4).
Discussion
Hyperspectral images are difficult to use for classification purposes because they contain several narrow bands that are correlated with one another. It is important to reduce both the amount of data and the noise before performing classifications. Clark et al. (2005) observed a general increase in accuracy of up to 30 input bands when using a feature selection algorithm combined with a linear discriminant analysis classifier; including more bands produced a lower or equal accuracy when classifying tree species in a tropical environment. Dalponte et al. (2009) reported a slight decrease in accuracy when dropping several bands from the initial 126 in a tree-species classification that combined an SVM classifier with a feature-selection procedure. These findings were most likely also connected to the classifiers applied, given that SVM is known to handle high-dimensional data well without the need for a large training sample size. Thus, it is not strongly affected by the Hughes phenomenon (Dalponte et al. 2009, Hughes 1968), which states that as the number of hyperspectral narrow bands increases, the number of samples (i.e. training pixels) required to maintain a minimum statistical confidence and functionality in hyperspectral data for classification also increases exponentially, making it very difficult to address this issue adequately.
The compositions made from the PCA or MNF bands may be useful to distinguish tree species and create a layer of training pixels or polygons used to perform the supervised classification. However, PCA is not the most suitable method to reduce multidimensionality when the objective is to classify remotely sensed data (Cheriyadat and Bruce 2003). Principal component analysis identifies variabilities that may not perform well in multi-class discrimination and does not differentiate between within-group and between-group variations (Hobro et al. 2010).
The classification of the first seven MNF bands using the ML algorithm resulted in the best overall accuracy (91.3%) and kappa (0.9). The results are comparable to those obtained for a forest species in an equatorial zone (Clark et al. 2005; Mickelson et al. 1998; Peerbhay et al. 2013; Goodwin et al. 2005) at 80–100%, in a tropical and sub-tropical zone (Carlson et al. 2010; Dian et al. 2014; Goodwin et al. 2005; Dennison and Roberts 2003; Lucas et al. 2008; Yang et al. 2009; Gong et al. 1997; van Aardt and Norris-Rogers 2008) at over 90%, and in a temperate zone (Zagajewski 2010; Olesiuk and Zagajewski 2008; Bartold 2008; Dian et al. 2014; Martin et al. 1998; Dalponte et al. 2013; Dmitriev 2014; Tarabalka 2010; Richter et al. 2016) at 74–93%.
Our results have a high correspondence with tree species frequencies at the sample-plot level. Differences between the classification results and data from the local survey may be explained by the leaves and branches of the trees growing near, but outside the borders of, the testing areas. Stumps were observed in the field, so it is possible that some parts of unmapped trees were included in the sample. It is also possible that the reflectance of the input image was disturbed by the plants growing in the lower canopy layers of the stand. Additionally, even the same tree species may have different values of spectral reflectance depending on their age, weather and soil conditions, moisture, vegetation period, and many other factors (Ghiyamat and Shafri 2010), which is the premise for using hyperspectral imagery to detect disease and nutrient deficiencies in even-aged single-species stands.
The set of training polygons used in this study was suitable for performing the classification on a neighbouring area using the same type of data (AISA Eagle hyperspectral image), acquired at the same flight height, during the peak of the vegetation season (July and August), when the weather conditions were similar (although the atmospheric correction was performed). Otherwise, the set of training polygons used should be separate because the spectral signatures of the different tree species varied due to the study area, data type, acquisition date, weather conditions, altitude, and other factors (Ghiyamat and Shafri 2010). However, this is a common issue when dealing with remotely sensed data. Unfortunately, more issues can be expected with hyperspectral data; for example, a comparison to satellite images and reference data is needed. This is due the fact that flight strips are relatively narrow and a longer time is needed to cover large areas. As the result, there will be large differences between single strips or groups of strips. In these cases, a smaller part of the data set is required for training, and verification can be undertaken immediately.
It is also important to select the training and test pixels from the same (or at least neighbouring) areas, using the same methodology, and with a similar proportion of class samples to avoid differences between the accuracy assessment and the true classification results.
Conclusions
The classification based on 7 MNF spectral bands performed with the ML algorithm was found to be the most accurate method for classifying species (overall accuracy of 90.3%), with the highest kappa coefficient of 0.9. The results from the study reported here showed that this method is sufficiently reliable, accurate and user-friendly to be used in practice. However, the data and software required are still expensive, which may limit its practical use by forest managers at present.
Abbreviations
- AISA:
-
Airborne Imaging Spectrometer for Application
- BE:
-
Binary encoding
- BSQ:
-
Band sequential
- DGPS:
-
Differential Global Positioning System
- FOV:
-
Field of view
- GNSS:
-
Global Navigation Satellite System
- LDA:
-
Linear discriminant analysis
- LIDAR:
-
Light detection and ranging
- LSU:
-
Linear spectral unmixing
- MD1:
-
Minimum distance
- MD2:
-
Mahalanobis distance
- ML:
-
Maximum likelihood
- MNF:
-
Minimum noise fraction
- nDSM:
-
Normalised Digital Surface Model
- NN:
-
Neural net
- P:
-
Parallelepiped
- PCA:
-
Principal component analysis
- PPI:
-
Pixel Purity Index
- SAM:
-
Spectral angle mapping
- SAR:
-
Synthetic aperture radar
- SID:
-
Spectral information divergence
- SVM:
-
Support vector machine
References
Adams, J. B., Sabol, D. E., Kapos, V., Filho, R. A., Roberts, D. A., Smith, M. O., & Gillespie, A. R. (1995). Classification of multispectral images based on fractions of endmembers: Application to land−cover change in the Brazilian Amazon. Remote Sensing of Environment, 52(2), 137–154.
Alonzo, M., Bookhagen, B., & Roberts, D. A. (2014). Urban tree species mapping using hyperspectral and LIDAR data fusion. Remote Sensing of Environment, 148, 70–83.
Asner, G. P. (1998). Biophysical and biochemical sources of variability in canopy reflectance. Remote Sensing of Environment, 64(3), 234–253.
Bartold, M. (2008). Klasyfikacja drzewostanów na obrazie satelitarnym Hyperion (EO-1). Teledetekcja Środowiska, 39, 5–29.
Bellanti, L., Blesius, L., Hinnes, E., & Kruse, B. (2016). Tree species classification using hyperspectral imagery: A comparison of two classifiers. Remote Sensing, 8(6), 445–463.
Bernstein, L. S., Sundberg, R. L., Levine, R. Y., Perkins, T. C., & Berk, A. (2005). A new method for atmospheric correction and aerosol optical property retrieval for VIS−SWIR multi− and hyperspectral imaging sensors: QUAC (quick atmospheric correction). Proceedings of the IEEE International Geoscience and Remote Sensing Symposium, 5, 3549–3552.
Caiyun, Z., & Fang, Q. (2012). Mapping individual tree species in an urban forest using airborne LIDAR data and hyperspectral imagery. Photogrammetric Engineering and Remote Sensing, 78(10), 1079–1087.
Carlson, K. M., Asner, G. P., Hughes, R. F., Ostertag, R., & Martin, R. E. (2010). Hyperspectral remote sensing of canopy biodiversity in Hawaiian lowland rainforests. Ecosystems, 10, 526–549.
Chambers, D., Périé, C., Casajus, N., & de Blois, S. (2013). Challenges in modelling the abundance of 105 tree species in eastern North America using climate, edaphic, and topographic variables. Forest Ecology and Management, 291, 20–29.
Cheriyadat, A., & Bruce, L. M. (2003). Why principal component analysis is not an appropriate feature extraction method for hyperspectral data. Proceedings of the IEEE International. Geoscience Remote Sensing Symposium, 6, 3420–3422.
Cho, M. A., Debba, P., Mathieu, R., Naidoo, L., van Aardt, J., & Asner, G. P. (2010). Improving discrimination of savanna tree species through a multiple-endmember spectral angle mapper approach: Canopy-level analysis. IEEE Transactions on Geoscience and Remote Sensing, 48(11), 4133–4142.
Clark, M., Roberts, D., & Clark, D. (2005). Hyperspectral discrimination of tropical rain forest tree species at leaf to crown scales. Remote Sensing of Environment, 96(3–4), 375–398.
Clark, M. L., & Roberts, D. A. (2012). Species-level differences in hyperspectral metrics among tropical rainforest trees as determined by a tree-based classifier. Remote Sensing, 4(6), 1820–1855.
Dalponte, M., Bruzzone, L., & Gianelle, D. (2008). Fusion of hyperspectral and LIDAR remote sensing data for classification of complex forest areas. IEEE Transactions on Geoscience and Remote Sensing, 46, 1416–1427.
Dalponte, M., Bruzzone, L., & Gianelle, D. (2011). Tree species classification in the southern Alps with very high geometrical resolution multispectral and hyperspectral data. Remote Sensing of Environment, 123, 258–270.
Dalponte, M., Bruzzone, L., & Gianelle, D. (2012). Tree species classification in the southern Alps based on the fusion of very high geometrical resolution multispectral/hyperspectral images and LIDAR data. Remote Sensing of Environment, 123, 258–270.
Dalponte, M., Bruzzone, L., Vescovo, L., & Gianelle, D. (2009). The role of spectral resolution and classifier complexity in the analysis of hyperspectral images of forest areas. Remote Sensing of Environment, 133(11), 2345–2355.
Dalponte, M., Ørka, H. O., Ene, L. T., Gobakken, T., & Næsset, E. (2013). Tree crown delineation and tree species classification in boreal forests using hyperspectral and ALS data. Remote Sensing of Environment, 140, 306–317.
Dennison, P. E., & Roberts, D. A. (2003). The effects of vegetation phenology on endmember selection and species mapping in southern California chaparral. Remote Sensing of Environment, 87, 295–309.
Dian, Y., Li, Z., & Pang, Y. (2014). Spectral and texture features combined for forest tree species classification with airborne hyperspectral imagery. Indian Society of Remote Sensing, 43(1), 101–107.
Dmitriev, E. (2014). Classification of the forest cover of Tver oblast using hyperspectral airborne images. Izvestiya - Atmospheric and Oceanic Physics, 50(9), 929–942.
Einzmann, K., Immitzer, M., Bachmann, M., Pinnel, N., & Atzberger, C. (2014). Method analysis for collecting and processing in-situ hyperspectral needle reflectance data for monitoring Norway spruce. Photogrammetrie, Fernerkundung, Geoinformation, 5, 423–434.
Farreira, M. P., Zanotta, D. C., Zortea, M., & andde Souza Filho, C. R. (2016). Mapping tree species in tropical seasonal semi-deciduous forests with hyperspectral and multispectral data. Remote Sensing of Environment, 179, 66–78.
Fassnacht, F. E., Latifi, H., Stereńczak, K., Modzelewska, A., Lefsky, M., Waser, L. T., Straub, C., & Ghosh, A. (2016). Review of studies on tree species classification from remotely sensed data. Remote Sensing of Environment, 186, 64–87.
Fassnacht, F. E., Neumann, C., Förster, M., Buddenbaum, H., Ghosh, A., Clasen, A., Joshi, P. K., & Koch, B. (2014). Comparison of feature reduction algorithms for classifying tree species with hyperspectral data on three central European test sites. IEEE Journal of Selected Topics in Applied Earth Observation and Remote Sensing, 7(6), 2547–2561.
Gao, B. C., & Hoetz, A. F. H. (1990). Column atmospheric water-vapor and vegetation liquid water retrievals from airborne imaging spectrometer data. Journal of Geophysical Research-Atmospheres, 95, 3549–3564.
Ghiyamat, A., & Shafri, H. Z. M. (2010). A review on hyperspectral remote sensing for homogeneous and heterogeneous forest biodiversity assessment. International Journal of Remote Sensing, 31, 1837–1856.
Ghiyamat, A., Shafri, H. Z. M., Mahdiraji, G. A., Shariff, A. R. M., & Mansor, S. (2013). Hyperspectral discrimination of tree species with different classifications using single- and multiple-endmember. International Journal of Applied Earth Observation and Geoinformation, 23, 177–191.
Gong, P., Pu, R., & Zu, B. (1997). Conifer species recognition: An exploratory analysis of in situ hyperspectral data. Remote Sensing of Environment, 62(2), 189–200.
Goodwin, N., Turner, R., & Merton, R. (2005). Classifying eucalyptus forests with high spatial and spectral resolution imagery. An investigation of individual species and vegetation communities. Australian Journal of Botany, 53, 337–345.
Grant, L. (1987). Diffuse and specular characteristics of leaf reflectance. Remote Sensing of Environment, 22, 309–322.
Hainzel, J., & Koch, B. (2012). Investigating multiple data sources for tree species classification in temperate forest and use for single tree delineation. International Journal of Applied Earth Observation and Geoinformation, 18, 101–110.
Han, T., Goodenough, D. G., Dyk, A., & Chen, H. (2004). Hyperspectral feature selection for forest classification IEEE International Geoscience and Remote Sensing Symposium, 2) (pp. 1471–1474). Anchorage.
Harsanyi, J. C. (1994). Hyperspectral image classification and dimensionality reduction: An orthogonal subspace projection approach. Geoscience and Remote Sensing, 32(4), 779–785.
Hobro, A. J., Kuligowski, J., Döll, M., & Lendl, B. (2010). Differentiation of walnut wood species and steam treatment using ATR-FTIR and partial least squares discriminant analysis (PLS-DA). Analytical and Bioanalytical Chemistry, 398(6), 2713–2722.
Hughes, G. F. (1968). On the mean accuracy of statistical pattern recognizers. Transactions on Information Theory, 14, 55–63.
Immitzer, M., Atzberger, C., Einzmann, K., Böck, S., Mattiuzzi, M., Wallner, A., Seitz, R., Pinnel, N., Müller, A., & Frost, M. (2015). Fichten- und Kiefernkarte für Bayern. LWF aktuell. Bayerische Landesanstalt für Wald und Forstwirtschaft, 106, 30–37.
Innes, J. L., & Koch, B. (1998). Forest biodiversity and its assessment by remote sensing. Global Ecology and Biogeography Letters, 7, 397–419.
Jansson, G., & Angelstam, P. (1999). Threshold levels of habitat composition for the presence of long-tailed tit (Aegithalos audatus) in a boreal landscape. Landscape Ecology, 14, 283–290.
Jones, T. G., Coops, N. C., & Sharma, T. (2010). Assessing the utility of airborne hyperspectral and LIDAR data for species distribution mapping in the coastal Pacific Northwest, Canada. Remote Sensing of Environment, 114(12), 2841–2852.
Kennedy, C. E. J., & Southwood, T. R. E. (1984). The number of species of insects associated with British trees: A re-analysis. Journal of Animal Ecology, 53(2), 455–478.
Korpela, I., Heikkinen, V., Hokavaara, E., Rohrbach, F., & Tokola, T. (2011). Variation and directional anisotropy of reflectance at the crown scale – Implications for tree species classification in digital aerial images. Remote Sensing of Environment, 115, 2062–2074.
Korpela, I. S., & Tokola, T. E. (2006). Potential of aerial image-based monoscopic and multiview single-tree forest inventory: A simulation approach. Forest Science, 52(2), 136–147.
Leckie, D. G., Tinis, S., Nelson, T., Burnett, C., Gougeon, F. A., Cloney, E., & Paradine, D. (2005). Issues in species classification of trees in old growth conifer stands. Canadian Journal of Remote Sensing, 31(2), 175–190.
Lee, W., S., Alchanatis, V., Yang, C., Hirafuji, M., Moshou, D., Li, C. (2010). Sensing technologies for precision specialty crop production. Computers and Electronics in Agriculture, 74, 2–33.
Li, J., Xin, H., Gamba, P., & Bioucas-Dias, J. M. (2014). Multiple feature learning for hyperspectral image classification. Transactions on Geoscience and Remote Sensing, 53(3), 1592–1606.
Lucas, R. M., Lee, A. C., & Bunting, P. J. (2008). Retrieving forest biomass through integration of CASI and LIDAR data. International Journal of Remote Sensing, 29, 1553–1577.
Luo, B., & Chanussot, J. (2009). Hyperspectral image classification based on spectral and geometrical features (IEEE International Workshop on Machine Learning for Signal Processing) (pp. 1–6).
Martin, M. E., Newman, S. D., Aber, J. D., & Congalton, R. G. (1998). Determining forest species composition using high spectral resolution remote sensing data. Remote Sensing of Environment, 65, 249–254.
Mickelson, J. G., Civco, D. L., & Silander, J. A. (1998). Delineating forest canopy species in the north-eastern United States using multi-temporal TM imagery. Photogrammetric Engineering and Remote Sensing, 64(9), 891–904.
Olesiuk, D., & Zagajewski, B. (2008). Wykorzystanie obrazów hiperspektralnych do klasyfikacji pokrycia terenu zlewni Bystrzanki. Teledetekcja Środowiska, 40, 125–148.
Ørka, H. O., Dalponte, M., Gobakken, T., Næsset, E., & Ene, L. T. (2013). Characterizing forest species composition using multiple remote sensing data sources and inventory approaches. Scandinavian Journal of Forest Research, 28(7), 677–688.
Pausas, J. G., Austin, M. P., & Noble, I. R. (1997). A forest simulation model for predicting eucalypt dynamics and habitat quality for arboreal marsupials. Ecological Applications, 7(3), 921–993.
Peerbhay, K. Y., Mutanga, O., & Ismail, R. (2013). Commercial tree species discrimination using airborne AISA Eagle hyperspectral imagery and partial least squared discriminant analysis (PLS-DA) in KwaZulu-Natal - South Africa. Remote Sensing, 79, 19–28.
Plourde, L. C., Ollinger, S. V., Smith, M. L., & Martin, M. E. (2007). Estimating species abundance in a northern temperate forest using spectral mixture analysis. Photogrammetric Engineering and Remote Sensing, 73(7), 829–840.
Portigal, F., Holasek, R., Mooradian, G., Owensby, P., Dicksion, M., Fene, M., Elliot, M., Hall, E., and Driggett, D. (1997). Vegetation classification using red-edge first derivative and green peak statistical moment indices with the Advanced Airborne Hyperspectral Imaging System (AAHIS). Third International Airborne Remote Sensing Conference and Exhibition. Copenhagen, Denmark, 7–10 July 1997. II (Ann Arbor, MI: ERIM): 789–797.
Ribeiro da Luz, B., & Crowley, J. K. (2007). Spectral reflectance and emissivity features of broad leaf plants: Prospects for remote sensing in the thermal infrared (8.0–14.0 μm). Remote Sensing of Environment, 109, 393–405.
Richter, R., Reu, B., Wirth, C., Doktor, D., & Vohland, M. (2016). The use of airborne hyperspectral data for tree species classification in a species-rich central European forest area. International Journal of Applied Earth Observation and Geoinformation, 52, 464–474.
Roberts, D. A., Green, R. O., & Adams, J. B. (1997). Temporal and spatial patterns in vegetation and atmospheric properties from AVIRIS. Remote Sensing of Environment, 62, 223–240.
Salisbury, J. W. (1986). Preliminary measurements of leaf spectral reflectance in the 8-14 μm region. International Journal of Remote Sensing, 7(12), 1879–1886.
Salisbury, J. W., & Milton, N. M. (1998). Thermal infrared (2.5- to 13.5-μm) directional hemispherical reflectance of leaves. Photogrammetric Engineering and Remote Sensing, 54(9), 1301–1304.
Schull, M. A., Knyazikhin, Y., Xu, L., Samanta, A., Ganguly, S., & Latorre Carmona, P. (2010). Canopy spectral invariants. Part 2: Application to classification of forest types from hyperspectral data. Journal Quantitative Spectroscopy Radiative Transfer, 112, 736–750.
Shang, X., & Chisholm, L. A. (2014). Classification of Australian native Forest species using hyperspectral remote sensing and machine-learning classification algorithms. IEEE Journal of Selected Topics in Applied Earth Observation and Remote Sensing, 7(6), 2481–2489.
Stavrakoudis, D. G., Dragozi, E., Gitas, I. Z., & Karydas, C. G. (2014). Decision fusion based on hyperspectral and multispectral satellite imagery for accurate forest species mapping. Remote Sensing, 6(8), 6897–6928.
Tarabalka, Y. (2010). Segmentation and classification of hyperspectral images using minimum spanning forest grown automatically selected markers. IEEE Transactions on Systems, Man, and Cybernetics, 40(5), 1267–1279.
Tompalski, P., Coops, N. C., White, J. C., & Wulder, M. A. (2014). Simulating the impacts of error in species and height upon tree volume derived from airborne laser scanning data. Forest Ecology and Management, 327, 167–177.
Treuhaft, R. N., Asner, G. P., Law, B. E., & Tuyl Van, S. (2002). Forest leaf area density profiles from the quantitative fusion of radar and hyperspectral data. Journal of Geophysical Research, 107(D21), ACL 7–1 – ACL 7-13.
Ullah, S., Schlerf, M., Skidmore, A. K., & Hecker, C. (2012). Identifying plant species using mid wave infrared (2.5–6 μm) and thermal infrared (8–14 μm) emissivity spectra. Remote Sensing of Environment, 118, 95–102.
Ustin, S., Gitelson, A. A., Jacquemoud, S. M., Asner, G. P., Gamon, J., & Zarco-Tejada, P. J. (2009). Retrieval of foliar information about plant pigment systems from high resolution spectroscopy. Remote Sensing of Environment, 113, 67–77.
Van Aardt, J., & Norris-Rogers, M. (2008). Spectral-age interactions in managed, even-aged eucalyptus plantations: Application of discriminant analysis and classification and regression trees approaches to hyperspectral data. International Journal of Remote Sensing, 29(6), 1841–1845.
Van Aardt, J., & Wynne, R. H. (2007). Examining pine spectral separability using hyperspectral data from an airborne sensor: An extension of field-based results. International Journal of Remote Sensing, 28(2), 431–436.
Van Ewijk, K. Y., Randin, C. F., Treitz, P. M., & Scott, N. A. (2014). Predicting fine-scale tree species abundance patterns using biotic variables derived from LIDAR and high spatial resolution imagery. Remote Sensing of Environment, 150, 120–131.
Vauhkonen, J., Ørka, H. O., Holmgren, J., Dalponte, M., Hainzel, J., & Koch, B. (2014). Tree species recognition based on airborne laser scanning and complementary data sources. Forestry applications of airborne laser scanning. In M. Maltamo, E. Naesset, & J. Vauhkonen (Eds.), Forestry Applications of Airborne Laser Scanning (pp. 135–156). Dordrecht: Springer.
Villa, A., Chanossut, J., Benediktsson, J. A., Jutten, C., & Dambreville, R. (2013). Unsupervised methods for the classification of hyperspectral images with low spatial resolution. Pattern Recognition, 46(6), 1556–1568.
Voss, M., & Sugumaran, R. (2008). Seasonal effect on tree species classification in an urban environment using hyperspectral data. LIDAR, and an object-oriented approach. Sensors, 8, 3020–3036.
Waser, L. T., Küchler, M., Jütte, K., & Stampfer, T. (2014). Evaluating the potential of world-View-2 data to classify tree species and different levels of ash mortality. Remote Sensing, 6(5), 4515–4545.
Wietecha, M., Modzelewska, A., & Stereńczak, K. (2017). Airborne hyperspectral data for the classification of tree species a temperate forests (Wykorzystanie lotniczej teledetekcji hiperspektralnej w klasyfikacji gatunkowej lasów strefy umiarkowanej). Sylwan, 161(1), 3–17.
Wulder, M. A., Dymond, C. C., White, J. C., Leckie, D. G., & Caroll, A. L. (2006). Surveying mountain pine beetle damage of forests: A review of remote sensing opportunities. Forest Ecology and Management, 221, 27–41.
Yang, C., Everitt, J. H., Fletcher, R. S., Jensen, R. R., & Mausel, P. W. (2009). Evaluating AISA+ hyperspectral imagery for mapping black mangrove along the South Texas. Gulf Coast. Photogrammetric Engineering and Remote Sensing, 75, 425–435.
Zagajewski, B. (2010). Ocena przydatności sieci neuronowych i danych hiperspektralnych do klasyfikacji roślinności Tatr Wysokich. Teledetekcja Środowiska, 43, 1-113.
Zarco-Tejada, P. J., Pushnik, J. C., Dobrowski, S., & Ustin, S. L. (2003). Steady-state chlorophyll a fluorescence detection from canopy derivative reflectance and double-peak red-edge effects. Remote Sensing of Environment, 84, 283–294.
Acknowledgements
We would like to thank Mariusz Ciesielski, Leopold Leśko, Aleksander Rybski, Marek Przywózki, Maciej Sarnowski, and Michał Brach, who conducted the local survey and established 98 sample plots in the Miłomłyn Forest District.
Funding
The study was performed in relation to the project entitled “Modelling carbon budget on the local and global scale in the State Forests Holding and developing scientific input parameters and management scenarios for Poland” funded by the State Forests (grant number BLP-392; grant recipient: Mr. Radomir Bałazy).
Availability of data and materials
The aerial image from the AISA Eagle camera was provided by MGGP Aero. The image is property of the Forest Research Institute and may be disclosed with permission from the Director of the Forest Research Institute.
The analysis was performed using ENVI 5.0 and ArcGIS 10.3 provided by ESRI Polska.
Author information
Authors and Affiliations
Contributions
TH undertook the literature review, methodology, analysis, manuscript writing, and field survey. KS was involved in conceiving and planning the study, methodology, analysis, manuscript writing, and reviewing. RB compiled the data and literature review, and reviewed the manuscript. All authors read and approved the final manuscript.
Corresponding author
Ethics declarations
Authors’ information
TH—Master of Science in Remote Sensing and Geoinformatics, Assistant in the Forest Research Institute, and doctoral student.
KS—Ph.D.in Forestry, Adjunct in the Forest Research Institute, and coordinator on two projects (“A complex forest dynamics monitoring of the Białowieża Forest based on remote sensing data” and “An estimation of biomass and carbon resources in forests based on remote sensing data”) with 75 publications and 223 citations (Research Gate, February 2018).
RB—Master of Science in Forestry, Assistant in the Forest Research Institute, and coordinator of two projects (“A forest information system of monitoring and forest condition assessment of Sudety and West Beskidy” and “Carbon budget modelling of the Polish State Forests Holding on the local and global scale and the development of input parameters and economic scenarios for Poland”) with 53 publications and 120 citations (Research Gate, February 2018).
Ethics approval and consent to participate
Not applicable.
Consent for publication
Not applicable.
Competing interests
The authors declare that they have no competing interests.
Publisher’s Note
Springer Nature remains neutral with regard to jurisdictional claims in published maps and institutional affiliations.
Appendices
Appendix 1
Appendix 2
Rights and permissions
Open Access This article is distributed under the terms of the Creative Commons Attribution 4.0 International License (http://creativecommons.org/licenses/by/4.0/), which permits unrestricted use, distribution, and reproduction in any medium, provided you give appropriate credit to the original author(s) and the source, provide a link to the Creative Commons license, and indicate if changes were made.
About this article

Cite this article
Hycza, T., Stereńczak, K. & Bałazy, R. Potential use of hyperspectral data to classify forest tree species. N.Z. j. of For. Sci. 48, 18 (2018). https://doi.org/10.1186/s40490-018-0123-9
Received:
Accepted:
Published:
DOI: https://doi.org/10.1186/s40490-018-0123-9