
Abstract
To investigate the load-carrying capacity of high-strength concrete-encased steel angle (CES-A) columns, in which corner steel angles are encased in concrete and transmit column loads directly, a numerical study was performed by using a proposed analysis model. The proposed model considered the strain compatibility, confinement effect, local buckling, and premature cover-spalling, and was verified against previous experimental study results. To investigate the effect of design parameters, a parametric study was conducted, and based on the parametric study results, a simple approach was also discussed to predict the residual strength (2nd peak load) after spalling of concrete cover at corners (1st peak load). The numerical investigations showed that when steel contribution and confinement efficiency are high, CES-A columns exhibit relatively large load-carrying capacity even after cover-spalling, due to the maintained strength of confined concrete and yielding of steel angles, and the proposed simple approach gave a good prediction for the residual strength.
1 Introduction
Steel–concrete composite columns such as concrete-encased steel (CES) and concrete-filled steel tube (CFT) columns have large load-carrying capacity and high local stability due to composite action, and high-strength materials improve structural safety and space efficiency. Thus, the use of high-strength composite columns is growing in the construction of high-rise and long-span structures.
When high-strength steel is used for conventional CES columns (consisting of a wide-flange steel core and concrete encasement), early crushing of concrete encasement needs to be considered, because the steel core may not develop its full plastic strength at the concrete failure, particularly under flexural loading (Kim et al. 2012, 2014). On the other hand, CFT columns using high-strength steel show excellent structural performance, because the steel tube provides good lateral confinement to concrete core and the concrete core restrains local buckling of the steel tube (Kim et al. 2014). However, in terms of fire proofing, local instability, diaphragm connections, and concrete compaction, CES columns still have advantages over CFT columns. Thus, further studies are necessary for high-strength CES columns.
To improve the load-carrying capacity of CES columns, concrete-encased steel angle (CES-A) sections can be used (Kim et al. 2014, 2017; Eom et al. 2014; Hwang et al. 2015, 2016). In the case of CES-A sections (Fig. 1), the contributions of steel to flexural strength and flexural stiffness are maximized: the strain and moment-arm of steel are significantly increased by placing steel angles at four corners, and the corner steel angles connected by transverse reinforcement provide good confinement to concrete core (Kim et al. 2014, 2017). Because of these advantages, along with constructability improvement by prefabrication, CES-A sections have recently become popular in Korea.

Advantages of concrete-encased steel angle (CES-A) section (Kim et al. 2017).
Structural steel angles for columns have been widely studied and used in various ways: (1) to externally strengthen existing RC columns with batten plates (i.e., steel jacketing for reconstruction or seismic retrofitting) (Critek 2001; Zheng and Ji 2008a, b; Montuori and Piluso 2009; Nagaprasad et al. 2009; Calderon et al. 2009; Badalamenti et al. 2010; Garzon-Roca et al. 2011a, b, 2012; Campione 2012a, b; Khalifa and Al-Tersawy 2014; Tarabia and Albakry 2014; Cavaleri et al. 2016); (2) to replace wide-flange members with the built-up members connected by battens (Hashemi and Jafari 2004); (3) to reduce laborious fieldwork of composite columns by prefabrication (Kim et al. 2011; Eom et al. 2014; Hwang et al. 2015, 2016); and/or (4) to improve structural capacity and cost efficiency of composite columns by maximizing the contribution of high-strength steel (Kim et al. 2014, 2017). According to the primary purpose, steel angles could be either encased in concrete or exposed, and could transmit column loads or not (providing confinement only). Especially for the steel jacketing, extensive studies are available. However, the discussions in the existing studies were limited to (1) low-strength materials (because the steel jacketing is to strengthen deficient columns) and (2) confinement of non-buckled steel angles (because the externally attached steel angles are generally not subjected to high compression), and (3) the effect of concrete cover was not involved (because the externally attached steel angles are exposed).
In the present study, to investigate the load-carrying capacity of high-strength CES-A columns, in which corner steel angles are encased in concrete and transmit column loads directly (i.e., composite columns), a numerical study was performed using a proposed analysis model. The proposed model considered the strain compatibility, confinement effect, local buckling, and premature cover-spalling. For verification, the predictions by the proposed model were compared with previous experimental study results (Kim et al. 2014, 2017; Eom et al. 2014; Hwang et al. 2016), and to supplement the test results, a numerical parametric study was conducted for various design parameters. To predict residual strength after spalling of concrete cover at corners, a simple approach was also discussed.
2 Previous Experimental Studies
Kim et al. (2014, 2017) performed eccentric axial load tests for four CES-A columns with various transverse reinforcements (lattices, battens, links, and rectangular spirals) using Grade 800 MPa steel and 100 MPa concrete (Table 1; Figs. 2, 3). The test results showed that even after spalling of concrete cover at corners (1st peak) the axial load continuously increased up to the 2nd peak without significant degradation in stiffness, the maximum load and effective flexural stiffness of the CES-A columns were 1.53 and 2.07 times those of a conventional CES column using a wide-flange steel core of the same area due to the high contribution of steel angles, and the 2nd peak load was strongly affected by confinement of transverse reinforcement and steel angles and local buckling of steel angles. Eom et al. (2014) and Hwang et al. (2016) performed concentric axial load tests and flexural tests for twelve CES-A members (yield strength of steel f ys = 444 MPa and compressive strength of concrete \( f^{\prime}_{c} \) = 23.5 MPa). The test parameters included the sectional ratio of steel angles and vertical spacing of links to investigate the confinement effect and the flexural, shear, and bond resistances (Table 1; Figs. 2, 3). Additionally, to evaluate seismic performance, Hwang et al. (2015, 2016) conducted cyclic load tests for CES-A columns and beam-column joints. The test results showed that, in the case of the concentrically loaded specimens, the uniaxial strength was greater than the design strength \( P_{o} = 0.85f^{\prime}_{c} A_{c} + f_{ys} A_{s} + f_{yl} A_{l} \) (A c , A s , A l = area of concrete, steel, or longitudinal bars, and f yl = yield strength of longitudinal bars) due to the confinement effect. In the case of the flexurally loaded specimens, crushing of concrete cover (corresponding to the ultimate compressive strain of ε cu = 0.003) did not control the maximum deformation due to the confinement effect, and ductile behavior was maintained until steel angles reached their fracture strain (ε cs = 0.015).


Also, the previous experimental study results (Kim et al. 2014, 2017; Eom et al. 2014; Hwang et al. 2015, 2016) showed that the strain compatibility method of ACI 318-14 (2014) with ε cu = 0.003 underestimated the load-carrying capacity of the CES-A columns by neglecting the confinement effect of steel angles and transverse reinforcement on concrete core. On the other hand, the load-carrying capacity was less than the prediction by the plastic stress distribution method of Eurocode 4 (2005) due to failure (spalling or crushing) of concrete cover earlier than yielding of steel angles. As such, since the load-carrying capacity of CES-A columns is strongly affected by the behavior of concrete cover and steel angles, further studies are required for those effects.
3 Nonlinear Numerical Analysis
To investigate the load-carrying capacity of CES-A columns with various design parameters, nonlinear numerical analysis was performed. To this end, the fiber model analysis method was used (El-Tawil and Deierlein 1996; Kim et al. 2012, 2014, 2017) considering the strain compatibility, confinement effect of steel angles and transverse reinforcement, local buckling of steel angles and longitudinal bars, premature spalling of concrete cover at corners, effect of local buckling of steel angles on confinement, and second-order effect (Fig. 4). In the analysis model, a composite section was divided into four regions to evaluate the contribution of each structural component: unconfined concrete cover, confined concrete core, steel angles, and longitudinal bars. The detailed modeling equations and analysis procedure are given in the following subsections.

Material, section, and geometry models for nonlinear numerical analysis.
3.1 Concrete and Confinement
Since the distribution of confining pressure in CES-A sections is similar to that of rectangular tied RC sections, existing concrete confinement models can be used, regarding steel angles and transverse reinforcement as longitudinal bars and transverse bars, respectively (Montuori and Piluso 2009; Nagaprasad et al. 2009). In the present study, the compressive stress–strain relationship of concrete was characterized by the confinement model of Saatcioglu and Razvi (Saatcioglu and Razvi 1992; Razvi and Saatcioglu 1999) (Fig. 4a, b), which is applicable to a wide range of materials (concrete of \( f^{\prime}_{c} \) = 30 – 130 MPa and transverse reinforcement of up to \( f_{yt} \) = 1400 MPa), uses the actual tensile stress of transverse reinforcement at the peak stress of confined concrete (instead of assuming yielding of transverse reinforcement), and was verified against extensive test results of columns under concentric and eccentric loadings. In the model, the strength and ductility of confined concrete are defined as a function of the equivalent uniform lateral confining pressure \( \sigma_{le} \), and the tensile stress of concrete is ignored (Eq. (1)).
where \( f_{c} \) and \( \varepsilon_{c} \) = concrete stress and corresponding strain; \( f^{\prime}_{c} \) and \( \varepsilon_{co} \) = peak stress and corresponding strain (or peak strain); \( \varepsilon_{c85} \) = strain corresponding to 0.85 \( f^{\prime}_{c} \) after peak stress; \( r = E_{c}/\left({E_{c} - E_{c,\sec}} \right) \) = modular ratio; \( E_{c} = 3320\sqrt {f^{\prime}_{c}} + 6900 \) = elastic modulus; and \( E_{c,\sec} = f^{\prime}_{c}/\varepsilon_{co} \) = secant modulus at peak stress (\( E_{c,\sec} \le E_{c} \)). Calculations of these material properties for unconfined concrete and confined concrete are available in the literature (Saatcioglu and Razvi 1992; Razvi and Saatcioglu 1999) and summarized in Appendix.
To take into account the distinctive local failure mechanisms of CES-A columns in the analysis, the concrete model was modified as follows.
-
(1)
Concrete cover is a protection of steel and reinforcement against corrosion and fire (American Concrete Institute 2014), and premature spalling of concrete cover may occur due to shrinkage of concrete and weakness planes between concrete cover and concrete core, which are created by longitudinal and transverse reinforcements (Collins et al. 1993; Cusson and Paultre 1994). This phenomenon is more obvious when higher strength concrete and denser reinforcement are used (Collins et al. 1993; Cusson and Paultre 1994). Especially in CES-A columns, the premature cover-spalling is more pronounced at corners due to the smooth surface of steel angles (Kim et al. 2014, 2017). Thus, for the stress \( f_{c,u} \) of concrete cover at corners, the proposed model assumed Eq. (2) (case 1 in Fig. 5). In the absence of experimental data, the ultimate strain of \( \varepsilon_{cu,u} \) = 0.003 is recommended based on test results (Kim et al. 2014, 2017).
$$ f_{c,u} = 0\;{\text{if}}\;\varepsilon_{c} > \varepsilon_{c,u} \;{\text{for}}\;{\text{concrete}}\;{\text{cover}}\;{\text{at}}\;{\text{corners}} $$(2)Fig. 5 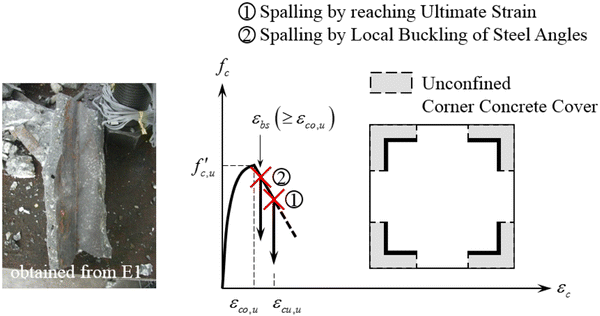
Spalling of corner concrete cover.
-
(2)
Steel angles provide good confinement to concrete core (Calderon et al. 2009; Montuori and Piluso 2009; Nagaprasad et al. 2009; Badalamenti et al. 2010; Kim et al. 2014, 2017; Eom et al. 2014; Hwang et al. 2015, 2016), but the effect of local buckling on the confinement should be also considered. Thus, unlike the existing models (Calderon et al. 2009; Montuori and Piluso 2009; Nagaprasad et al. 2009; Badalamenti et al. 2010), in which the full leg \( b_{s} \) of steel angles was assumed to exert the confining pressure in whole analysis steps, the proposed model assumed that only the effective leg \( b_{{s,{\text{eff}}}} \) exerts the confining pressure after local buckling of steel angles (Fig. 6). The effective leg also varies in vertical, but concrete failure occurs at the weakest point (i.e., at the mid-height within a buckling length). Thus, in the calculation of the geometrical effectiveness coefficient \( k_{2} \) (see Appendix), Eq. (3) was used for the ineffective width \( w_{i} \) (\( b_{c} \) = dimension of confined concrete) to consider the reduction in confining pressure by local buckling.
$$ w_{i} = b_{c} - 2b_{{s,{\text{eff}}}} $$(3)Fig. 6 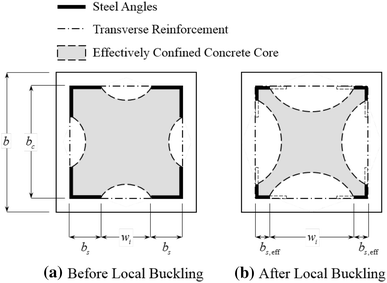
Confinement of steel angles and transverse reinforcement.


It is noted that when battens are used for transverse reinforcement, the center-to-center spacing \( s_{t} \) can be substituted by an effective spacing in the calculation of \( k_{2} \) (Montuori and Piluso 2009; Nagaprasad et al. 2009). Thus, the clear spacing \( s_{c} = s_{t} - h_{t} \) (\( h_{t} \) = height of a batten) was used as the effective spacing. Calculation of the effective leg \( b_{{s,{\text{eff}}}} \) considering local buckling of steel angles under non-uniform compression is given in the next subsection. Figure 7 shows an example for the confining pressure \( \sigma_{le} \) under pure compression. As shown in the figure, the confining pressure is gradually decreased after local buckling of steel angles. The reduction of the confining pressure due to the local buckling has an effect on post-peak behavior (or ductility) of CES-A columns.

Reduction of confining pressure after local buckling of steel angles.
3.2 Steel Angles and Local Buckling
The stress–strain relationship of high-strength steel angles was characterized by a rounded curve (Fig. 4c and Eq. (4)) (Ramberg and Osgood 1943; Rasmussen 2003). For mild steel angles, a typical trilinear curve (with elastic, plastic, and strain-hardening ranges) can be used (Zubydan and ElSabbagh 2001).
where \( f_{s} \) and \( \varepsilon_{s} \) = steel stress and corresponding strain; \( f_{ys} \) and \( f_{us} \) = yield and ultimate stresses; \( \varepsilon_{ys} \) and \( \varepsilon_{us} \) = yield and ultimate strains; and \( E_{s} \) = elastic modulus. For high-strength steel, 0.2% proof stress can be used as the yield stress and \( E_{0.2} = E_{s}/\left[{1 + 0.002n/\left({f_{ys}/E_{s}} \right)} \right] \) = tangent modulus at the 0.2% proof stress; \( \varepsilon_{ys} = f_{ys}/E_{s} + 0.002 \); \( n = \left[{1 - \left({0.2 + 185f_{ys}/E_{s}} \right)f_{us}/f_{ys}} \right]/0.0375 + 5 \); and \( m = 1 + 3.5f_{ys}/f_{us} \).
Generally, in the design of conventional CES columns, local buckling of the steel core is not considered, because concrete encasement prevents the local buckling. However, in the case of CES-A columns, the structural behavior after spalling of concrete cover at corners is strongly affected by local buckling of steel angles. Particularly, since composite columns are likely to be subjected to eccentric loads and relatively thick steel sections are preferred to support construction loads before concrete develops its design strength, much concern should be given to inelastic local buckling under non-uniform compression. The critical buckling stress \( f_{bs} \) in elastic and inelastic ranges can be determined by the well-known formula of Eq. (5) (Gerard 1946), and the post-local buckling behavior can be described by the effective width approach (von Karman et al. 1932; Winter 1947; Shanmugam et al. 1989; Usami 1993; Bambach and Rasmussen 2004a, b; Bambach and Rasmussen 2004; Liang et al. 2006; Mazzolani et al. 2011). In the effective width approach, the stress redistribution within a buckled steel plate is simplified by assuming that only a certain width of the plate remains effective.
where \( \eta \) = plasticity reduction factor; \( k_{b} \) = local buckling coefficient; \( \nu \) = Poisson’s ratio; and \( b_{s} \) and \( t_{s} \) = width and thickness of steel, respectively.
The plasticity reduction factor was calculated by Eq. (6) (proposed by Stowell (1948), and Mazzolani et al. (2011) experimentally verified that the equation gives a good prediction for the critical load of steel angles) and the Poisson’s ratio in elastic and inelastic ranges was calculated by Eq. (7) (Gerard and Becker 1957; Mazzolani et al. 2011).
where \( E_{s} \), \( E_{s,\sec} \), and \( E_{s,\tan} \) = elastic, secant (\( = f_{s}/\varepsilon_{s} \)), and tangent (\( = df_{s}/d\varepsilon_{s} \)) moduli; and \( \nu_{e} \) and \( \nu_{p} \) = elastic (= 0.3) and fully plastic (= 0.5) values of Poisson’s ratio, respectively.
The legs of steel angles can be modeled as a plate simply supported along three edges with one longitudinal edge free (Timoshenko and Gere 1985), and Bambach and Rasmussen (2004a, b) proposed two methods (elastic and plastic effective width methods) for the plate element to consider stress gradient and initial imperfections (geometric imperfection and residual stress). Of the two, the elastic effective width method (Table 2; Fig. 8) was implemented in the present study: although the elastic effective width method underestimates the ultimate flexural strength of the plate element (Bambach and Rasmussen 2004a, b), it is consistent with current design codes (Bambach and Rasmussen 2004a, b) and more suitable to calculate the geometrical effectiveness coefficient \( k_{2} \) of confined concrete.

Effective leg of steel angles after local buckling.
Bambach and Rasmussen (2004a, b) calculated the local buckling coefficient by finite strip analysis with large half-wavelengths (or for long plates). However, since the local buckling coefficient is affected by boundary conditions and plate geometry, the effect of transverse reinforcement needs to be considered (Timoshenko and Gere 1985). Thus, the local buckling coefficient was modified using CUFSM (Li and Schafer 2010), which is an open source finite strip elastic stability analysis program, and regression analysis. The modified equations for the local buckling coefficient considering the spacing of transverse reinforcement are given in Table 2 (the newly introduced second term \( C_{k} \left({b_{s}/s_{t}} \right)^{2} \) is the modification).
The critical buckling strain \( \varepsilon_{bs} \) of steel angles was assumed to be greater than the peak strain \( \varepsilon_{co,u} \) of concrete cover (i.e., \( \varepsilon_{bs} \ge \varepsilon_{co,u} \)) because concrete cover restrains local buckling of steel angles (Chen and Lin 2006), and local bucking of steel angles was assumed to incorporate spalling of concrete cover at corners (i.e., \( f_{c,u} = 0 \) if \( \varepsilon_{s} \ge \varepsilon_{bs} \)) (case 2 in Fig. 5).
3.3 Longitudinal Bars and Local Buckling
For longitudinal bars of mild steel, a trilinear stress–strain curve was used (Fig. 4d). In the figure, \( \varepsilon_{yl} \), \( \varepsilon_{hl} \), \( \varepsilon_{ul} \), \( f_{yl} \), \( f_{hl} \), \( f_{ul} \) are yield, hardening, and ultimate strains, and their corresponding stresses, respectively (assuming \( \varepsilon_{hs} = 10\varepsilon_{ys} \) and \( \varepsilon_{us} \) = 0.15 for mild steel (Zubydan and ElSabbagh 2001)). Local buckling of longitudinal bars was assumed to initiate when the strain of longitudinal bars reaches the peak strain of concrete cover (i.e., \( \varepsilon_{bl} = \varepsilon_{co,u} \)) (Gomes and Appleton 1997; Chen and Lin 2006), and post-local buckling behavior was modeled by the plastic mechanism approach (or yield-line analysis, Eq. (8)) (Morino et al. 1986; Gomes and Appleton 1997).
where \( \varepsilon_{l} \) and \( f_{l} \) = strain and corresponding stress; \( f_{bl} \) = stress at the onset of local buckling (\( \varepsilon_{l} = \varepsilon_{bl} \)); \( s_{bl} \) = local buckling length (assumed to be the vertical spacing \( s_{t} \) of transverse reinforcement); \( X = \sqrt {1 - \left[{1 - \left({\varepsilon_{l} - \varepsilon_{bl}} \right)} \right]^{2}} \); and \( D_{l} \) = diameter of longitudinal bars.
3.4 Bond Strength between Concrete and Steel
In the case of CES-A sections, frictional bond between concrete and steel is insignificant due to the smooth surface of steel angles, but transverse reinforcement provides two mechanical bond mechanisms (concrete bearing and dowel action). The authors experimentally investigated the bond resistance of CES-A beams (Eom et al. 2014), and it was found that the bond resistance is mainly provided by concrete bearing at a small flexural deformation and by dowel action at a large flexural deformation, and bond-slip of tension steel angles affects the structural behavior. Thus, to prevent premature bond-slip, a denser spacing of transverse reinforcement needs to be used. However, in the case of CES-A columns, the effect of bond-slip is less pronounced because large axial compression is expected to apply and external forces are transferred to concrete and steel angles directly. Thus, in the present study, the bond-slip was not considered for simplicity.
3.5 Second-order Effect
The overall behavior of a column is affected by the second-order effect. The second-order effect can be approximately taken into account by assuming a cosine curve for the deflection shape of the column (Fig. 4e) (Westergaard and Osgood 1928). For the given eccentricity \( e_{0} \) and compressive strain \( \varepsilon_{c} \), the curvature \( \kappa_{m} \) at the mid-height section was determined by iterations so that the force equilibrium of Eq. (9) is satisfied.
where \( M_{m} \) = moment at the mid-height section; \( f_{i} \), \( A_{i} \), \( y_{i} \) = stress, area, and moment-arm (from the centroid of the composite section) of each fiber element; \( P = \varSigma \left({f_{i} A_{i}} \right) \) = axial load; \( \Delta_{m} = \kappa_{m}/\left({\pi/L_{k}} \right)^{2} \) = lateral deflection at the mid-height section; and \( L_{k} \) = buckling length.
3.6 Verifications
For verification, the nonlinear numerical analysis results by the proposed model were compared with the previous test results (Kim et al. 2014; 2017; Eom et al. 2014; Hwang et al. 2016). Table 1 and Figs. 2, 3 present the material and geometric properties, section types, and transverse reinforcement types of the previous test specimens.
Figure 9 shows the comparison. Although some discrepancies were observed in the behavior, the predictions (thin dashed lines) generally agreed well with the test results (thick solid lines): the mean and standard deviation of prediction-to-test ratios were 1.02 and 0.10 for the maximum load (the larger of the 1st and 2nd peak loads) or 1.09 and 0.35 for the secant stiffness at the maximum load (Table 3). The discrepancies in the behavior are mainly attributed to local failures of the test specimens such as weld-fracture between steel angles and lattices in E1 (Fig. 9a) (Kim et al. 2014), premature spalling of concrete cover in C1 – C5 (Fig. 9e–i) (Hwang et al. 2016), premature tensile fracture of steel angles in F3 (Fig. 9l) (Eom et al. 2014), and premature bond-slip of tension steel angles in F4, which is a beam specimen (Fig. 9m) (Eom et al. 2014). It is noteworthy that the onset of local buckling of steel angles resulting from the numerical analysis (marked by hollow triangles) corresponded fairly well to the sudden drop or abrupt cover-spalling in the post-peak behavior of C1–C5 and F1–F7 (marked by solid triangles). Although the exact strain and location of local buckling in the actual test specimens could not be detected (because steel angles were encased in concrete and the relatively thick steel angles did not buckle enough to recognize), this agreement also confirms the validity of the proposed model.

Comparison of numerical analysis results with previous test results (evaluated at mid-height section).
For more detailed investigation, the strength contributions of unconfined (cover) concrete, confined (core) concrete, steel angles, and longitudinal bars obtained from numerical analysis are separately presented in Fig. 9 (thin dashed lines with markers). In the case of the eccentrically loaded specimens (E1–E4 in Fig. 9a–d), the axial load reached its maximum even after cover-spalling (see the marker of u) due to the maintained strength of confined concrete (see the marker of c) and yielding of steel angles (see the marker of s). On the other hand, in the case of the concentrically loaded specimens (C1–C5 in Fig. 9e–i), cover-spalling determined the maximum load, since it occurred around the entire perimeter. In the case of the flexurally loaded specimens (F1–F7 in Fig. 9j–p), the flexural strength was maintained after cover-spalling due to the ductile behavior of confined concrete and steel angles.
The large load-carrying capacity of CES columns after failure of concrete cover (and local buckling of longitudinal bars) was also reported by Naito et al. (2011), and this beneficial effect could be more pronounced in the case of using high-strength and compact steel angles in CES-A columns.
4 Parametric Study and Discussion
To investigate the effect of design parameters, a parametric study was performed for a typical CES-A column shown in Fig. 10 (square cross-section with equal-leg steel angles connected by battens and having 50 mm-thick concrete cover). The design parameters included the compressive strength of concrete (\( f^{\prime}_{c,u} \) = 40, 60, and 80 MPa), yield strength (\( f_{ys} \) = 315, 450, and 650 MPa, corresponding to SM490 (ultimate strength \( f_{us} \) = 490 MPa), SM570 (\( f_{us} \) = 570 MPa), and HSA800 (\( f_{us} \) = 800 MPa) in the Korean Standards, respectively), area (or sectional ratio of steel to gross section \( \rho_{s} = A_{s}/A_{g} \) = 3.2, 3.8, and 4.8%, which correspond to \( b_{s} \times t_{s} \) = 150 \( \times \) 10, 150 \( \times \) 12, and 150 \( \times \) 15 mm), and compactness (or width-to-thickness ratio of the outstanding leg \( b^{\prime}_{s}/t_{s} = \left({b_{s} - t_{s}} \right)/t_{s} \) = 7.0, 11.5, and 16.5 under the same steel ratio of \( \rho_{s} \) = 3.8%, which correspond to \( b_{s} \times t_{s} \) = 120 \( \times \) 15, 150 \( \times \) 12, and 175 \( \times \) 10 mm) of steel angles, yield strength (\( f_{yt} \) = 315, 450, and 650 MPa), thickness (\( b_{t} \times t_{t} \) = 100 \( \times \) 10, 100 \( \times \) 12, and 100 \( \times \) 15 mm), and spacing (\( s_{t}/b_{c} \) = 0.3, 0.5, and 1.0) of battens, eccentricity of axial load (\( e_{0}/b \) = 0.1, 0.3, 0.5, and 1.0), column length (\( L_{k} \) = 4, 5, and 6 m), and size of cross-section (\( b_{x} \times b_{y} \) = 500 \( \times \) 500, 600 \( \times \) 600, and 700 \( \times \) 700 mm). In the parametric study, the peak strain of unconfined concrete was assumed to be \( \varepsilon_{co,u} \) = 0.0023, 0.0026, or 0.0028 for 40, 60, or 80 MPa concrete (European Committee for Standardization 2008). The rounded stress–strain relationship was used for 450 or 650 MPa steel, whereas the trilinear relationship was used for 315 MPa steel. The default (controlled) parameters are presented in the bottom of Fig. 10.

Parametric study results (evaluated at mid-height section).
4.1 Effects of Design Parameters
Figure 10 shows the axial load–strain (\( P - \varepsilon_{c} \)) relationships for the various design parameters. To quantify the effect of each design parameter, the residual strength ratio \( \alpha \), the ratio of the 2nd peak load (or residual strength) to the 1st peak load (or spalling load), was introduced (presented in parentheses).

P-M interaction curves of CES-A sections for various design parameters.
Since the 2nd peak load is developed by the maintained strength of confined concrete and yielding of steel angles, generally \( \alpha \) was increased as the steel contribution and confinement efficiency increased. In more detail, as the concrete strength \( f^{\prime}_{c,u} \) increased, \( \alpha \) was decreased (\( \alpha \) = 1.09 for \( f^{\prime}_{c,u} \) = 40 MPa, 1.02 for 60 MPa, and 0.98 for 80 MPa in Fig. 10a), since the use of higher strength concrete resulted in higher strength-loss by cover-spalling and less ductile behavior. As the yield strength \( f_{ys} \) or sectional ratio \( \rho_{s} \) of steel angles increased, \( \alpha \) was increased (\( \alpha \) = 0.94 for \( f_{ys} \) = 315 MPa, 0.96 for 450 MPa, and 1.02 for 650 MPa, or \( \alpha \) = 0.98 for \( \rho_{s} \) = 3.2%, 1.02 for 3.8%, and 1.08 for 4.8% in Fig. 10b). However, as the width-to-thickness ratio increased, \( \alpha \) was decreased (\( \alpha \) = 1.06 for \( b^{\prime}_{s}/t_{s} \) = 7.0, 1.02 for 11.5, and 1.01 for 16.5 in Fig. 10b), because the slender section was more vulnerable to local instability. As the yield strength \( f_{yt} \) and thickness \( t_{t} \) of battens increased, \( \alpha \) was slightly increased, but their effects were not significant (Fig. 10c). On the other hand, the spacing \( s_{t} \) of battens had a great effect (\( \alpha \) = 1.15 for \( s_{t}/b_{c} \) = 0.3 (clear spacing \( s_{c} = s_{t} - h_{t} \) = 50 mm, and volumetric ratio of battens to the confined concrete core \( \rho_{t} = \varSigma \left({b_{t} t_{t} L_{t}} \right)/\left({b_{c,x} b_{c,y} s_{t}} \right) \) = 6.25%: \( L_{t} \) = length of battens), 1.02 for 0.5 (\( s_{c} \) = 150 mm, \( \rho_{t} \) = 3.75%), and 0.97 for 1.0 (\( s_{c} \) = 400 mm, \( \rho_{t} \) = 1.88%) in Fig. 10c). It is because that the spacing \( s_{t} \) of battens is related not only to confinement but also to local buckling of steel angles. In comparison with the effect of battens (Fig. 10c), the effect of steel angles (Fig. 10b) was also highly influential for the load-carrying capacity of CES-A columns. This parametric study result partly differs from the result of an existing study: in the case of RC columns strengthened by steel jacketing, thick and/or dense battens are much more effective than large steel angles for load-carrying capacity (Khalifa and Al-Tersawy 2014). This partly different result comes from the different purpose of steel angles: unlikely the existing study for steel jacketing, in which the primary purpose of steel angles is to provide lateral confinement, the steel angles in CES-A columns are used to transmit column loads directly as well as to provide confinement. Thus, the steel angles in CES-A columns are subjected to high compression, and their properties associated with local buckling and confinement are also important for load-carrying capacity. The eccentricity \( e_{0} \) of axial load also had a significant effect, but \( \alpha \) was not directly proportional to \( e_{0} \) (\( \alpha \) = 0.96 for \( e_{0}/b \) = 0.1, 1.02 for 0.3, and 1.06 for 0.5, whereas \( \alpha \) = 1.06 for a high eccentricity of \( e_{0}/b \) = 1.0 in Fig. 10d): under the higher eccentricities (or lower compression), strength-loss by cover-spalling was less pronounced, but the contribution of steel angles to axial load was decreased due to the increased bending moment. As the column length \( L_{k} \) increased, \( \alpha \) was decreased (\( \alpha \) = 1.02 for \( L_{k} \) = 4 m, 1.00 for 5 m, and 0.98 for 6 m in Fig. 10e) due to the increased slenderness and 2nd-order effect. On the other hand, the effect of the increased slenderness by using a smaller section was compensated by the increased steel contribution and confinement efficiency in the smaller section (\( \alpha \) = 1.08 for \( b \) = 500 mm, 1.02 for 600 mm, and 0.99 for 700 mm in Fig. 10e).
4.2 Spalling Load and Residual Strength
The passive confining pressure is generated by the laterally expanding concrete under compression due to the Poisson effect and the restraining forces in steel angles and transverse reinforcement (Saatcioglu and Razvi 1992; Razvi and Saatcioglu 1999; Nagaprasad et al. 2009; Badalamenti et al. 2010). Thus, the confinement effect is not fully developed until a column is subjected to sufficient compression and deformation, and the large compression and deformation lead to cover-spalling (American Concrete Institute 2014). As stated in the subsection of Concrete and Confinement, cover-spalling is more pronounced at the corners of CES-A columns. However, in well-confined sections, strength-gain in confined concrete may compensate or even exceed strength-loss in concrete cover (Cusson and Paultre 1994). Furthermore, as stated in the subsection of Verifications, in the case of using high-strength and compact steel angles, strength-gain after cover-spalling is more pronounced. That is, the 2nd peak load can be even greater than the 1st peak load depending on the steel contribution and confinement efficiency.
Figure 11 shows the numerical \( P-M \) interaction curves of the typical CES-A section (Fig. 10), which correspond to the 1st peak load (thick dashed lines) and 2nd peak load (thick solid lines). As expected, the 2nd peak load (or residual strength) was affected by the design parameters, and in some cases, the 2nd peak load was greater than the 1st peak load: (1) as the steel contribution increased (in the cases of using higher strength (Fig. 11c) and/or larger (Fig. 11d) steel angles), the residual strength in the tension-controlled zone (below the balanced failure point) was increased (by comparing with Fig. 11a or the shaded area in each figure); whereas (2) as the confinement efficiency increased (in the cases of using more compact steel angles (Fig. 11e), higher strength, thicker, and/or denser battens (Fig. 11f–h), the residual strength in the compression-controlled zone (above the balanced failure point) was increased. In the case of using higher strength concrete (Fig. 11b), the interaction curve expanded toward the compression-controlled zone, but the residual strength was decreased due to the decreased steel contribution. Especially in the practical range of axial load (generally in actual design, \( P \ge 0.1A_{g} f^{\prime}_{c,u} \) according to the definition of compression members and \( e_{0}/b \ge 0.1 \) to account for accidental eccentricity (American Concrete Institute 2014)), the residual strength was obviously greater than the 1st peak load.
The 2nd peak load or residual strength is a meaningful factor in seismic design and progressive collapse analysis. Thus, a rational approach is required to predict the residual strength after cover-spalling. It is noted that the 1st peak load (or spalling load) can be obtained by the strain compatibility method of ACI 318-14 (Kim et al. 2014; 2017), in which the linear strain distribution and ultimate compressive strain of ε cu = 0.003 for concrete are used neglecting the confinement effect (American Concrete Institute 2014).
4.3 Simple Approach for Residual Strength
To construct the \( P-M \) interaction curve corresponding to the 2nd peak load (or residual strength) of CES-A sections, a simple approach was proposed: for more exact strength-calculation and wider application, a strain-based method was used. To accurately predict the strength of composite sections with high-strength steel and high-level confinement, the strain compatibility and confinement effect should be considered (Kim et al. 2014, 2017). For the confinement effect, the design equations of Eurocode 2 (European Committee for Standardization 2008) were used with some modifications: in Eurocode 2, parabola-rectangle stress–strain relationships are provided for unconfined concrete and confined concrete, and the peak stress \( f^{\prime}_{c,c} \), peak strain \( \varepsilon_{co,c} \), and ultimate strain \( \varepsilon_{cu,c} \) of confined concrete are defined as a function of the effective confining pressure \( \sigma_{le} \) (Eq. (10)).
where the peak and ultimate strains of unconfined concrete are \( \varepsilon_{co,u} \) = 0.002 and \( \varepsilon_{cu,u} \) = 0.0035 for 12 \( \le f^{\prime}_{c,u} < \) 50 MPa, or \( \varepsilon_{co,u} = \left[{2 + 0.085\left({f^{\prime}_{c,u} - 50} \right)^{0.53}} \right]/1000 \) and \( \varepsilon_{cu,u} = \left\{{2.6 + 35\left[{\left({90 - f^{\prime}_{c,u}} \right)/100} \right]^{4}} \right\}/1000 \) for 50 \( \le f^{\prime}_{c,u} \le \) 90 MPa, respectively.
For simplicity, the original parabola-rectangle stress–strain relationships of Eurocode 2 were conservatively simplified with bilinear stress–strain relationships (Fig. 12 and Eq. (11)), and steel angles were assumed to be elasto-plastic (Eq. (12)).
where the subscript \( i \) indicates the \( i \)-th fiber in the cross-section. The strain distribution or the strain \( \varepsilon_{i} \) of \( i \)-th fiber will be discussed below.

Residual strength calculation by proposed simple approach.
The numerical investigation showed that the residual strength is determined by (1) failure (local buckling) of steel angles or (2) failure (crushing) of confined concrete, whichever is earlier. The failure criteria can be defined as a function of the strain of steel angles or confined concrete. For a square section with equal-leg angles connected by battens, the critical buckling strain \( \varepsilon_{bs} \) of steel angles and the crushing strain \( \varepsilon_{cu,c} \) of confined concrete can be calculated as follows.
-
(1)
The critical buckling strain \( \varepsilon_{bs} \) in the elastic range (\( \eta \) = 1 from Eq. (6) because \( E_{s,\sec} = E_{s,tan} = E_{s} \), \( \nu \) = 0.3 from Eq. (7), and \( f_{bs} = E_{s} \varepsilon_{bs} \) in Eq. (5)) and inelastic range (\( \eta = 2/3 \times \left({f_{ys}/\varepsilon_{bs}} \right)/E_{s} \) from Eq. (6) because \( E_{s,\sec} = f_{ys}/\varepsilon_{bs} \) and \( E_{s,tan} \) = 0, \( \nu \) = 0.5 from Eq. (7), and \( f_{bs} = f_{ys} \) in Eq. (5)) can be rewritten as Eq. (13): \( \varepsilon_{bs} = \varepsilon_{bs1} \) if \( \varepsilon_{bs1} \le \varepsilon_{ys} \), or \( \varepsilon_{bs} = \varepsilon_{bs2} \) if \( \varepsilon_{bs1} > \varepsilon_{ys} \).
$$ \varepsilon_{bs1} = \frac{{k_{b} \pi^{2}}}{{12\left({1 - 0.3^{2}} \right)}}\left({\frac{{t_{s}}}{{b_{s}}}} \right)^{2} = 0.904k_{b} \left({\frac{{t_{s}}}{{b_{s}}}} \right)^{2}\,\text{in the elastic range} $$(13a)$$ \varepsilon_{bs2} = \frac{2}{3} \times \frac{{k_{b} \pi^{2}}}{{12\left({1 - 0.5^{2}} \right)}}\left({\frac{{t_{s}}}{{b_{s}}}} \right)^{2} = 0.731k_{b} \left({\frac{{t_{s}}}{{b_{s}}}} \right)^{2}\,\text{in the inelastic range} $$(13b)where the local buckling coefficient can be conservatively taken as \( k_{b} = 0.43 + \left[{b_{s}/\left({s_{t} - h_{t}} \right)} \right]^{2} \) (for battens) from Table 2.
-
(2)
The effective confining pressure \( \sigma_{le} \) on confined concrete can be rewritten as Eq. (14) from the subsection of Concrete and Confinement and Appendix, and then \( \varepsilon_{cu,c} \) can be obtained by using \( \sigma_{le} \) and Eq. (10c).
$$ \sigma_{le} = k_{2} \rho_{t} f_{t} = \frac{{0.3A_{t1}}}{{s_{t} \sqrt {w_{i} \left({s_{t} - h_{t}} \right)}}} \times E_{t} \left({0.0025 + 0.04\sqrt[3]{{\frac{{0.3A_{t1}}}{{f^{\prime}_{c,u} s_{t} \sqrt {w_{i} \left({s_{t} - h_{t}} \right)}}}}}} \right) $$(14)where \( k_{2} \le 1.0 \), \( f_{t} \le f_{yt} \), \( A_{t1} = h_{t} \times t_{t} \) = area of a batten, \( w_{i} = b_{c} - 2b_{s} \) (before local buckling), and \( E_{t} \) = elastic modulus of battens.
When the extreme compression fiber of steel angles or confined concrete (distance from the compression surface \( y_{i} = d_{c} \)) reaches its failure strain (\( \varepsilon_{cf} \) = the smaller of \( \varepsilon_{bs} \) and \( \varepsilon_{cu,c} \)), the 2nd-peak load (residual strength) is developed. Thus, with the assumption of linear strain distribution, the strain distribution or the strain \( \varepsilon_{i} \) of \( i \)-th fiber can be calculated as Eq. (15).
where \( \varepsilon_{t} \) = strain of the extreme tension fiber at \( y_{i} = d_{t} \).
The interaction curve for the residual strength can be obtained by increasing \( \varepsilon_{t} \) and summing up internal forces (axial force \( P \) and bending moment \( M \)) over the cross-section. As shown in Fig. 11, the interaction curve for the residual strength by the simple approach (thin solid lines) agreed well with that by the numerical analysis (thick solid lines) for all cases.
It is noted that, in the case of using the residual strength for design purpose, the partial factors for materials are recommended to be used: \( f^{\prime}_{cu,d} = f^{\prime}_{cu}/1.5 \), \( f^{\prime}_{cc,d} = f^{\prime}_{cc}/1.5 \), and \( f_{ys,d} = f_{ys}/1.1 \) (European Committee for Standardization 2008). Even though CES-A columns showed good performance under cyclic loading (Hwang et al. 2015, 2016; Zheng and Ji 2008a, b), further studies on ductility and post-yield stiffness as well as residual strength are required for seismic design and progressive collapse analysis.
5 Conclusions
To investigate the load-carrying capacity of high-strength CES-A columns, in which corner steel angles are encased in concrete and transmit column loads directly, a numerical study was performed using a proposed analysis model. The findings of the numerical study are summarized as follows.
-
(1)
Considering the strain compatibility, confinement effect of steel angles and transverse reinforcement, and local buckling of steel angles and longitudinal bars, nonlinear numerical analysis was performed. In the analysis, the premature spalling of concrete cover at corners and the effect of local buckling of steel angles on confinement, which are the distinctive local failure mechanisms of CES-A columns, were also taken into account.
-
(2)
For verification, the numerical analysis results were compared with the previous experimental study results. The proposed model gave fairly good predictions for the peak load, secant stiffness at the peak load, and post-beak behavior. To investigate the effect of design parameters (strength of concrete; strength, area, and compactness of steel angles; strength, thickness, and spacing of battens; eccentricity of axial load; and slenderness by varying column length and sectional size), a parametric study was also conducted.
-
(3)
The numerical investigation showed that when the steel contribution is high (by using higher strength, and/or larger steel angles; or by using lower strength concrete) and the confinement efficiency is high (by using more compact steel angles; or by using higher strength, thicker, and/or denser battens), CES-A columns exhibit relatively large load-carrying capacity even after spalling of concrete cover at corners due to the maintained strength of confined concrete and yielding of steel angles. The eccentricity and slenderness were also highly influential for load-carrying capacity.
-
(4)
To predict the residual strength (2nd peak load) after cover-spalling (1st peak load), a simple approach was proposed on the basis of the strain compatibility method considering the confinement effect. The residual strength was determined by local buckling of steel angles or crushing of confined concrete, whichever is earlier, and the proposed simple approach gave a good prediction.
References
American Concrete Institute (ACI). (2014). Building code requirements for structural concrete and commentary. Farmington Hills, MI: ACI 318-14.
Badalamenti, V., Campione, G., & Mangiavillano, M. L. (2010). Simplified model for compressive behavior of concrete columns strengthened by steel angles and strips. Journal of Engineering Mechanics, 136(2), 230–238.
Bambach, M. R., & Rasmussen, K. J. R. (2004a). Design provisions for sections containing unstiffened elements with stress gradient. Journal of Structural Engineering, 130(10), 1620–1628.
Bambach, M. R., & Rasmussen, K. J. R. (2004b). Effective widths of unstiffened elements with stress gradient. Journal of Structural Engineering, 130(10), 1611–1619.
Calderon, P. A., Adam, J. M., Ivorra, S., Pallares, F. J., & Gimenez, E. (2009). Design strength of axially loaded RC columns strengthened by steel caging. Materials and Design, 30, 4069–4080.
Campione, G. (2012a). Load carrying capacity of RC compressed columns strengthened with steel angles and strips. Engineering Structures, 40, 457–465.
Campione, G. (2012b). Strength and ductility of RC columns strengthened with steel angles and battens. Construction and Building Materials, 35, 800–807.
Cavaleri, L., Trapani, F.D., & Ferrotto, M.F. (2016). Steel jacketing of RC columns: Reliability of capacity laws for concrete. SBE16 (Europe and the Mediterranean towards a sustainable built environment), 16–18 March, 2016, Malta.
Chen, C. C., & Lin, N. J. (2006). Analytical model for predicting axial capacity and behavior of concrete encased steel composite stub columns. Journal of Constructional Steel Research, 62, 424–433.
Collins, M. P., Mitchell, D., & MacGregor, J. G. (1993). Structural design considerations for high-strength concrete. Concrete International: Design and Construction, 15(5), 27–34.
Critek, L. (2001). RC columns strengthened with bandage—Experimental programme and design recommendations. Construction and Building Materials, 15(8), 341–349.
Cusson, D., & Paultre, P. (1994). High-strength concrete columns confined by rectangular ties. Journal of Structural Engineering, 120(3), 783–804.
El-Tawil, S., and Deierlein, G.G. (1996) Fiber analysis of composite beam-column cross sections. Report No.96-6, Structural Engineering Representative, School of Civil and Environmental Engineering, Cornell University, Ithaca, N.Y.
Eom, T. S., Hwang, H. J., Park, H. G., Lee, C. N., & Kim, H. S. (2014). Flexural test for steel-concrete composite members using prefabricated steel angles. Journal of Structural Engineering, 140(4), 04013094.
European Committee for Standardization (CEN). (2005). Design of composite steel and concrete structures-part 1-1: General rules and rules for buildings. Brussels: Eurocode 4.
European Committee for Standardization (CEN). (2008). Design of concrete structures-part 1-1: General rules and rules for buildings. Brussels: Eurocode 2.
Garzon-Roca, J., Adam, J. M., & Calderon, P. A. (2011a). Behaviour of RC columns strengthened by steel caging under combined bending and axial loads. Construction and Building Materials, 25(5), 2402–2412.
Garzon-Roca, J., Adam, J. M., Calderon, P. A., & Valente, I. B. (2012). Finite element modelling of steel-caged RC columns subjected to axial force and bending moment. Engineering Structures, 40, 168–186.
Garzon-Roca, J., Ruiz-Pinilla, J., Adam, J. M., & Calderon, P. A. (2011b). An experimental study on steel-caged RC columns subjected to axial force and bending moment. Engineering Structures, 33(2), 580–590.
Gerard, G. (1946). Secant modulus method for determining plate instability above the proportionality limit. Journal of the Aeronautical Sciences, 13(1), 38–44.
Gerard, G., & Becker, H. (1957). Handbook of structural stability. Part I: Buckling of flat plates. Washington, D.C.: National Advisory Council for Aeronautics.
Gomes, A., & Appleton, J. (1997). Nonlinear cyclic stress-strain relationship of reinforcing bars including buckling. Engineering Structures, 19(10), 822–826.
Hashemi, B. H., & Jafari, M. (2004). Performance of batten columns in steel buildings during the Bam earthquake of 26 December 2003. Journal of Seismology and Earthquake Engineering, 5(4), 101–109.
Hwang, H. J., Eom, T. S., Park, H. G., & Lee, S. H. (2016). Axial load and cyclic load tests for composite columns with steel angles. Journal of Structural Engineering, 142(5), 04016001.
Hwang, H. J., Eom, T. S., Park, H. G., Lee, S. H., & Kim, H. S. (2015). Cyclic loading test for beam-column connections of concrete-filled U-shaped steel beams and concrete-encased steel angle columns. Journal of Structural Engineering, 141(11), 04015020.
Khalifa, E. S., & Al-Tersawy, S. H. (2014). Experimental and analytical behavior of strengthened reinforced concrete columns with steel angles and strips. International Journal of Advanced Structural Engineering, 6(61), 1–14.
Kim, C. S., Park, H. G., Chung, K. S., & Choi, I. R. (2014). Eccentric axial load capacity of high-strength steel—concrete composite columns of various sectional shapes. Journal of Structural Engineering, 140(4), 04013091.
Kim, C. S., Park, H. G., Chung, K. S., & Choi, I. R. (2012). Eccentric axial load testing for concrete-encased steel columns using 800 MPa steel and 100 MPa concrete. Journal of Structural Engineering, 138(8), 1019–1031.
Kim, C. S., Park, H. G., Lee, H. J., Choi, I. R., & Chung, K. S. (2017). Eccentric axial load test for high-strength composite columns of various sectional configurations. Journal of Structural Engineering, 143(8), 04017075.
Kim, M. H., Kim, H. G., Ju, Y. K., & Kim, S. D. (2011). Experimental study on the axial behavior of yLRC composite columns. Procedia Engineering, 14, 2058–2063.
Li, Z., & Schafer, B.W. (2010). Buckling analysis of cold-formed steel members with general boundary conditions using CUFSM: conventional and constrained finite strip methods. Proceedings of the 20th International Specialty Conference on Cold-Formed Steel Structures, November 3–4, 2010, Missouri.
Liang, Q. Q., Uy, B., & Liew, J. Y. R. (2006). Nonlinear analysis of concrete-filled thin-walled steel box columns with local buckling effects. Journal of Constructional Steel Research, 62, 581–591.
Mazzolani, F. M., Piluso, V., & Rizzano, G. (2011). Local buckling of aluminum alloy angles under uniform compression. Journal of Structural Engineering, 137(2), 173–184.
Montuori, R., & Piluso, V. (2009). Reinforced concrete columns strengthened with angles and battens subjected to eccentric load. Engineering Structures, 31(2), 539–550.
Morino, S., Matsui, C., & Yoshikai, S. (1986). Local buckling of steel elements in concrete encased columns. Proceedings of the Pacific Structural Steel Conference, New Zealand, 2, 319–335.
Nagaprasad, P., Sahoo, D. R., & Rai, D. C. (2009). Seismic strengthening of RC columns using external steel cage. Earthquake Engineering & Structural Dynamics, 38, 1563–1586.
Naito, H., Akiyama, M., & Suzuki, M. (2011). Ductility evaluation of concrete-encased steel bridge piers subjected to lateral cyclic loading. Journal of Bridge Engineering, 16(1), 72–81.
Ramberg, W., & Osgood, W. (1943). Description of stress–strain curves by three parameters, NACA Techical Note No. 902
Rasmussen, K. J. R. (2003). Full-range stress-strain curves for stainless steel alloys. Journal of Constructional Steel Research, 59(1), 47–61.
Razvi, S. R., & Saatcioglu, M. (1999). Confinement model for high-strength concrete. Journal of Structural Engineering, 125(3), 281–289.
Saatcioglu, M., & Razvi, S. R. (1992). Strength and ductility of confined concrete. Journal of Structural Engineering, 118(6), 1590–1607.
Shanmugam, N. E., Liew, J. Y. R., & Lee, S. L. (1989). Thin-walled steel box columns under biaxial loading. Journal of Structural Engineering, 115(11), 2706–2726.
Stowell, E.Z. (1948). A unified theory of plastic buckling of columns and plates. National Advisory Committee for Aeronautics; Report No. 898: 127–137.
Tarabia, A. M., & Albakry, H. F. (2014). Strengthening of RC columns by steel angles and strips. Alexandria Engineering Journal, 53, 615–626.
Timoshenko, S. P., & Gere, J. M. (1985). Theory of elastic stability. New York: McGraw-Hill.
Usami, T. (1993). Effective width of locally buckled plates in compression and bending. Journal of Structural Engineering, 119(5), 1358–1373.
von Karman, T., Sechler, E. E., & Donnell, L. H. (1932). The strength of thin plates in compression. Transactions of ASME, 54, 53–57.
Westergaard, H. M., & Osgood, W. R. (1928). Strength of steel columns. Trans. ASME, 50, 65–80.
Winter, G. (1947). Strength of thin steel compression flanges. Transactions of the American Society of Civil Engineers, 112(1), 527–554.
Zheng, W. Z., & Ji, J. (2008a). Dynamic performance of angle-steel concrete columns under low cyclic loading I: Experimental study. Earthquake Engineering and Engineering Vibration, 7, 67–75.
Zheng, W. Z., & Ji, J. (2008b). Dynamic performance of angle-steel concrete columns under low cyclic loading II: Parametric study. Earthquake Engineering and Engineering Vibration, 7, 137–146.
Zubydan, A. H., & ElSabbagh, A. I. (2001). Monotonic and cyclic behavior of concrete-filled steel-tube beam-columns considering local buckling effect. Thin-Walled Structures, 49(4), 465–481.
Acknowledgements
This research was supported by grants from the National Natural Science Foundation of China (Research Fund for International Young Scientists, Grant No. 51650110498), and the authors are grateful to the authority for the support.
Author information
Authors and Affiliations
Corresponding author
Appendix (Calculation of material properties for concrete modeling, Saatcioglu and Razvi 1992; Razvi and Saatcioglu 1999)
Appendix (Calculation of material properties for concrete modeling, Saatcioglu and Razvi 1992; Razvi and Saatcioglu 1999)
For unconfined concrete, \( \varepsilon_{co,u} = 0.0028 - 0.0008k_{3} \); and \( \varepsilon_{c85,u} = \varepsilon_{co,u} + 0.0018\left({k_{3}} \right)^{2} \).
For confined concrete, \( f^{\prime}_{c,c} = f^{\prime}_{c,u} + k_{1} \sigma_{le} \); \( \varepsilon_{co,c} = \varepsilon_{co,u} \left[{1 + 5k_{3} \times \left({k_{1} \sigma_{le}/f^{\prime}_{c,u}} \right)} \right] \); \( \varepsilon_{c85,c} = \varepsilon_{c85,u} + 260k_{3} \rho_{t} \varepsilon_{co,c} \left[{1 + 0.5k_{2} \left({k_{4} - 1} \right)} \right] \); \( \sigma_{le} = \left({k_{2,x} \,\sigma_{l,x} \,b_{c,x} + k_{2,y} \,\sigma_{l,y} \,b_{c,y}} \right)/\left({b_{c,x} + b_{c,y}} \right) \) for rectangular sections with different confinement efficiencies in the x- and y-directions (\( \sigma_{le} = k_{2} \,\sigma_{l} \, \) for square sections); \( \sigma_{l} = \varSigma \left({A_{t} f_{t}} \right)/\left({s_{t} b_{c}} \right) \) = average confining pressure in the x- or y-direction; \( b_{c} \) = sectional dimension of confined concrete in the x- or y-direction; \( f_{t} = E_{t} \left({0.0025 + 0.04\sqrt[3]{{k_{2} \rho_{t}/f^{\prime}_{c,u}}}} \right) \) = stress in transverse reinforcement at the peak stress of confined concrete (\( f_{t} \le f_{yt} \)); \( A_{t} \), \( s_{t} \), \( \rho_{t} = \left({\sum A_{t,x} +\sum A_{t,y}} \right)/\left[{s_{t} \left({b_{c,x} +b_{c,y}} \right)} \right] \), \( E_{t} \), and \( f_{yt} \) = area, vertical spacing, sectional ratio, elastic modulus, and yield strength of transverse reinforcement; \( k_{1} = 6.7\left({\sigma_{le}} \right)^{- 0.17} \); \( k_{2} = 0.15\sqrt {\left({b_{c}/s_{t}} \right)\left({b_{c}/w_{i}} \right)} \) (\( k_{2} \le 1.0 \)) in the x- or y-direction; \( w_{i} \) = spacing of laterally supported longitudinal bars by hoops and cross-ties (ineffective width between steel angles in the present study); \( k_{3} = 40/f^{\prime}_{c,u} \) (\( k_{3} \le 1.0 \)); \( k_{4} = f_{yt}/500 \) (\( k_{4} \ge 1.0 \)); and \( f_{c,c} \ge 0.2f^{\prime}_{c,c} \) if \( \varepsilon_{c} > \varepsilon_{co,c} \).
Rights and permissions
Open Access This article is distributed under the terms of the Creative Commons Attribution 4.0 International License (http://creativecommons.org/licenses/by/4.0/), which permits unrestricted use, distribution, and reproduction in any medium, provided you give appropriate credit to the original author(s) and the source, provide a link to the Creative Commons license, and indicate if changes were made.
About this article

Cite this article
Kim, CS., Hwang, HJ. Numerical Investigation on Load-carrying Capacity of High-strength Concrete-encased Steel Angle Columns. Int J Concr Struct Mater 12, 11 (2018). https://doi.org/10.1186/s40069-018-0238-7
Received:
Accepted:
Published:
DOI: https://doi.org/10.1186/s40069-018-0238-7