
Abstract
Background
Pathway enrichment techniques are useful for understanding experimental metabolomics data. Their purpose is to give context to the affected metabolites in terms of the prior knowledge contained in metabolic pathways. However, the interpretation of a prioritized pathway list is still challenging, as pathways show overlap and cross talk effects.
Results
We introduce FELLA, an R package to perform a network-based enrichment of a list of affected metabolites. FELLA builds a hierarchical representation of an organism biochemistry from the Kyoto Encyclopedia of Genes and Genomes (KEGG), containing pathways, modules, enzymes, reactions and metabolites. In addition to providing a list of pathways, FELLA reports intermediate entities (modules, enzymes, reactions) that link the input metabolites to them. This sheds light on pathway cross talk and potential enzymes or metabolites as targets for the condition under study. FELLA has been applied to six public datasets –three from Homo sapiens, two from Danio rerio and one from Mus musculus– and has reproduced findings from the original studies and from independent literature.
Conclusions
The R package FELLA offers an innovative enrichment concept starting from a list of metabolites, based on a knowledge graph representation of the KEGG database that focuses on interpretability. Besides reporting a list of pathways, FELLA suggests intermediate entities that are of interest per se. Its usefulness has been shown at several molecular levels on six public datasets, including human and animal models. The user can run the enrichment analysis through a simple interactive graphical interface or programmatically. FELLA is publicly available in Bioconductor under the GPL-3 license.
Background
Metabolomics is the science that measures lightweight molecules in living organisms and stands as a valuable source of biomarkers and biological knowledge [1]. The preprocessing of such data can be achieved through pipelines like MeltDB [2] or MAIT [3]. Once metabolite abundances are available, pathway analysis tools ease data interpretation [4] by framing the affected metabolites in terms of contextual knowledge. Databases like the Kyoto Encyclopedia of Genes and Genomes (KEGG) [5] are sources of curated pathway data. The classification of enrichment techniques used here follows the review in [4].
Over representation analysis (ORA) approaches are based on testing the proportion of a list of affected metabolites inside a pathway. ORA is available in tools like the web server MetaboAnalyst [6] and the R package clusterProfiler [7]. Functional class scoring (FCS) approaches use quantitative data instead and seek subtle but coordinated changes in the metabolites belonging to a pathway. MSEA in MetaboAnalyst and IMPaLA [8] contain implementations of FCS for metabolomics. Pathway topology-based (PT) approaches further include topological measures of the metabolites in the statistic, accounting for their inequivalence within the pathway. PT analyses can be performed using MetaboAnalyst.
Here, we introduce the R package FELLA, available in Bioconductor [9], for metabolomics data interpretation that combines pathway enrichment with network analysis. The list of affected metabolites and the reported pathways are connected through intermediate entities -reactions, enzymes, modules- in a heterogeneous network layout. This suggests how the perturbation spreads at the pathway level and how pathways cross talk, enhancing the interpretability of the output.
Implementation
FELLA is an R package that performs metabolomics data enrichment starting from (I) a network derived from KEGG and (II) a list of KEGG compounds (Fig. 1). A sub-network relevant to the input is extracted from (I) using network propagation algorithms that start from the labels in (II), providing a data enrichment that goes beyond a pathway list. The purpose of FELLA is to elaborate a biological explanation that justifies how the input metabolites can reach the reported pathways, as well as perspective on pathway cross talk. Two user guides illustrate the principles and the usage of FELLA: a quickstart (Additional file 1) and an in-depth vignette with implementations details and three real examples (Additional file 2). Two additional vignettes (Additional files 3 and 4) serve as case studies for non-human organisms.
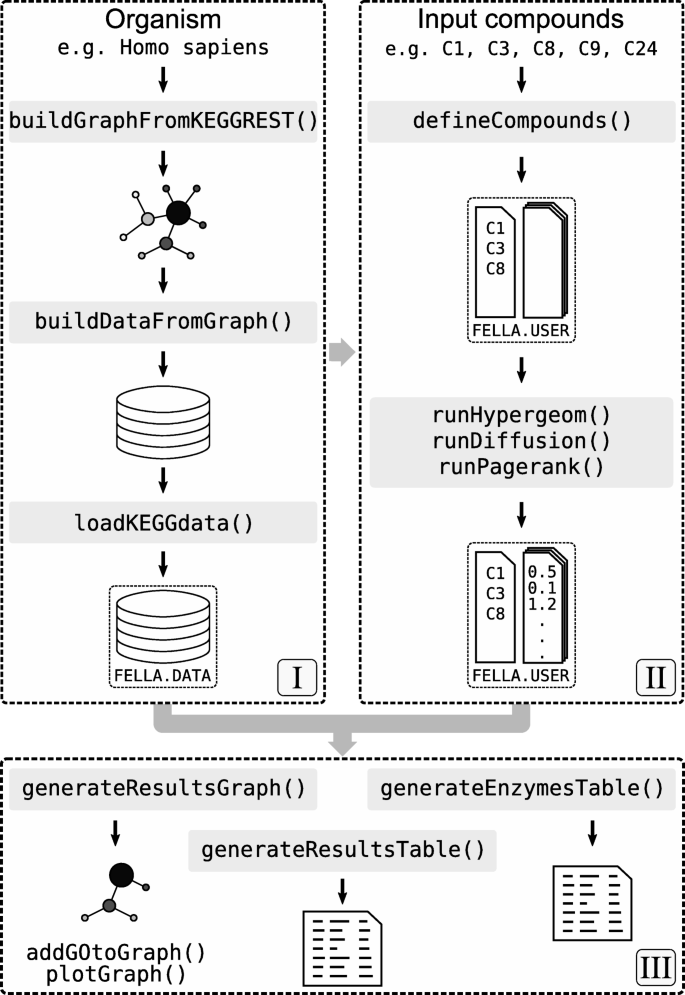
Design of the R package FELLA. (I) creation of a graph object from an organism code and its database, (II) ID mapping and propagation algorithms (diffusion, PageRank) to score all the nodes, (III) node prioritisation and results exporting
Methodology
The cornerstone of FELLA is its knowledge graph representation of the biochemistry in KEGG at several molecular levels. The network is hierarchical and connects KEGG compounds (metabolites) to KEGG pathways through intermediate entities, namely reactions, enzymes and KEGG modules, see Fig. 2. Such connections (edges) are obtained directly from KEGG annotations. The presence of intermediate levels allows inference at their level, meaning that relevant reactions, enzymes and KEGG modules can be suggested just by starting from a list of affected metabolites. This feature is evaluated in several case studies, by linking the suggested enzymatic families and reactions to literature and to original findings within the studies.

Node arrangement for the knowledge model used by FELLA. Entities are organised in a hierarchical manner, from bottom to top: KEGG compounds or metabolites, reactions, enzymes, KEGG modules and pathways. Binary labels at the level of metabolites are propagated to the rest of the network and a relevant, small sub-network is automatically reported. Nodes are ranked using the network propagation algorithms a heat diffusion and b PageRank. The affected metabolites are highlighted with a black ring. For heat diffusion (a), affected metabolites are forced to generate unitary flow. Every pathway is highlighted with a blue ring, representing its connection to a cool boundary node. In equilibrium, the highest temperature pathways (and nodes) will have the greatest heat flow, suggesting a relevant role in the experiment. For PageRank (b), affected metabolites are the start of random walks. PageRank scores, represented by the intensity of the blue colour, will attain higher values in the frequently reached random walk nodes. Figure extracted from [12]
In order to report a sub-network, nodes are ranked according to a scoring function –based on network propagation– and only the top scoring nodes are returned. Two algorithms are supported for propagating the labels from the affected metabolites: a classical heat diffusion approach [10] and the PageRank web ranking algorithm [11]. Further details on the network propagation settings can be found in [12] and in Additional file 2. The main difference between both algorithms is that heat diffusion is undirected whereas PageRank is directed upwards. In practice, contrary to PageRank, heat diffusion will frequently report new metabolites because heat is allowed to propagate back to compounds from the upper levels [12]. This behaviour can ease the discovery of intermediate metabolites that lay close to the input metabolites and tend to connect them. An example of its usefulness can be found in the gilt-head bream study.
As exposed in [12], ranking nodes according to their raw diffusion scores suffers from a strong bias, related to the node level and topological features. This is addressed by normalising the diffusion score of every node using its background distribution under input permutations. Permutations can be simulated through Monte Carlo trials to obtain an empirical p-value, labelled as p-score. Alternatively, a parametric z-score can be obtained without requiring Monte Carlo trials. The p-score is obtained by transforming the z-score to lie in the [0,1] interval through the cumulative distribution function of a standard normal distribution. Under both statistical approximations, nodes with the lowest p-scores are reported as the suggested sub-network. Note that p-scores are used as a ranker rather than for testing hypotheses.
An optional filter allows the removal of small connected components from the reported sub-network. When building the database, a number of random sub-networks are sampled to characterise how infrequent a connected component of order at least r is when k nodes are uniformly sampled. The assumption behind this filter is that meaningful inputs encompass metabolites relatively close to each other within the knowledge graph, prone to be reported in large connected components involving most of them.
Classes
FELLA relies on two classes: FELLA.DATA for the internal knowledge representation, based on the igraph R package [13], and FELLA.USER for the user analysis, see Fig. 1. These classes contain subclasses, invisible to the user and described in the Additional file 2. The functions to manipulate both classes are described below, following the three blocks from Fig. 1.
Block I: local database
The function buildGraphFromKEGGREST() retrieves the tabular KEGG data for the desired organism and builds the knowledge graph as described in [12]. Then, a database can be built from the graph and stored in a local folder using buildDataFromGraph(). Databases are needed for the enrichment and should be loaded through the function loadKEGGdata().
Block II: enrichment analysis
Once the database is loaded, i.e. the FELLA.DATA object is in memory, defineCompounds() maps the list of input metabolites, in the form of KEGG identifiers, to the internal representation, providing a FELLA.USER object. Then, the propagation algorithms in [12] are run to score the graph nodes. runDiffusion() uses the undirected heat diffusion model [10] whereas runPagerank() runs the directed PageRank algorithm [11]. Both approaches are automatically followed by the statistical normalisation, either as a parametric z-score (approx = "normality") or as a simulated permutation analysis (approx = "simulation"), see Table 1. The wrapper enrich() performs the metabolite mapping and the desired propagation algorithm (argument method) and statistical normalisation with a single call.
Block III: exporting results
Finally, the best scoring KEGG entries can be visualised through plot(), exported as a sub-network with generateResultsGraph(), or in tabular format with generateResultsTable(). A dedicated table with the reported enzymes and its associated genes can be obtained with generateEnzymesTable(). Alternatively, exportResults() allows writing such objects directly to files.
User interface
FELLA includes an interactive graphical interface, based on the R package shiny [14] and deployable through launchApp(). The interface is divided with four tabs that encompass most options from FELLA (Fig. 3). Currently, the database needs to be built outside the graphical interface and prior to its usage.

Perspective of the interactive app within FELLA. The app is composed by four tabs: a compounds upload, b advanced options, c results and d export. The lay user can rapidly explore his or her data without knowing the details about the syntax in FELLA
Compounds upload
This tab contains a general description of the interface and a handle to submit the input metabolite list as a text file. Examples are provided as well. The right panel shows the mapped and the mismatching compounds with regard to the current database.
Advanced options
Widgets from this tab adjust the main function arguments for customising the enrichment procedure. They ease database choice from the internal package directory, method and approximation definition and parameter tweaking. It also allows the semantic similarity analysis on the reported enzymes, using the R package GOSemSim [15] with the Gene Ontology annotations [16].
Results and discussion
The results section mainly consists of an interactive network plot with the top k KEGG entries. Nodes can be moved, selected, queried and hovered to reveal the original KEGG entry. An interactive table lies below the plot and expands the data on the nodes.
Export
The last tab offers several options to download the reported sub-network (tabular format or R object) and enzymes (tabular format).
Results
The algorithmic part of FELLA has already been discussed and validated in [12]. The usage of FELLA is hereby demonstrated on three public human studies on epithelial cells [17], ovarian cancer cells [18] and febrile illnesses [19]. The examples guide the user on how to build the database, format the input data, complete the enrichment and export its results (see Additional file 2). FELLA reproduces findings from the original publications, not only in the form of pathway hits but also as newly suggested enzymes and metabolites. The Additional file 5 shows further details on the metabolites in each input and the reported sub-networks.
To demonstrate its usefulness outside human studies, FELLA is applied to two datasets from a gilt-head bream study [20] and a mouse model of non-alcoholic fatty liver disease [21]. The complete analyses can be respectively found in Additional files 3 and 4, whereas their respective R workspaces are saved in Additional files 6 and 7. Table 2 summarises the knowledge graphs in the FELLA.DATA object for each organism.
Epithelial cells dataset
The epithelial cancer cells study [17] runs an in vitro model of dry eye in which the human epithelial cells IOBA-NHC are put under hyperosmotic stress. The list of 9 metabolites hereby used reflects metabolic changes in “Treatment 1” (24 h in serum-free media at 380 mOsm) against control (24 h at 280 mOsm). The metabolites have been extracted from “Table 1” in the original manuscript and mapped to 9 KEGG ids, from which 8 map to the FELLA.DATA object. The enrichment (sub-network in Fig. 4) is obtained by leaving the default parameters in FELLA: method = "diffusion", approx = "normality" and threshold = 0.05. The amount of nodes has been limited to nlimit = 150.

Results of the node prioritisation by FELLA in the epithelial cells dataset. The user is given a list of positive entities, after a score threshold described in [12], with information on how the input metabolites reach the suggested pathways and on how these pathways cross talk. Plots of the ovarian and malaria datasets can be found in the Additional file 5
The activation of the “glycerophosphocholine synthesis” rather than the “carnitine” response is a main result in the original work [17]. FELLA highlights the related pathway “choline metabolism in cancer” and the “choline” metabolite as well. Another key process is the “O-linked glycosilation”, which is close to the KEGG module “O-glycan biosynthesis, mucin type core” and to the KEGG pathway “Mucin type O-glycan biosynthesis”. Finally, FELLA reproduces the finding of “UAP1” by reporting the enzyme “2.7.7.23”, named “UDP-N-acetylglucosamine diphosphorylase”. “UAP1” is a key protein in the study, pinpointed by iTRAQ (Isobaric Tags for Relative and Absolute Quantitation) and validated via western blot.
Ovarian cancer cells dataset
The second dataset has been extracted from the study on metabolic responses of ovarian cancer cells [18]. OCSCs are isogenic ovarian cancer stem cells derived from the OVCAR-3 ovarian cancer cells. The abundances of 6 metabolites are affected by the exposure to several environmental conditions: glucose deprivation, hypoxia and ischemia. From those, 5 metabolites map to the FELLA.DATA object. The sub-network is obtained by leaving the default parameters and setting a limit of nlimit = 150 nodes.
Several “TCA cycle”-related entities are highlighted, also found by the authors and by previous work [22]. It also mentions “sphingosine degradation”, closely related to the reported “sphingosine metabolism” in the original work. Enzymes that have been formerly related to cancer are suggested within the TCA cycle, like “fumarate hydratase” [22–24], “succinate dehydrogenase” [22, 25] and “aconitase” [26]. Another suggestion is “lysosome”(s), known to suffer changes in cancer cells and directly affect apoptosis [27]. Finally, the graph contains several “hexokinases”, potential targets to disrupt glycolysis, a fundamental need in cancer cells [28].
Malaria dataset
The metabolites in this example are related to the distinction between malaria and other febrile illnesses [19]. Specifically, the list of 11 KEGG identifiers (9 in the FELLA.DATA object) has been extracted from the original supplementary data spreadsheet, using all the possible KEGG matches for the “non malaria” patient group. The sub-network is obtained by leaving the default parameters and setting a limit of nlimit = 50 nodes.
In this case, the depicted subnetwork contains the modules “C21-Steroid hormone biosynthesis, progesterone =>corticosterone/aldosterone” and “C21-Steroid hormone biosynthesis, progesterone =>cortisol/cortisone”, related to the “corticosteroids” as a main pathway reported in the original text. This is part of the also reported “Aldosterone synthesis and secretion”; aldosterone is known to show changes related to fever as a metabolic response to infection [29]. Another plausible hit in the sub-network is “linoleic acid metabolism”, as erythrocytes infected by various malaria parasytes can be enriched in linoleic acid [30]. In addition, the pathway “sphingolipid metabolism” can play a role in the immune response [31, 32]. As for the enzymes, “3alpha-hydroxysteroid 3-dehydrogenase (Si-specific)” and “Delta4-3-oxosteroid 5beta-reductase” are related to three input metabolites each and might be candidates for further examination.
Oxybenzone exposition on gilt-head bream datasets
A study of the consequences of the oxybenzone contaminant on gilt-head bream [20] found five dysregulated KEGG metabolites in their liver and eleven in their plasma. The study justified its findings through literature and complemented them with insights provided by FELLA. Here, both metabolite lists are used to build suggested sub-networks with the default parameters and fixing nlimit = 250. The FELLA.DATA object is built for the Danio Rerio organism, a common approximation when annotations specific to gilt-head bream are not available. Further details can be found in the vignette (Additional file 3) and its workspace (Additional file 6).
The enrichment on the liver-derived metabolites links all of them within a connected component of roughly 100 nodes. It points to “Phenylalanine metabolism” as one of the key metabolic pathways, in accordance with the main results from the article. Among the suggested metabolites, “Tyrosine” is of particular help to explain the connection between the affected metabolites (see Fig. 2 from [20]).
Plasma metabolites involve a more complex scenario. FELLA reports ten out of the eleven metabolites in a connected component involving around 120 nodes. Seven pathways are suggested, from which “Linoleic acid metabolism”, “Biosynthesis of unsaturated fatty acids”, “alpha-Linolenic acid metabolism”, “Glycerophospholipid metabolism” and “Glycine, serine and threonine metabolism” were used to build a comprehensive picture of the metabolic changes in the original manuscript (Fig. 3 from [20]). Such figure brings a structured overview that narrows down the core processes, also backed up by prior publications. Likewise, by drawing intermediate metabolites found through FELLA, like “Linoleic acid” and “Phosphatidylcholine”, it achieves a cohesive representation of the input metabolites.
Non-alcoholic fatty liver disease mouse model
This dataset exemplifies how FELLA can also be applied on an animal disease model. Metabolites in liver tissue from leptin-deficient ob/ob mice and wild-type were compared using Nuclear Magnetic Resonance, whereas several candidate genes were further investigated for differences in expression [21]. Six affected metabolites are introduced in FELLA, leaving the default parameters and nlimit = 250. The FELLA.DATA object is built for the Mus musculus organism. The vignette with the whole analysis is provided provided as Additional file 4, whereas its R workspace can be found in Additional file 7.
The sub-network found by FELLA involves “N,N-Dimethylglycine”, a marginally significant metabolite in the experimental data but with a relevant role within the findings from the study. Regarding the genes, FELLA is able to find the enzyme associated to Bhmt, validated and discussed in the study. The enzyme associated to Cbs, another central hit, is not directly found. However, its ranking (top 17% among enzymes) and especially that of its reaction (top 3% among reactions) are highly suggestive. We also show how other (1) related metabolites, found by leveraging the expression data, and (2) differentially expressed genes, taken from an external study [33], tend to have top p-scores in the prioritisation provided by FELLA.
Conclusions
We present FELLA, an R package for enriching metabolomics data, focused on interpretability. It can be used either programmatically or through a simple user interface. FELLA offers a comprehensive enrichment by depicting the intermediate reactions, enzymes and modules that link the input metabolites to the relevant pathways. This layout gives a biological picture with information of the pathway overlap and the connections between the entities of interest, while suggesting enzymes and possibly other metabolites for further study. The utility of FELLA has been demonstrated on six public datasets, both with human and non-human organisms, where reported entities include several original findings in addition to results from third studies. FELLA is publicly available in the Bioconductor public repository under the GPL-3 license.
Availability and requirements
Project name: FELLA
Project home page: https://doi.org/doi:10.18129/B9.bioc.FELLA, https://github.com/b2slab/FELLA
Operating system(s): platform independent
Programming language: R
Other requirements: none
License: GPL-3
Restrictions to use by non-academics: those derived by the GPL-3 license
Abbreviations
- FCS:
-
Functional class scoring
- GPL-3:
-
General public license version 3
- iTRAQ:
-
Isobaric tags for relative and absolute quantitation
- KEGG:
-
Kyoto encyclopedia of genes and genomes
- N/A:
-
Non-applicable
- ORA:
-
Over representation analysis
- PT:
-
Pathway topology-based
- TCA:
-
TriCarboxylic acid
- UDP:
-
Uridine diphosphate
References
Madsen R, Lundstedt T, Trygg J. Chemometrics in metabolomics – a review in human disease diagnosis. Anal Chim Acta. 2010; 659(1):23–33.
Kessler N, Neuweger H, Bonte A, Langenkämper G, Niehaus K, Nattkemper TW, Goesmann A. MeltDB 2.0–advances of the metabolomics software system. Bioinformatics. 2013; 29(19):2452–9.
Fernández-Albert F, Llorach R, Andrés-Lacueva C, Perera A. An R package to analyse LC/MS metabolomic data: MAIT (Metabolite Automatic Identification Toolkit). Bioinformatics. 2014; 30(13):1937–9.
Khatri P, Sirota M, Butte AJ. Ten years of pathway analysis: current approaches and outstanding challenges. PLoS Comput Biol. 2012; 8(2):e1002375.
Kanehisa M, Goto S, Sato Y, Furumichi M, Tanabe M. KEGG for integration and interpretation of large-scale molecular data sets. Nucleic Acids Res. 2011; 40(D1):109–14.
Xia J, Sinelnikov IV, Han B, Wishart DS. MetaboAnalyst 3.0 – making metabolomics more meaningful. Nucleic Acids Res. 2015; 43(Web Server issue):251–7.
Yu G, Wang L-G, Han Y, He Q-Y. clusterProfiler: an R package for comparing biological themes among gene clusters. OMICS. 2012; 16(5):284–7.
Kamburov A, Cavill R, Ebbels TM, Herwig R, Keun HC. Integrated pathway-level analysis of transcriptomics and metabolomics data with IMPaLA. Bioinformatics. 2011; 27(20):2917–8.
Huber W, Carey VJ, Gentleman R, Anders S, Carlson M, Carvalho BS, Bravo HC, Davis S, Gatto L, Girke T, Gottardo R, Hahne F, Hansen KD, Irizarry RA, Lawrence M, Love MI, MacDonald J, Obenchain V, Ole’s AK, Pagès H, Reyes A, Shannon P, Smyth GK, Tenenbaum D, Waldron L, Morgan M. Orchestrating high-throughput genomic analysis with Bioconductor. Nat Methods. 2015; 12(2):115–21.
Vandin F, Upfal E, Raphael BJ. Algorithms for detecting significantly mutated pathways in cancer. J Comput Biol. 2011; 18(3):507–22.
Page L, Brin S, Motwani R, Winograd T. The pagerank citation ranking: Bringing order to the web. Technical report, Stanford InfoLab. 1999.
Picart-Armada S, Fernández-Albert F, Vinaixa M, Rodriguez MA, Aivio S, Stracker TH, Yanes O, Perera-Lluna A. Null diffusion-based enrichment for metabolomics data. PloS one. 2017; 12(12):0189012.
Csardi G, Nepusz T. The igraph software package for complex network research. InterJournal. 2006; Complex Systems:1695.
Chang W, Cheng J, Allaire J, Xie Y, McPherson J. Shiny: Web Application Framework for R. 2018. R package version 1.1.0. https://CRAN.R-project.org/package=shiny. Accessed 20 Sept 2018.
Yu G, Li F, Qin Y, Bo X, Wu Y, Wang S. Gosemsim: an r package for measuring semantic similarity among go terms and gene products. Bioinformatics. 2010; 26(7):976–8.
Consortium GO, et al. Gene ontology consortium: going forward. Nucleic Acids Res. 2015; 43(D1):1049–56.
Chen L, Li J, Guo T, Ghosh S, Koh SK, Tian D, Zhang L, Jia D, Beuerman RW, Aebersold R, et al. Global metabonomic and proteomic analysis of human conjunctival epithelial cells (IOBA-NHC) in response to hyperosmotic stress. J Proteome Res. 2015; 14(9):3982–95.
Yu G, Wang L-G, Han Y, He Q-Y. Distinct metabolic responses of an ovarian cancer stem cell line. BMC Syst Biol. 2014; 8(1):134.
Decuypere S, Maltha J, Deborggraeve S, Rattray NJ, Issa G, Bérenger K, Lompo P, Tahita MC, Ruspasinghe T, McConville M, et al. Towards Improving Point-of-Care Diagnosis of Non-malaria Febrile Illness: A Metabolomics Approach. PLoS Negl Trop Dis. 2016; 10(3):0004480.
Ziarrusta H, Mijangos L, Picart-Armada S, Irazola M, Perera-Lluna A, Usobiaga A, Prieto A, Etxebarria N, Olivares M, Zuloaga O. Non-targeted metabolomics reveals alterations in liver and plasma of gilt-head bream exposed to oxybenzone. Chemosphere. 2018; 211:624–31.
Gogiashvili M, Edlund K, Gianmoena K, Marchan R, Brik A, Andersson JT, Lambert J, Madjar K, Hellwig B, Rahnenführer J, et al. Metabolic profiling of ob/ob mouse fatty liver using HR-MAS 1 H-NMR combined with gene expression analysis reveals alterations in betaine metabolism and the transsulfuration pathway. Anal Bioanal Chem. 2017; 409(6):1591–606.
Pollard P, Wortham N, Tomlinson I. The TCA cycle and tumorigenesis: the examples of fumarate hydratase and succinate dehydrogenase. Ann Med. 2003; 35(8):634–9. https://doi.org/10.1080/07853890310018458.
Pithukpakorn M, Wei M-H, Toure O, Steinbach PJ, Glenn GM, Zbar B, Linehan WM, Toro JR. Fumarate hydratase enzyme activity in lymphoblastoid cells and fibroblasts of individuals in families with hereditary leiomyomatosis and renal cell cancer. J Med Genet. 2006; 43(9):755–62. https://doi.org/10.1136/jmg.2006.041087.
Lehtonen HJ, Blanco I, Piulats JM, Herva R, Launonen V, Aaltonen LA. Conventional renal cancer in a patient with fumarate hydratase mutation. Hum Pathol. 2007; 38(5):793–6. https://doi.org/10.1016/j.humpath.2006.10.011.
Ni Y, Zbuk KM, Sadler T, Patocs A, Lobo G, Edelman E, Platzer P, Orloff MS, Waite KA, Eng C. Germline Mutations and Variants in the Succinate Dehydrogenase Genes in Cowden and Cowden-like Syndromes. Am J Hum Genet. 2008; 83(2):261–8. https://doi.org/10.1016/j.ajhg.2008.07.011.
Singh KK, Desouki MM, Franklin RB, Costello LC. Mitochondrial aconitase and citrate metabolism in malignant and nonmalignant human prostate tissues. Mol Cancer. 2006; 5:14. https://doi.org/10.1186/1476-4598-5-14.
Kirkegaard T, Jäättelä M. Lysosomal involvement in cell death and cancer. Biochim Biophys Acta-Mol Cell Res. 2009; 1793(4):746–54. https://doi.org/10.1016/j.bbamcr.2008.09.008.
Kaelin WG, Thompson CB. Q&A: Cancer: clues from cell metabolism. Nature. 2010; 465(7298):562–4. https://doi.org/10.1038/465562a.
Beisel WR. Metabolic response to infection. Annu Rev Med. 1975; 26(1):9–20.
Fitch CD, Cai G. -z., Shoemaker JD. A role for linoleic acid in erythrocytes infected with plasmodium berghei. Biochim Biophys Acta-Mol Basis Dis. 2000; 1535(1):45–49.
Maceyka M, Spiegel S. Sphingolipid metabolites in inflammatory disease. Nature. 2014; 510(7503):58.
Seo Y-J, Alexander S, Hahm B. Does cytokine signaling link sphingolipid metabolism to host defense and immunity against virus infections?Cytokine Growth Factor Rev. 2011; 22(1):55–61.
Godoy P, Widera A, Schmidt-Heck W, Campos G, Meyer C, Cadenas C, Reif R, Stöber R, Hammad S, Pütter L, et al. Gene network activity in cultivated primary hepatocytes is highly similar to diseased mammalian liver tissue. Arch. Toxicol. 2016; 90(10):2513–29.
Acknowledgements
We would like to thank Haizea Ziarrusta and our collaboration with the Department of Analytical Chemistry, University of the Basque Country (UPV/EHU), Leioa, for using, discussing and helping improve our software. We would also like to thank the anonymous reviewers for their valuable comments.
Funding
This work was supported by the Spanish Ministry of Economy and Competitiveness (MINECO) [BFU2014-57466-P to OY, TEC2014-60337-R and DPI2017-89827-R to AP]. OY, AP and SP thank for funding CIBERDEM and CIBER-BBN, both initiatives of Instituto de Investigación Carlos III (ISCIII). SP thanks the AGAUR FI-scholarship programme. The funding body had no role in the design of the study and collection, analysis, and interpretation of data and in writing the manuscript.
Availability of data and materials
All data generated or analysed during this study are included in this published article (Additional files 5, 6 and 7).
Author information
Authors and Affiliations
Contributions
SP, FF, MV, OY and AP conceived the software. SP implemented the software and analysed the data. SP wrote the original manuscript. FF, MV, OY and AP critically revised the original manuscript. OY and AP supervised the project. All authors read and approved the final manuscript.
Corresponding author
Ethics declarations
Ethics approval and consent to participate
Not applicable.
Consent for publication
Not applicable.
Competing interests
Francesc Fernández-Albert has been employed by Takeda Cambridge Ltd. This does not alter our adherence to BioMed Central policies. There are no patents, products in development or marketed products to declare. The commercial affiliation of Francesc Fernández-Albert did not play any role in the design, analysis and outcome of this article. The authors declare that they have no competing interests.
Publisher’s Note
Springer Nature remains neutral with regard to jurisdictional claims in published maps and institutional affiliations.
Additional files
Additional file 1
User guide within FELLA showing fast and concise toy examples of its application. (HTML 2587 kb)
Additional file 2
User guide within the R package FELLA with background, implementation details and three real examples on its usage. (PDF 1096 kb)
Additional file 3
Case study with FELLA: two datasets on the effect of oxybenzone exposition on gilt-head bream. (PDF 221 kb)
Additional file 4
Case study with FELLA: a multi-omic mouse model of non-alcoholic fatty liver disease. (PDF 235 kb)
Additional file 5
Descriptive files on the three human datasets: a summary of the inputs (descriptive_input.csv), input and reported subgraph in each dataset (dataset_input.csv, dataset_subgraph.csv and dataset_subgraph.pdf), hits discussed in the results section (descriptive_hits.csv). Also contains the database object (fella_data.RData) and metadata about the database (info_fella_data.txt), the KEGG version (info_kegg.txt) and the R session (info_session.txt). (ZIP 525 kb)
Additional file 6
R workspace from the gilt-head bream datasets. (ZIP 590 kb)
Additional file 7
R workspace from the mouse model study. (ZIP 829 kb)
Rights and permissions
Open Access This article is distributed under the terms of the Creative Commons Attribution 4.0 International License(http://creativecommons.org/licenses/by/4.0/), which permits unrestricted use, distribution, and reproduction in any medium, provided you give appropriate credit to the original author(s) and the source, provide a link to the Creative Commons license, and indicate if changes were made. The Creative Commons Public Domain Dedication waiver(http://creativecommons.org/publicdomain/zero/1.0/) applies to the data made available in this article, unless otherwise stated.
About this article

Cite this article
Picart-Armada, S., Fernández-Albert, F., Vinaixa, M. et al. FELLA: an R package to enrich metabolomics data. BMC Bioinformatics 19, 538 (2018). https://doi.org/10.1186/s12859-018-2487-5
Received:
Accepted:
Published:
DOI: https://doi.org/10.1186/s12859-018-2487-5