
Abstract
We report on new flavor tagging algorithms developed to determine the quark-flavor content of bottom (
 ) mesons at Belle II. The algorithms provide essential inputs for measurements of quark-flavor mixing and charge-parity violation. We validate and evaluate the performance of the algorithms using hadronic
 decays with flavor-specific final states reconstructed in a data set corresponding to an integrated luminosity of 62.8 fb\(^{-1}\), collected at the
  resonance with the Belle II detector at the SuperKEKB collider. We measure the total effective tagging efficiency to be
for a category-based algorithm and
for a deep-learning-based algorithm.
1 Introduction
Determining the quark-flavor content of heavy-flavored hadrons is essential in many measurements of quark-flavor mixing and \(CP\) violation. A keystone of the Belle II physics program is the study of  mixing and \(CP\) violation in decays of neutral
 mesons [1,2,3,4,5,6,7,8,9,10,11,12,13,14,15,16,17,18,19,20,21]. The study of these processes is key to constrain the Cabibbo–Kobayashi–Maskawa (CKM) angles
  and
and  [22,23,24,25,26,27], as well as to study flavor anomalies that could ultimately reveal possible deviations from the Standard Model expectations [28,29,30].
At Belle II,  mesons are produced in
  pairs at the
  resonance, which decays almost half of the time into a pair of neutral
  mesons. Most measurements of \(CP\) violation and
  mixing require the full reconstruction of a signal
  meson (signal side), and to determine the quark-flavor content of the accompanying
 meson (tag side) at the time of its decay, a task referred to as flavor tagging.
Flavor tagging is possible because many decay modes of neutral  mesons provide flavor signatures through flavor-specific final states. Flavor signatures are characteristics of the
 -decay products that are correlated with the flavor of the neutral
  meson, which is the charge sign of the
  quark or antiquark that it contains. For example, in semileptonic decays such as
  (charge-conjugate processes are implied everywhere in this paper), a negatively charged lepton tags unambiguously a \({\overline{B}}^0\), which contains a negatively charged
  , while a positively charged lepton tags a \({B}^0\), which contains a positively charged
  .
.
To determine the quark-flavor of
 mesons, Belle II exploits the information associated with the
 -decay products using multivariate machine-learning algorithms. We develop two algorithms. The first one is a category-based flavor tagger [31], which is inspired by previous flavor taggers developed by the Belle and the BaBar collaborations [32, 33]. The category-based flavor tagger first identifies
 -decay products and then combines all information to determine the
 flavor. The second algorithm is a deep-learning neural network (DNN) flavor tagger [34], that determines the
 flavor in a single step without pre-identifying
 -decay products.
In the following, we focus on the description of the algorithms and their training procedure. We evaluate the performance of the algorithms by measuring the  mixing probability from the signal yield integrated in decay-time (time-integrated analysis).
To evaluate the performance, we reconstruct signal  decays with final states that allow us to unambiguously identify the flavor of the signal side and determine the flavor of the tag side using the flavor taggers. We reconstruct signal
  decays into hadronic final states with branching fractions of \(10^{-5}\) or greater to obtain a sufficiently large signal sample in the used data set. We evaluate the tagging performance on neutral
 mesons and, as a cross check, on charged
 mesons. The training of the flavor taggers, the signal
 reconstruction procedure and the event selection criteria are developed and optimized using Monte Carlo (MC) simulation before application to experimental data.
The remainder of this paper is organized as follows. Section 2 describes the Belle II detector, followed by a description of the data sets and analysis framework in Sect. 3. The category-based flavor tagger is described in Sect. 4 and the DNN tagger in Sect. 5. The training of the flavor taggers is detailed in Sect. 6. We describe the reconstruction of the calibration samples in Sect. 7 and the determination of efficiencies and wrong-tag fractions in Sect. 8. We then compare the performance of the flavor taggers in data and in simulation in Sect. 9 and present the results of the calibration in Sects. 10 and 11. A comparison with the Belle algorithm is provided in Sect. 12, followed by a summary of the paper in Sect. 13.
2 The Belle II detector
Belle II is a particle-physics spectrometer with a solid-angle acceptance of almost \(4\pi \) [1, 35]. It is designed to reconstruct the products of electron–positron collisions produced by the SuperKEKB asymmetric-energy collider [36], located at the KEK laboratory in Tsukuba, Japan. Belle II comprises several subdetectors arranged around the interaction point in a cylindrical geometry. The innermost subdetector is the vertex detector, which uses position-sensitive silicon layers to sample the trajectories of charged particles (tracks) in the vicinity of the interaction region to determine the decay vertex of their long-lived parent particles. The vertex detector includes two inner layers of silicon pixel sensors (PXD) and four outer layers of double-sided silicon microstrip sensors (SVD). The second pixel layer is currently incomplete and covers only one sixth of azimuthal angle. Charged-particle momenta and charges are measured by a large-radius, helium-ethane, small-cell central drift chamber (CDC), which also offers charged-particle-identification information via the measurement of particles’ energy-loss \({\text {d}E}/{\text {d}x}\) by specific ionization. A Cherenkov-light angle and time-of-propagation detector (TOP) surrounding the chamber provides charged-particle identification in the central detector volume, supplemented by proximity-focusing, aerogel, ring-imaging Cherenkov detectors (ARICH) in the forward regions. A CsI(Tl)-crystal electromagnetic calorimeter (ECL) enables energy measurements of electrons and photons. A solenoid surrounding the calorimeter generates a uniform axial 1.5 T magnetic field filling its inner volume. Layers of plastic scintillator and resistive-plate chambers (KLM), interspersed between the magnetic flux-return iron plates, enable identification of
 mesons and muons. We employ all subdetectors in this work.
3 Framework and data
Both flavor taggers are part of the Belle II analysis software framework [37], which is used to process all data. We train the flavor taggers using a sample of 20 million signal-only MC events [38, 39], where the signal  meson decays to the invisible final state
  and the tag-side
  meson decays to any possible final state according to known branching fractions [40]. To perform different tests after training, we use similar signal-only MC samples where the signal
  meson decays to benchmark decay modes such as
  ,
,  , and
, and  .
.
We evaluate the performance of the flavor taggers using generic MC simulation. The generic MC simulation consists of samples that include  ,
,  ,
,  ,
,  ,
,  , and
, and  processes [38,39,40,41] in proportions representing their different production cross sections and correspond to an integrated luminosity of 700 fb\(^{-1}\), about eleven times the data sample used in the measurement. We use these samples to optimize the event selection and to compare the flavor distributions and fit results obtained from the experimental data with the expectations.
Signal-only and generic MC simulation include the effect of simulated beam-induced backgrounds [1, 42], caused by the Touschek effect (scattering and loss of beam particles), by beam-gas scattering and by synchrotron radiation, as well as simulated luminosity-dependent backgrounds, caused by Bhabha scattering [43, 44] and by two-photon quantum electrodynamical processes [45].
As for experimental data, we use all good-quality data collected at the
 resonance between March 11\(^\text {th}\), 2019 and July 1\(^\text {st}\), 2020; this sample corresponds to an integrated luminosity of \(62.8\,\hbox {fb}^{-1}\) [46]. To reduce the data sample size to a manageable level, all events are required to meet loose data-skim selection criteria, based on total energy and charged-particle multiplicity in the event. Almost \(100\%\) of the
  events meet the data-skim selection criteria.
4 The category-based flavor tagger
The Belle II flavor taggers are multivariate algorithms that receive as input kinematic, track-hit, and charged-particle identification (PID) information about the particles on the tag side and provide as output the product \(q\cdot r\), where q is the flavor of the tag-side  meson, and r the dilution factor. By definition, the dilution factor r is equal to \(1-2w\), where w corresponds to the fraction of wrongly tagged events. A dilution factor \(r=0\) indicates a fully diluted flavor (no possible distinction between
  and
and  ), whereas a dilution factor \(r=1\) indicates a perfectly tagged flavor. By convention, \(q = +1\) corresponds to a tag-side
 , and \(q=-1\) corresponds to a tag-side
 .
.
The new category-based algorithm relies on flavor-specific decay modes. Each decay mode has a particular decay topology and provides a flavor-specific signature. Similar or complementary decay modes are combined to obtain additional flavor signatures. The different flavor signatures are sorted into thirteen tagging categories, which are described in detail in Sect. 4.1. Table 1 shows an overview of all thirteen categories together with the underlying decay modes and the respective flavor-specific final state particles, which we call target particles.
 for charged leptons (
 or
or
 ) and
) and  for other possible particles in the decays
We identify the target particles among all available particle candidates on the tag side using discriminating input variables. Some input variables require information from all reconstructed tracks (charged candidates) [47] and all neutral clusters (neutral candidates) on the tag side. Neutral clusters are clusters in the electromagnetic calorimeter (reconstructed photons) and in the KLM detector (reconstructed
 particles) that are not associated with a reconstructed track. Summing the input variables for all categories yields a total of 186 inputs in the current configuration of the algorithm (see Sect. 4.1). Some variables are used multiple times for the same candidates in different categories. To save computing time, each variable is calculated only once for each candidate.
We adopted the useful concept of tagging categories from the previous Belle and BaBar flavor taggers [32, 33]. However, the new Belle II category-based flavor tagger includes more categories and more input variables than previously implemented algorithms.
4.1 Categories and input variables
In the following, we describe the flavor signatures and the input variables. Table 2 shows an overview of the input variables for each category. Except for the Maximum-\(p^*\) category, PID variables are used for all categories. The PID variables correspond to PID likelihoods \({\mathcal {L}}\) [1], which can be either combined likelihoods considering 6 possible long-lived charged-particle hypotheses (
 ,
,
 ,
,
 ,
,
 ,
,
 , and deuteron), or binary likelihoods considering only two of the hypotheses. The PID likelihoods can be calculated using all sub-detectors providing particle identification, or single ones (TOP, ARICH, ECL, KLM, or \({\text {d}E}/{\text {d}x}\) from CDC). For example,
  stands for binary
  PID using only CDC information.
 -decay vertex is used. All variables are calculated for every particle candidate
Electron, muon, and kinetic lepton These categories exploit the signatures provided by primary leptons from  decays occurring via transitions
  , or
, or  , where
  corresponds to an electron, muon or both depending on the category. Useful variables to identify primary leptons are the momentum p, the transverse momentum \(p_\text {t}\), and the cosine of the polar angle \(\cos {\theta }\), which can be calculated in the lab frame, or in the
 frame (denoted with a \(^*\) superscript). We consider the following variables calculated only in the
 frame:
-
 , the squared invariant mass of the recoiling system
  whose four-momentum is defined by
where the index i goes over all charged and neutral candidates on the tag side and
 corresponds to the index of the lepton candidate.
 -
 , the absolute value of the missing momentum.
 -
\(\cos {\theta ^*_\text {miss}}\), the cosine of the angle between the momentum
 of the lepton candidate and the missing momentum \(\varvec{p}_\text {miss}^*\).
 -
 , the energy in the hemisphere defined by the direction of the virtual
 in the
 meson decay,
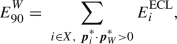
where the sum extends over all charged and neutral candidates in the recoiling system
 that are in the hemisphere of the
 , and \(E^\mathrm{ECL}\) corresponds to the energy deposited in the ECL. The momentum of the virtual
 is calculated as
where the momentum
 of the neutrino is estimated using the missing momentum \(\varvec{p}_\text {miss}^*\). In the equation above we assume the
 meson to be almost at rest in the
 frame, that is
  and thus
 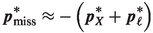 .
. -
\(\vert \cos {\theta ^*_{\text {T}}}\vert \), the absolute value of the cosine of the angle between the momentum
 of the lepton and the thrust axis of the tag-side
 meson in the
 frame. In general, a thrust axis \(\varvec{T}\) can be defined as the unit vector that maximizes the thrust $$\begin{aligned} T = \frac{ \sum _{i} \left| \varvec{T} \cdot \varvec{p}_i \right| }{ \sum _{i} \left| \varvec{p}_i \right| }\text {,} \end{aligned}$$
where the sum extends over a group of particles. For the thrust axis of the tag-side
 meson, the sum extends over all charged and neutral candidates on the tag side.
 , the squared invariant mass of the recoiling system
  whose four-momentum is defined by
 corresponds to the index of the lepton candidate.
 , the absolute value of the missing momentum.
 of the lepton candidate and the missing momentum
  , the energy in the hemisphere defined by the direction of the virtual
 in the
 meson decay,
 that are in the hemisphere of the
 , and
, and  is calculated as
 of the neutrino is estimated using the missing momentum
  meson to be almost at rest in the
 frame, that is
  and thus
  .
. of the lepton and the thrust axis of the tag-side
 meson in the
 frame. In general, a thrust axis
  meson, the sum extends over all charged and neutral candidates on the tag side.
Intermediate electron, intermediate muon, and intermediate kinetic lepton These categories exploit flavor signatures from secondary leptons produced through the decay of charmed mesons and baryons occurring via transitions
 \(\rightarrow \)
 \(\rightarrow \)


 . In this case the charge-flavor correspondence is reversed with respect to primary leptons: a positively charged secondary lepton tags a
 meson, and a negatively charged one a
 meson. Since their momentum spectrum is much softer in comparison with primary leptons, we refer to secondary leptons as intermediate leptons.
Kaon This category exploits the signature from kaons originating from decays of charmed mesons and baryons produced via  transitions. Such kaons are referred to as right-sign kaons. They tag a
 if they are negatively charged, and a
 if they are positively charged.
The kaon category provides the largest tagging power due to the high abundance of charged kaons (around \(80\%\) of the  decays contain one) and because the fraction of right-sign kaons (around \(70\%\)) is much larger than the fraction of wrong-sign kaons (around \(10\%\)) produced through processes of the kind
  , with
  .
.
To identify target kaons, we include the following input variables:
-
 , the number of reconstructed
 candidates on the tag side. Charged kaons originating from
  transitions are usually not accompanied by
 candidates, while wrong-sign kaons or charged kaons originating from
  pairs out of the vacuum are usually accompanied by one or more
 candidates.
 -
\(\sum p_\text {t}^2\), the sum of the squared transverse momentum of all tracks on the tag side in the lab frame.
-
\(M_\text {rec}^2\),
 , \(p^*_\text {miss}\), \(\cos {\theta ^*_\text {miss}}\), and \(\vert \cos {\theta ^*_{\text {T}}}\vert \), the variables in the
 frame that discriminate against the lepton background.
 , the number of reconstructed
 candidates on the tag side. Charged kaons originating from
  transitions are usually not accompanied by
 candidates, while wrong-sign kaons or charged kaons originating from
  pairs out of the vacuum are usually accompanied by one or more
 candidates.
 ,
,  frame that discriminate against the lepton background.
Slow pion The target particles of this category are secondary pions from decays  . Due to the small mass difference between
 and
and
 , the secondary pions have a soft momentum spectrum and are therefore called slow pions. To identify slow pions we include some variables of the Kinetic Lepton and the kaon category, which help distinguish the background from slow leptons and kaons.
Kaon-pion This category exploits the flavor signatures of decays containing both a right-sign kaon and a slow pion. We use the following input variables to identify both target particles:
-
\(y_\text {Kaon}\), the probability of being a target kaon obtained from the individual Kaon category (see Sect. 4.2).
-
\(y_\text {SlowPion}\), the probability of being a target slow pion obtained from the individual Slow Pion category (see Sect. 4.2).
-
 , the cosine of the angle between the kaon and the slow-pion momentum in the
 frame.
 -
 , the charge product of the kaon and the slow-pion candidates.
 , the cosine of the angle between the kaon and the slow-pion momentum in the
 frame.
 , the charge product of the kaon and the slow-pion candidates.
Fast hadron The targets of this category are kaons and pions from the
 boson in
  or
or  decays, and from one-prong decays of primary tau leptons from
  transitions, where
  stands for a
 or a
or a
 . This category considers as targets also those kaons and pions produced through intermediate resonances that decay via strong processes conserving the flavor information, for example
  . The target kaons and pions are referred to as fast hadrons because of their hard momentum spectrum. To identify them we use the same set of variables as the Slow Pion category, which also distinguish fast kaons and pions among the background of slow particles.
Maximum \(\mathbf{p }^{\varvec{*}}\) This category is a very inclusive tag based on selecting the charged particle with the highest momentum in the
 frame and using its charge as a flavor tag. In this way we give a higher weight to primary particles that may have not been selected either as a primary lepton or as a fast hadron. Primary hadrons and leptons from the
  boson in
  or in
or in  transitions have a very hard momentum spectrum and are most likely to be the tag-side particles with the largest momenta in a given event.
Fast-slow-correlated (FSC) The targets of this category are both slow pions and high-momentum primary particles. To identify them, we use the following input variables:
-
\(p^*_\text {Slow}\), the momentum of the slow pion candidate in the
 frame.
 -
\(p^*_\text {Fast}\), the momentum of the fast candidate in the
 frame.
 -
\(\vert \cos {\theta ^*_\text {T, Slow}}\vert \), the absolute value of the cosine of the angle between the thrust axis and the momentum of the slow pion candidate.
-
\(\vert \cos {\theta ^*_\text {T, Fast}}\vert \), the absolute value of the cosine of the angle between the thrust axis and the momentum of the fast candidate.
-
\(\cos {\theta ^*_{\text {SlowFast}}}\), the cosine of the angle between the momenta of the slow and the fast candidate.
-
\(q_\text {Slow} \cdot q_\text {Fast}\), the charge product of the slow pion and the fast candidate.
 frame.
 frame.
Lambda This category exploits the additional flavor signatures provided by  baryons from \(b\rightarrow c\rightarrow s\) transitions. A
  baryon indicates a
 , and a
  a
a
 . Here,
 candidates are reconstructed from pairs of proton and pion candidates. To identify target
  particles, we use the momentum of the reconstructed
  , the momenta of the proton and the pion, and also the following input variables:
-
 , the flavor of the
  baryon.
 -
 , the reconstructed mass of the
  .
. -
 , the number of reconstructed
 candidates on the tag side.
 -
 , the cosine of the angle between the
  momentum
  and the direction from the interaction point to the reconstructed
  vertex
  in the lab frame.
 -
 , the absolute distance between the
  vertex and the interaction point.
 -
 , the uncertainty on the
  vertex fit in the direction along the beam (z direction).
 -
 , the \(\chi ^2\) probability of the vertex fit of the reconstructed
  decay vertex.
 , the flavor of the
  baryon.
 , the reconstructed mass of the
  .
. , the number of reconstructed
 candidates on the tag side.
 , the cosine of the angle between the
  momentum
  and the direction from the interaction point to the reconstructed
  vertex
  in the lab frame.
 , the absolute distance between the
  vertex and the interaction point.
 , the uncertainty on the
  vertex fit in the direction along the beam (z direction).
 , the
, the  decay vertex.
In comparison with previous versions of the Belle II flavor taggers [1, 31, 34], for the current version of the algorithms we exclude track impact parameters (displacement from nominal interaction point), because they are not yet well simulated for small displacements below \(0.1\,\hbox {cm}\). Track impact parameters provide additional separation power between primary particles produced at the
 -decay vertex (and thus with small track impact parameters) and secondary particles with decay vertices displaced from the interaction point. Thus, we will consider to use them again in the future.
For the current version of the algorithms, we also exclude the p-value of the track fit for the Muon and the Kinetic Lepton categories since we observe discrepancies between data and simulation in the p-value distribution of particles identified as primary muons.
4.2 Algorithm
The category-based flavor tagger performs a two-level procedure with an event level for each category followed by a combiner level. Figure 1 shows a schematic overview. The algorithm is based on Fast Boosted Decision Tree (FBDT) [48] classifiers, which are stochastic gradient-boosted decision trees that incorporate several mechanisms for regularization and are optimized to save computing resources during training and application.

Schematic overview of the category-based flavor tagger. The tracks on the tag side are used to build five different lists of candidates:
 ,
,
 ,
,
 ,
,
 , and
, and
 . Each category considers the list of candidates belonging to its own targets. The different categories are represented by green boxes, and the combiner by a magenta box
At the event level, the flavor tagger identifies decay products providing flavor signatures among the  ,
,  ,
,  ,
,  , and
, and  candidates. Each category considers the list of particle candidates corresponding to its target particles. The event-level process is performed for each category, which corresponds to an FBDT classifier that receives the input variables associated with the category.
The event-level multivariate method assigns to each particle candidate a real-valued output \(y_\text {cat}\in [0, 1]\) corresponding to the probability of being the target of the corresponding category providing the right flavor tag. Within each category, the particle candidates are ranked according to the values of \(y_\text {cat}\). The candidate with the highest \(y_\text {cat}\) is identified as flavor-specific decay product. Figure 2 illustrates the procedure. Only for the Maximum \(p^*\) category, the candidates are ranked according to their momenta in the
 frame. Two special categories get information from other categories: the Kaon-Pion category and the Fast-Slow-Correlated (FSC) category.

Procedure for each single category (green box): the candidates correspond to the reconstructed tracks for a specific mass hypothesis. Some of the input variables consider all reconstructed tracks and all neutral ECL and KLM clusters on the tag side. The magenta boxes represent multivariate methods: \(y_{\text {cat}}\) is the output of the event level. The output of the combiner is equivalent to the product \(q\cdot r\). Each box corresponds to an FBDT classifier
At the combiner level, the algorithm combines the information provided by all categories into the final product \(q\cdot r\) using a combiner-level FBDT. Combining the information provided by all categories improves the performance of the flavor tagger as the
 decays possibly offer more than one flavor-specific signature. The combiner receives an input from each category corresponding to the product \(q_\mathrm{cand}\cdot y_\mathrm{cat}\), where \(q_\mathrm{cand}\) is the charge (or
  flavor) of the candidate identified as flavor-specific decay product, and \(y_\mathrm{cat}\) is the probability provided by the event-level FBDT. Only for the Kaon and the Lambda categories the input is the effective product
where the products extend over the three particles with the highest \(y_\text {cat}\) value. The use of \((q_\text {cand}\cdot y_\text {cat})_\text {eff}\) for the Kaon and the Lambda categories slightly improves the tagging performance. We find no significant improvement when we use it for the other categories.
The structure of the FBDT classifiers, the learning procedure, and the preprocessing of the input data is controlled with different so-called hyper-parameters. We use the default hyper-parameter values optimized for the Full-Event-Interpretation algorithm [49, 50], which performs similarly complex classifications to identify
 mesons and other intermediate particles. The number of levels in each tree is three; the number of cuts for the cumulative probability histograms of each input variable is eight; the fraction of the sample to train each tree (sampling rate) is 0.5; the learning rate to regulate the training is 0.1. For the flavor tagger, only the number of trees was optimized to 500. For the training procedure, the FBDT algorithm transforms the distribution of the input variables to a uniform distribution and uses a negative binomial log-likelihood loss function.
The FBDT algorithm provides an internal ranking of input variables by counting how often the variables are used to split decision tree nodes and by weighting each split according to the separation gain and the number of events in the node [48, 49]. Based on this ranking [31], we generally observe that the input variables with largest separation power at the event level are the PID variables followed by the particle momenta. Variables requiring information from all tracks and neutral clusters, for example \(M_\text {rec}^2\),  , and \(\cos {\theta ^*_\text {miss}}\), provide marginal additional separation power. At the combiner level, the categories with largest separation power are the Kaon and the Kinetic Lepton categories followed by the Maximum \(p^*\), Slow Pion, FSC, and Fast Hadron categories. The other categories provide marginal additional separation power.
5 The deep-learning flavor tagger
To explore the advantages of deep-learning multivariate methods, we developed a DNN flavor tagger based on a deep-learning multi-layer perceptron (MLP). The algorithm is designed to learn the correlations between the characteristics of the tag-side tracks and the flavor of the tag-side
 meson avoiding any pre-selection of decay products. The algorithm provides as output the product \(q\cdot r\). The implementation of the algorithm is based on the machine-learning library Tensor-flow [51].
The DNN flavor tagger sorts the tracks on the tag side into two groups, a positive and a negative one, depending on the electric charge of the particle (see Fig. 3). The algorithm ranks the tracks in each group according to their momenta in the
 frame, and selects the top five tracks in each group. We find on average around six tag-side tracks per event in simulation with about equal fraction of positive and negative tracks. About \(96\%\) of the events have fewer than ten tag-side tracks. If an event contains fewer than five positive or fewer than five negative tracks, the algorithm sets the input variables for the missing candidates to zero.
For each charged-particle candidate, the deep-learning MLP receives ten input variables in the current configuration: five PID likelihoods  ,
,  ,
,  ,
,  , and
, and  , the magnitude of the momentum \(p^*\), the cosine of the polar angle \(\cos \theta ^*\), the azimuth angle \(\phi ^*\), and the number of hits in the vertex detectors \(N_\mathrm{PXD}\) and \(N_\mathrm{SVD}\). Multiplying the number of input variables by the number of candidates yields 100, corresponding to the number of input nodes.
We optimize the hyper-parameters of the MLP by performing various scans. The optimized MLP contains eight hidden layers with 300 nodes each. Based on previous studies on similarly complex classification tasks [52], we employ the \(\tanh \) function as activation function to describe possible non-linear dependences between the inputs and the
 -meson flavor. The inputs are transformed to be uniformly distributed in the range \([-1,1]\) corresponding to the range of the activation function. Zero, the default value for missing tracks, corresponds to the mean of the transformed distribution.
For the training procedure, we use a binary cross-entropy loss function with regularization terms [34]. The loss function is minimized using a mini-batch stochastic gradient-descent algorithm based on backpropagation [53].

Scheme of the input information for the MLP in the deep-learning flavor tagger. The tracks on the tag side are sorted into two groups according to their electric charge and ranked according to their momenta in the
 frame. The top 5 tracks in each group are selected as candidates. The MLP receives input variables for each candidate
6 Training procedure
Both flavor taggers are trained using  samples (see Sect. 3). In this way, we avoid possible bias due to
 asymmetries or reconstruction performance since these samples are generated without built-in
 violation, and all reconstructed objects (tracks, photons, and KLM clusters) can be used to form the tag side without passing through reconstruction of the signal side.
The algorithms are trained with a sample of about ten million MC events and tested afterwards with an independent sample of the same size to exclude overtraining. We find no significant improvement in tagging performance using two to five times larger training samples. We train the algorithms for each MC campaign to optimize them for the most up-to-date data processing and background expectation.
For the category-based algorithm, the training sample is divided into two statistically independent MC samples of the same size: one sample for the event level, and one sample for the combiner level. The event level is trained first and each category is trained independently. The combiner is trained afterwards.
For the DNN algorithm, we take about \(10\%\) of the training sample as an independent validation sample. We monitor the training procedure by calculating the value of the loss function on the validation sample at each training epoch and stop the training procedure if the value starts increasing for a fixed number of 100 epochs. We then save the MLP configuration at the epoch leading to the best performance on the validation sample. Typically, the training is stopped after about 500 epochs. We train 10 different MLPs with different initial random weights and keep only the one leading to the best performance.
Over-fitting is checked for each of the multivariate methods in both flavor taggers by comparing the distribution of the output on the training sample with the output on the testing sample. The output on the training and on the testing sample have to be statistically compatible.
For the DNN tagger, the MLP complexity calls for significant computing resources to train the algorithm. We use GPUs to train the deep-learning MLP to exploit their parallel computation capabilities. On a GTX 970 GPU [54], the training procedure for the eight-layer MLP takes about 48 hours. In comparison, the training procedure for the category-based flavor tagger takes about five hours running on a single CPU core.
We compare the performance of both flavor taggers using the testing  sample. Figure 4 shows the 2D distribution of the DNN output vs. the combiner FBDT output. From the sample we estimate a Pearson correlation coefficient around \(90\%\). Figure 5 shows the receiver operating characteristics (ROC) and the area under the ROC curve (AUC) for all events, for events containing a target particle of the Kinetic Lepton or Kaon categories, and for events containing less than 5 tracks, 5 to 10 tracks, and more than 10 tracks. The category-based tagger reaches a slightly better performance for events with a target of the Kinetic Lepton category and for events with more than ten tracks. On the other hand, the DNN tagger reaches a slightly better performance for events with one target of the Kaon category and for events with less than 10 tracks. However, in general, both algorithms reach about the same performance for all events and for the various sub-samples.
After the training, we perform checks using signal-only MC samples, where the signal  meson decays to one benchmark mode such as
  ,
,  ,
, 
 , or one of the neutral
 decays listed in the following section. We reconstruct the signal
 decay in each event and use the tag-side objects as input for the flavor taggers. For correctly associated MC events, we verify that the tagging performance is consistent with the one obtained using the
  sample.

Distribution of the DNN tagger output vs. the category-based (FBDT) tagger output in the testing  simulation sample

Receiver operating characteristic curves comparing the performance of the DNN tagger and the category-based (FBDT) tagger in the testing  simulation sample. Curves and values of area under the curve (AUC) are shown for (left) all events, events with one target particle of the Kinetic Lepton category and events with one target particle of the Kaon category, and (right) events with less than 5 tracks, with 5 to 10 tracks and with more than 10 tracks
7 Reconstruction of calibration samples
To evaluate the performance of the flavor taggers, we reconstruct the following signal
 decays,

for which we reconstruct the following
 decays,

7.1 Reconstruction and baseline selection
We reconstruct charged-pion and charged-kaon candidates by starting from the most inclusive charged-particle selections. To reduce the background from tracks that do not originate from the interaction region, we require fiducial criteria that restrict the candidates to loose ranges of displacement from the nominal interaction point (\(|dr|<{0.5}\, \hbox {cm}\) radial and \(|dz|<{3}\, \hbox {cm}\) longitudinal) and to the full polar-acceptance in the central drift chamber (\({17}^{\circ }<\theta <{150}^{\circ }\)). Additionally, we use PID information to identify kaon candidates by requiring the likelihood  to be larger than 0.4.
We reconstruct neutral pion candidates by requiring photons to exceed energies of \({80}\, \hbox {MeV}\) in the forward region, \({30}\, \hbox {MeV}\) in the central volume, and \({60}\, \hbox {MeV}\) in the backward region. We restrict the diphoton mass to be in the range \({120}<\; M(\gamma \gamma ) < {145}\, \hbox {MeV}/c^2\). The mass of the \(\pi ^0\) candidates is constrained to its known value [40] in subsequent kinematic fits.
For \(K_\mathrm{S}^0\) reconstruction, we use pairs of oppositely charged particles that originate from a common decay vertex and have a dipion mass in the range \({450}<\; M(\pi ^+\pi ^-) < {550}\, \hbox {MeV}/c^2\). To reduce combinatorial background, we apply additional requirements, dependent on \(K_\mathrm{S}^0\) momentum, on the distance between trajectories of the two charged-pion candidates, the \(K^0_\mathrm{S}\) flight distance, and the angle between the pion-pair momentum and the \(K^0_\mathrm{S}\) flight direction.
The resulting \(K^\pm \), \(\pi ^\pm \), \(\pi ^0\), and  candidates are combined to form
  candidates in the various final states, by requiring their invariant masses to satisfy
-
 ,
, -

 ,
, -
 ,
, -
 ,
,
 ,
,
 ,
, ,
, ,
,where  and
and  are the invariant masses of the reconstructed
 and
and
 candidates. We reconstruct
  candidates from pairs of charged and neutral pions, and
  candidates from three charged pions with the following requirements:
-
 ,
, -
 ,
,
 ,
, ,
,where  and
and  are the known masses [40] of the
  and
and  mesons. To identify primary
  and
and  candidates used to reconstruct
  and
and  candidates, we also require the likelihood
  to be larger than 0.1 and the
  momentum in the
  frame to be larger than \({0.2}\, \hbox {GeV}/c\).
To reconstruct the signal  candidates, we combine the
  candidates with appropriate additional candidate particles,
  ,
,  or
or  , by performing simultaneous kinematic-vertex fits of the entire decay chain [55] into each of our signal channels. We perform the kinematic-vertex fits without constraining the decay-vertex position or the invariant mass of the decaying particles and require the fit to converge. Requiring the kinematic-vertex fit to converge keeps about \(96\%\) of the correctly associated MC events.
We use the following kinematic variables to distinguish  signals from the dominant continuum background from
  ,
,  ,
,  , and
, and  processes:
-
\(M_\mathrm{bc} \equiv \sqrt{s/(4c^4) - (p^{*}_B/c)^2}\), the beam-energy constrained mass, which is the invariant mass of the
 candidate calculated with the
 energy replaced by half the collision energy \(\sqrt{s}\), which is more precisely known;
 -
\(\varDelta E \equiv E^{*}_{B} - \sqrt{s}/2\), the energy difference between the energy \(E^{*}_{B}\) of the reconstructed
 candidate and half of the collision energy, both measured in the
  frame.
 candidate calculated with the
 energy replaced by half the collision energy
  candidate and half of the collision energy, both measured in the
  frame.
We retain  candidates that have \(M_\mathrm{bc} > {5.27}\, \hbox {GeV}/c^2\) and \(\vert \varDelta E\vert < {0.12}\, \hbox {GeV}\). Additionally, for channels with
 candidates, we remove combinatorial background from soft
  mesons collinear with the
 , by requiring the cosine of the helicity angle \(\theta _\mathrm{H}\) between the
 and the
 momenta in the
 frame to satisfy \(\cos {\theta _\mathrm{H}}< 0.8\).
We form the tag side of the signal  candidates using all remaining tracks and photons that fulfill the loose fiducial criteria, and KLM clusters. The category-based and the DNN taggers receive the tag-side objects and run independently of each other.
7.2 Continuum suppression and final selection
To suppress continuum background, we apply requirements on the two topological variables with the highest discrimination power between signal from hadronic
 decays and continuum background: \(\cos {\theta _\mathrm{T}^\mathrm{sig, tag}}\), the cosine of the angle between the thrust axis of the signal
  (reconstructed) and the thrust axis of the tag-side
 (remaining tracks and clusters), and \(R_2\), the ratio between the second and zeroth Fox-Wolfram moments [56] calculated using the full event information.
We vary the selections on \(\cos {\theta _\mathrm{T}^\mathrm{sig, tag}}\) and \(R_2\) to maximize the figure of merit \(\mathrm{S}/\sqrt{\mathrm{S}+\mathrm{B}}\), where \(\mathrm{S}\) and \(\mathrm{B}\) are the number of signal and background
 candidates in the signal-enriched range \(M_\mathrm{bc}>5.27\,{\hbox {GeV}}/c^2\) and \({-0.12}< \varDelta E <{0.09}\, \hbox {GeV}\). Both \(\cos {\theta _\mathrm{T}^\mathrm{sig, tag}}\) and \(R_2\) requirements are optimized simultaneously using simulation. We optimize the requirements for charged and for neutral candidates independently. The optimized requirements are found to be \(\cos {\theta _\mathrm{T}^\mathrm{sig, tag}} < 0.87\) and \( R_2 < 0.43\) for charged
  candidates, and \(\cos {\theta _\mathrm{T}^\mathrm{sig, tag}} < 0.95\) and \( R_2 < 0.35\) for neutral
  candidates.
Applying the optimized \(R_2\) and \(\cos {\theta _\mathrm{T}^\mathrm{sig, tag}}\) requirements keeps about \(81\%\) of the charged signal
 candidates and about \(77\%\) of the neutral ones, and improves the figure of merit by about \(12\%\) for charged
 candidates and by about \(14\%\) for neutral ones. We observe no significant difference in tagging performance before and after the \(R_2\) and \(\cos {\theta _\mathrm{T}^\mathrm{sig, tag}}\) requirements.
After applying the \(\cos {\theta _\mathrm{T}^\mathrm{sig, tag}}\) and \(R_2\) requirements, more than one candidate per event populate the resulting \(\varDelta E\) distributions, with average multiplicities for the various channels ranging from 1.00 to 3.00 (about \(75\%\) of the channels have multiplicities between 1.00 and 2.00). We select a single  candidate per event by selecting the one with the highest p-value of the kinematic-vertex fit. The analyses of charged and neutral
  channels are independent: we select one candidate among the charged and one among the neutral channels independently.
8 Determination of efficiencies and wrong-tag fractions
The tagging efficiency \(\varepsilon \) corresponds to the fraction of events to which a flavor tag can be assigned. Since the category-based and the DNN algorithms need only one charged track on the tag side to provide a tag, the tagging efficiency is close to \(100\%\) for both, with good consistency between data and simulation as Table 3 shows.
 candidates in data and in simulation. All values are given in percent. The uncertainties are only statistical
To estimate the fraction of wrongly tagged events w, we fit the time-integrated  mixing probability to the data. We take into account that \(\varepsilon \) and w can be slightly different for
  and
and  mesons due to charge-asymmetries in detection and reconstruction. We express \(\varepsilon \) and w as

and introduce the differences

where the subscript corresponds to the true flavor, for example  is the fraction of true
  mesons that are wrongly classified as
  .
.

Distributions of \(\varDelta E\) for (top) neutral and (bottom) charged  candidates reconstructed in (left) simulation and (right) data, restricted to \(M_\mathrm{bc} > 5.27\) GeV/\(c^2\). The fit projection of the maximum likelihood fit is overlaid
For neutral  pairs produced at the
  , the time-integrated probability for an event with a signal
 flavor \(q_\mathrm{sig}\in \{-1,+1\}\) and tag-side
 flavor \(q_\mathrm{tag}\in \{-1,+1\}\) is given by
where \(\chi _d\) is the time-integrated  mixing probability, whose current world average is \(\chi _d = 0.1858 \pm 0.0011\) [57]. The equation above assumes that for any event the signal and the tag-side
 flavor are correctly identified. To include the effect of the flavor tagging algorithms, one can express the observed probability \({\mathcal {P}}(q_\text {sig}, q_\text {tag})^\text {obs}\) in terms of the efficiencies
  and
and  , and the wrong tag fractions
  and
and  . The probability becomes

which can be written in terms of \(\varepsilon \), w, \(\mu = \varDelta \varepsilon /(2\varepsilon )\) and \(\varDelta w\) as
We sort the events in bins of the dilution factor r provided by the flavor taggers and measure the value of \(\varepsilon \), w, \(\mu \), and \(\varDelta w\) in each r bin (7 bins in total). To compare with our predecessor experiment, we use the binning introduced by Belle [32, 33].
Since we need to consider the background, we develop a statistical model with a signal and a background component. We determine the signal yield \(N_\mathrm{sig}\), the background yield \(N_\mathrm{bkg}\), the partial efficiencies \(\varepsilon _i\), the wrong-tag fractions \(w_i\), and the asymmetries \(\mu _i\) and \(\varDelta w_i\) in each r-bin i from an extended maximum likelihood fit to the unbinned distributions of \(\varDelta E\), \(q_\mathrm{sig}\), and \(q_\mathrm{tag}\). We check that the \(\varDelta E\) distribution is statistically independent from those of \(q_\mathrm{sig}\) and \(q_\mathrm{tag}\) with Pearson correlation coefficients below \(2\%\).
In the fit model, the probability density function (PDF) for each component j is given by
We model the signal \(\varDelta E\) PDF using a Gaussian plus a Crystal Ball function [58] determined empirically using signal MC events obtained from the generic simulation (see Sect. 3), with the additional flexibility of a global shift of peak position and a global scaling factor for the width as suggested by a likelihood-ratio test. The background \(\varDelta E\) PDF is modeled using an exponential function with a floating exponent. Residual peaking backgrounds in generic simulation have expected yields below \(0.5\%\) of the signal one and are thus neglected.
The flavor PDF \({\mathcal {P}}(q_\text {sig}, q_\text {tag})^\text {obs}\) has the same form for signal and background (Eq. 1) with independent \(\varepsilon _i\), \(w_i\), \(\varDelta w_i\), \(\mu _i\), and \(\chi _d\) parameters for signal and background. We fix the background \(\chi _d^\mathrm{bkg}\) parameter to zero as we obtain values compatible with zero when we let it float. We find, on the other hand, that the background parameters \(\varepsilon _i^\mathrm{bkg}\), \(w_i^\mathrm{bkg}\), \(\varDelta w_i^\mathrm{bkg}\), and \(\mu _i^\mathrm{bkg}\) have to be free to obtain unbiased results for the signal ones.
The total extended likelihood is given by
where i extends over the r bins, k extends over the events in the r bin i, and j over the two components: signal and background. The PDFs for the different components have no common parameters. Here, \(N_j\) denotes the yield for the component j, and \(N^i\) denotes the total number of events in the i-th r bin. The partial efficiencies \(\varepsilon _i\) are included in the flavor part of \({\mathcal {P}}_j\). Since we can fit only to events with flavor information, the sum of all \(\varepsilon _i\) must be one. We therefore replace the epsilon for the first bin (with lowest r) with
and obtain its uncertainty \(\delta \varepsilon _1\) from the width of the residuals of simplified simulated experiments.
To validate the \(\varDelta E\) model, we first perform an extended maximum likelihood fit to the unbinned distribution of \(\varDelta E\) (without flavor part) in simulation and data. Figure 6 shows the \(\varDelta E\) fit projections in data and simulation for charged and neutral  candidates. Table 4 summarizes the yields obtained from the fits. We observe a relatively good agreement between data and simulation, but a tendency to lower yields with respect to the expectation, especially for charged signal
 candidates.

Normalized \(q\cdot r\) distributions obtained with the category-based tagger in data and MC simulation. The contribution (left) from the signal component in data is compared with correctly associated signal MC events and (right) from the background component in data is compared with sideband MC events for (top) neutral and (bottom) charged  candidates

Normalized \(q\cdot r\) distributions obtained with the DNN tagger in data and MC simulation. The contribution (left) from the signal component in data is compared with correctly associated signal MC events and (right) from the background component in data is compared with sideband MC events for (top) neutral and (bottom) charged  candidates

Normalized output distributions of the Electron, Intermediate Electron, Muon, Intermediate Muon, Kinetic Lepton, and Intermediate Kinetic Lepton categories in data and MC simulation for  candidates. The contribution from the signal component in data is compared with correctly associated signal MC events

Normalized output distributions of the Kaon, Kaon-Pion, Slow Pion, Fast Hadron, Fast-Slow-Correlated, and Lambda categories in data and MC simulation for  candidates. The contribution from the signal component in data is compared with correctly associated signal MC events
To determine the partial efficiencies \(\varepsilon _i\) and the wrong-tag fractions \(w_i\), we perform a fit of the full model in a single step. For neutral candidates, we constrain the value of the signal \(\chi _d^\mathrm{sig}\) parameter via a Gaussian constraint,
where \(\chi _d\) and \(\delta \chi _d\) are the central value and the uncertainty of the world average. For charged
 mesons, \(\chi _d\) is zero since there is no flavor mixing.
9 Comparison of performance in data and simulation
We check the agreement between data and MC distributions of the flavor-tagger output by performing an \(s{\mathcal {P}}lot\) [59] analysis using \(\varDelta E\) as the control variable. We determine \(s{\mathcal {P}}lot\) weights using the \(\varDelta E\) fit model introduced in the previous section. We weight the data with the \(s{\mathcal {P}}lot\) weights to obtain the individual distributions of the signal and background components in data and compare them with MC simulation. We normalize the simulated samples by scaling the total number of events to those observed in data. The procedure is validated by performing the \(s{\mathcal {P}}lot\) analysis using MC simulation and verifying that the obtained signal and background distributions correspond to the distributions obtained using the MC truth.
Figures 7 and 8 show the \(q\cdot r\) distributions provided by the FBDT and by the DNN flavor tagger; the signal and background distributions for neutral and charged  candidates are shown separately. We compare the distribution of the signal component in data with the distribution of correctly associated MC events, and the distribution of the background component in data with the distribution of sideband MC events (\(M_\mathrm{bc} < {5.27}\, \hbox {GeV}/c^2\) and same fit range \(\vert \varDelta E \vert < {0.12}\, \hbox {GeV}\)). We also compare the distributions of the signal component in data with the distribution of correctly associated MC events for the individual tagging categories (Figs. 9, 10, 11). On the MC distributions, the statistical uncertainties are very small and thus not visible.
In general, the results show a good consistency between data and simulation, with a slightly worse performance in data. In the signal \(q\cdot r\) distributions, we observe some considerable differences around \(\vert q\cdot r\vert \approx 1\). We attribute these differences to discrepancies between data and simulation for some of the discriminating input variables, in particular for the electron and muon PID likelihoods. Some differences are observed for categories associated with intermediate slow particles. However, these categories provide only marginal tagging power without degrading the overall tagging performance.
10 Results
We obtain the partial tagging efficiencies \(\varepsilon _i\), the wrong-tag fractions \(w_i\), the asymmetries \(\mu _i\) and \(\varDelta w_i\) and the correlation coefficients between them from the maximum-likelihood fit of the full model to data. To evaluate the tagging performance, we calculate the total effective efficiency as
where \(\varepsilon _{\mathrm{eff}, i}\) is the partial effective efficiency in the i-th r bin. The effective tagging efficiency is a measure for the effective reduction of events due to the flavor dilution r. In \(CP\)-violation analyses, the statistical uncertainty of measured \(CP\) asymmetries is approximately proportional to \(1/\sqrt{N_\mathrm{eff}}=1/\sqrt{N\cdot \varepsilon _\mathrm{eff}}\), where \(N_\mathrm{eff}\) is the number of effectively tagged events. Thus, one would obtain the same statistical precision for \(N_\mathrm{eff}\) perfectly tagged events or for N events tagged with an effective efficiency \(\varepsilon _\mathrm{eff}\).
Tables 5 and 6 show the fit results for the category-based and the DNN flavor taggers. The respective effective efficiencies for both flavor taggers are shown in Tables 7 and 8. Figure 12 shows the Pearson correlation coefficients obtained from the Hessian matrix determined by the fit. We observe considerable dependencies among the \(\varepsilon _i\) efficiencies for both charged and neutral
 candidates, and among the asymmetries \(\varDelta w_i\) and \(\mu _i\) for neutral
 candidates.
10.1 Systematic uncertainties
We consider the systematic uncertainties associated with the \(\varDelta E\) PDF parametrization, the flavor mixing of the background, the fit bias, and the eventual bias introduced by model assumptions.
\({{\varDelta \mathbf{E }}}\) PDF parametrization We perform simplified simulated experiments using an alternative model with a different \(\varDelta E\) parametrization. We perform fits to simulated data samples bootstrapped (sampled with replacement) [60] from the generic MC simulation. We fit using default and alternative models and calculate for each fit parameter \(x_i\) the difference \(\delta x_i\) between the results obtained with the alternative model and the results obtained with the default model. We obtain the mean difference \(\delta {\hat{x}}_i\) by fitting a Gaussian function to the distribution of \(\delta x_i\) and take the full mean \(\delta {\hat{x}}_i\) as systematic uncertainty.
For the alternative signal \(\varDelta E\) PDF, we use a triple Gaussian function with the additional flexibility of a global shift of peak position and a global scaling factor for the width. For the alternative background \(\varDelta E\) PDF, we use a second-order Chebyshev polynomial function; we determine the coefficient of the quadratic term by fitting to the distribution of the generic simulation without signal MC events, and then leave the coefficient of the linear term free, in order to have the same degrees of freedom as the default model.

Normalized output distributions of the Maximum \(p^*\) category in data and MC simulation for  candidates. The contribution from the signal component in data is compared with correctly associated signal MC events
We also check whether the signal \(\varDelta E\) PDF shape changes as a function of r and
 flavor and find no significant dependences.

Correlation coefficients between \(\varepsilon _i\), \(\varDelta w_i\), \(\varDelta w_i\), and \(\mu _i\) for the (left) category-based and (right) DNN flavor tagger in data. The results are shown for (top) neutral and (bottom) charged  candidates

Dilution factor \(r = 1-2w\) as a function of the mean dilution \(\langle \vert q\cdot r \vert \rangle \) provided by the (left) category-based and (right) DNN flavor tagger in data and MC simulation for (top) neutral and (bottom) charged  candidates. The red dashed lines correspond to a linear function with an intercept at zero and a slope of one, corresponding to a perfect agreement between predicted and measured dilution
Background mixing Our fit takes into account the uncertainty on the world average for the signal \(\chi _d\) in the Gaussian constraint. However, we assume that there is no mixing in the background (\(\chi _d^\mathrm{bkg}=0\)). Since the background includes  events, we study the effect of flavor mixing in the background by varying the value of the background \(\chi _d^\mathrm{bkg}\) by a small amount \(\pm \delta \chi _d^\mathrm{bkg}\), corresponding to the statistical uncertainty when \(\chi _d^\mathrm{bkg}\) is a free parameter in the fit. We find that the difference between the results for \(\chi _d^\mathrm{bkg} + \delta \chi _d^\mathrm{bkg}\) and for \(\chi _d^\mathrm{bkg} - \delta \chi _d^\mathrm{bkg}\) are below \(1\%\) of the statistical uncertainty for all fit parameters, which is negligible.
Fit bias For each fit parameter \(x_i\), we determine the fit bias using the residuals from bootstrapped simulated experiments. The residuals are the differences between the fit results for the individual bootstrapped data samples and the fit results for the parent MC sample. We take the full bias as systematic uncertainty.
Fit model Before performing the fit to data, we check that the results of the fit to the full MC sample and the true values determined using MC information agree within about one standard deviation for all fit parameters without tendency of over or underestimation across neighboring r bins. We consider possible bias that cannot be resolved with the current sample sizes and that cannot be attributed to a single effect, for example bias due to fit model or due to MC association, by assigning the uncertainty of the fit to the full MC sample as systematic uncertainty.
We further study possible asymmetries in the reconstruction of signal
 candidates that might cause bias in the measurement of the flavor tagging parameters as they are neglected in the fit model. We observe small reconstruction asymmetries between signal
  (
( ) and
) and  (
( ) in some individual r-bins below or around \(5\%\). However, we find that they do not cause statistically significant bias for samples up to \(700\,\hbox {fb}^{-1}\) by performing fits to generic simulation.

Performance of the Belle II category-based (FBDT) and deep-learning (DNN) flavor taggers in 2019–2020 Belle II data and of the Belle flavor tagger in 2003–2010 Belle data [33] taken with the second silicon-vertex detector configuration (SVD2)

Comparison of (top) tagging efficiency asymmetries \(\mu _i\) and (bottom) wrong-tag fraction asymmetries \(\varDelta w_i\) for the Belle II category-based (FBDT) and deep-learning (DNN) flavor taggers in 2019–2020 Belle II data and for the Belle flavor tagger in 2003–2010 Belle data [33] taken with the second silicon-vertex detector configuration (SVD2). There are no available Belle results for \(\mu \)
11 Linearity check
We check whether the dilution r provided by the flavor tagger corresponds to the actual definition \(r:= 1-2w\) by performing a linearity check. Figure 13 shows the linearity check for both flavor taggers in simulation and data.
For simulation, we determine the true wrong-tag fraction \(w_\mathrm{MC}\) by comparing the MC truth with the flavor-tagger output, and calculate the true dilution \(r_\mathrm{MC} = 1 -2w_\mathrm{MC}\). The mean dilution \(\langle r_\mathrm{FBDT}\rangle \) is simply the mean of \(\vert q\cdot r_\mathrm{FBDT}\vert \) for correctly associated MC events in each r bin. For data, we obtain the mean \(\langle r_\mathrm{FBDT} \rangle = \langle \vert q\cdot r_\mathrm{FBDT} \vert \rangle \) values from the signal \(q\cdot r_\mathrm{FBDT}\) distribution provided by the \(s{\mathcal {P}}lot\) analysis in Sect. 9. The dilution \(r=1-2\cdot w\) in data is obtained from the fit results for w. The linearity verifies the equivalence on average between the dilution provided by the flavor tagger and the measured one within the uncertainties. For charged  candidates, we observe a slightly non-linear behavior, which is attributed to the fact that both flavor taggers are optimized and trained only for neutral
 mesons. However, we observe a good agreement between data and simulation for both neutral and charged
  candidates.
12 Comparison with the previous Belle algorithm
A comparison of the current results with the latest results on flavor tagging obtained by Belle [33] provides interesting insight about the current and projected performance of Belle II. We compare partial efficiencies, wrong-tag fractions, total effective efficiencies, and wrong-tag asymmetries in each r-bin. Table 9, and Figs. 14 and 15 compare Belle II and Belle results. The Belle flavor tagger, which was a category-based algorithm, reached a total effective efficiency of \((30.1\pm 0.4)\%\) on Belle data [33]. We observe about the same or slightly better performance than Belle in all bins except in the highest r bin, for which we observe a smaller partial efficiency and also a slightly worse performance with respect to expectations (see Figs. 7 and 8). For the wrong-tag fractions, we observe larger asymmetries between  and
and  than Belle.
In comparison with the Belle algorithm [32, 33], the Belle II category-based flavor tagger considers more flavor signatures and more input variables, and is fully based on multivariate methods avoiding the cut-based identification of decay products and exploiting the correlations between input variables and between flavor signatures.
For the current version of the category-based and the DNN flavor taggers, we obtain a total effective efficiency around \(32.5\%\) in simulation. Previous studies [1, 31, 34] show that using track impact parameters as additional input variables potentially improves the total effective tagging efficiency by about 2 to \(3\%\) in its absolute value. Nonetheless, the current results show that Belle II can reach a tagging performance comparable with the one obtained by Belle even with a not yet fully-optimized calibration of the tracking and PID systems, and operating in harsher background conditions than those experienced by Belle.
13 Summary
We report on the performance of two new Belle II  -flavor tagging algorithms on Belle II data collected at the
 resonance between 2019 and 2020. The algorithms exploit modern machine-learning techniques to determine the quark-flavor content of neutral
 mesons from the kinematic, track-hit, and particle-identification information associated with the reconstructed decay products. We validate the algorithms in simulation and in data using samples containing one fully reconstructed signal
 decay. We reconstruct abundant signal
 decays to flavor-specific hadronic final states and then use the remaining tracks and neutral clusters in each event as input for the flavor taggers.
We use the \(\varDelta E\) distribution of the fully reconstructed
 candidates, restricted in \(M_\mathrm{bc}\), to identify the
 signals and measure the tagging efficiencies, fractions of wrongly tagged events and related asymmetries from the flavor evolution of the signal
  pairs in a time-integrated way. Using a category-based flavor tagging algorithm, we obtain for neutral
  candidates the total effective efficiency
\(\varepsilon _{\mathrm{eff}} = \big (30.0 \pm 1.2(\text {stat}) \pm 0.4(\text {syst})\big )\% \),
and for charged  candidates
\(\varepsilon _{\mathrm{eff}} = \big (37.0 \pm 0.6(\text {stat}) \pm 0.2(\text {syst})\big )\% \).
Using a deep-learning-based flavor tagging algorithm, we obtain for neutral  candidates the total effective efficiency
\(\varepsilon _{\mathrm{eff}} = \big (28.8 \pm 1.2(\text {stat}) \pm 0.4(\text {syst})\big )\% \),
and for charged  candidates
\(\varepsilon _{\mathrm{eff}} = \big (39.9 \pm 0.6(\text {stat}) \pm 0.2(\text {syst})\big )\% \).
The performance of the flavor taggers is generally compatible with expectations from simulation and is comparable with the best performance obtained by the Belle experiment within the uncertainties. While both flavor taggers perform equally good in simulation, the deep-learning-based algorithm performs slightly worse than the category-based one in data. This is most likely due to current discrepancies between data and simulation since deep-learning methods heavily rely on a good description of the dependences among input variables. Thus we expect improvements in the future.
This work marks a milestone for future calibrations, which will play an essential role in measurements of
 asymmetries at Belle II and ultimately in the search for deviations from the Standard Model expectations.
Data Availability Statement
This manuscript has no associated data or the data will not be deposited. [Authors’ comment: Belle II data is currently accessible only for members of the Belle II collaboration.]
References
E. Kou et al., PTEP 2019(12), 123C01 (2019). https://doi.org/10.1093/ptep/ptz106 [Erratum: PTEP 2020, 029201 (2020)]
K. Abe et al., Phys. Rev. D 71, 072003 (2005). https://doi.org/10.1103/PhysRevD.71.072003 [Erratum: Phys. Rev. D 71, 079903 (2005)]
B. Aubert et al., Phys. Rev. D 67, 072002 (2003). https://doi.org/10.1103/PhysRevD.67.072002
R. Aaij et al., Eur. Phys. J. C 76(7), 412 (2016). https://doi.org/10.1140/epjc/s10052-016-4250-2
I. Adachi et al., Phys. Rev. Lett. 108, 171802 (2012). https://doi.org/10.1103/PhysRevLett.108.171802
B. Aubert et al., Phys. Rev. D 79, 072009 (2009). https://doi.org/10.1103/PhysRevD.79.072009
R. Aaij et al., Phys. Rev. Lett. 115(3), 031601 (2015). https://doi.org/10.1103/PhysRevLett.115.031601
B. Aubert et al., Phys. Rev. D 71, 032005 (2005). https://doi.org/10.1103/PhysRevD.71.032005
I. Adachi et al., Phys. Rev. D 98(11), 112012 (2018). https://doi.org/10.1103/PhysRevD.98.112012
I. Adachi et al., Phys. Rev. D 88(9), 092003 (2013). https://doi.org/10.1103/PhysRevD.88.092003
J.P. Lees et al., Phys. Rev. D 87(5), 052009 (2013). https://doi.org/10.1103/PhysRevD.87.052009
P. Vanhoefer et al., Phys. Rev. D 93(3), 032010 (2016). https://doi.org/10.1103/PhysRevD.94.099903, https://doi.org/10.1103/PhysRevD.93.032010 [Addendum: Phys. Rev.D 94(9), 099903 (2016)]
B. Aubert et al., Phys. Rev. D 76, 052007 (2007). https://doi.org/10.1103/PhysRevD.76.052007
A. Kusaka et al., Phys. Rev. Lett. 98, 221602 (2007). https://doi.org/10.1103/PhysRevLett.98.221602
J.P. Lees et al., Phys. Rev. D 88(1), 012003 (2013). https://doi.org/10.1103/PhysRevD.88.012003
K.F. Chen et al., Conf. Proc. C 060726, 823 (2006). https://doi.org/10.1103/PhysRevLett.98.031802
J.P. Lees et al., Phys. Rev. D 85, 112010 (2012). https://doi.org/10.1103/PhysRevD.85.112010
M. Fujikawa et al., Phys. Rev. D 81, 011101 (2010). https://doi.org/10.1103/PhysRevD.81.011101
B. Aubert et al., Phys. Rev. D 79, 052003 (2009). https://doi.org/10.1103/PhysRevD.79.052003
B. Aubert et al., Phys. Rev. D 78, 071102 (2008). https://doi.org/10.1103/PhysRevD.78.071102
Y. Ushiroda et al., Phys. Rev. D 74, 111104 (2006). https://doi.org/10.1103/PhysRevD.74.111104
N. Cabibbo, Phys. Rev. Lett. 10, 531 (1963). https://doi.org/10.1103/PhysRevLett.10.531
M. Kobayashi, T. Maskawa, Prog. Theor. Phys. 49, 652 (1973). https://doi.org/10.1143/PTP.49.652
A.B. Carter, A.I. Sanda, Phys. Rev. D 23, 1567 (1981). https://doi.org/10.1103/PhysRevD.23.1567
C. Dib, I. Dunietz, F.J. Gilman, Y. Nir, Phys. Rev. D 41, 1522 (1990). https://doi.org/10.1103/PhysRevD.41.1522
M. Gronau, D. London, Phys. Rev. Lett. 65, 3381 (1990). https://doi.org/10.1103/PhysRevLett.65.3381
H.J. Lipkin, Y. Nir, H.R. Quinn, A. Snyder, Phys. Rev. D 44, 1454 (1991). https://doi.org/10.1103/PhysRevD.44.1454
D. Atwood, M. Gronau, A. Soni, Phys. Rev. Lett. 79, 185 (1997). https://doi.org/10.1103/PhysRevLett.79.185
M. Gronau, Phys. Lett. B 627, 82 (2005). https://doi.org/10.1016/j.physletb.2005.09.014
M. Beneke, Phys. Lett. B 620, 143 (2005). https://doi.org/10.1016/j.physletb.2005.06.045
F. Abudinén, Development of a \(B^{o}\) flavor tagger and performance study of a novel time-dependent \(CP\) analysis of the decay \(B^{o}\rightarrow \pi ^{0}\pi ^{0}\) at Belle II. Ph.D. thesis, Ludwig-Maximilians-Universität München (2018). https://docs.belle2.org/record/1215/files/BELLE2-PTHESIS-2018-003.pdf
H. Kakuno et al., Nucl. Instrum. Meth. A 533, 516 (2004). https://doi.org/10.1016/j.nima.2004.06.159
A.J. Bevan et al., Eur. Phys. J. C 74, 3026 (2014). https://doi.org/10.1140/epjc/s10052-014-3026-9
J.F. Gemmler, Development and Deployment of a Deep Neural Network based Flavor Tagger for Belle II. Ph.D. thesis, Karlsruher Institut für Technologie (2020). https://docs.belle2.org/record/2423/files/BELLE2-PTHESIS-2021-005.pdf
T. Abe et al., Belle II Technical Design Report (2010)
K. Akai, K. Furukawa, H. Koiso, Nucl. Instrum. Meth. A 907, 188 (2018). https://doi.org/10.1016/j.nima.2018.08.017
T. Kuhr, C. Pulvermacher, M. Ritter, T. Hauth, N. Braun, Comput. Softw. Big Sci. 3(1), 1 (2019). https://doi.org/10.1007/s41781-018-0017-9
A.T. Ryd et al., EvtGen: A Monte Carlo Generator for B-Physics (2005)
S. Agostinelli et al., Nucl. Instrum. Meth. A 506, 250 (2003). https://doi.org/10.1016/S0168-9002(03)01368-8
P. Zyla et al., PTEP 2020(8), 083C01 (2020). https://doi.org/10.1093/ptep/ptaa104
T. Sjöstrand, S. Ask, J.R. Christiansen, R. Corke, N. Desai, P. Ilten, S. Mrenna, S. Prestel, C.O. Rasmussen, P.Z. Skands, Comput. Phys. Commun. 191, 159 (2015). https://doi.org/10.1016/j.cpc.2015.01.024
P.M. Lewis et al., Nucl. Instrum. Meth. A 914, 69 (2019). https://doi.org/10.1016/j.nima.2018.05.071
R. Kleiss, H. Burkhardt, Comput. Phys. Commun. 81, 372 (1994). https://doi.org/10.1016/0010-4655(94)90085-X
C.M. Carloni Calame, C. Lunardini, G. Montagna, O. Nicrosini, F. Piccinini, Nucl. Phys. B 584, 459 (2000). https://doi.org/10.1016/S0550-3213(00)00356-4
F.A. Berends, P.H. Daverveldt, R. Kleiss, Nucl. Phys. B 253, 441 (1985). https://doi.org/10.1016/0550-3213(85)90541-3
F. Abudinén et al., Chin. Phys. C 44(2), 021001 (2020). https://doi.org/10.1088/1674-1137/44/2/021001
V. Bertacchi et al., Comput. Phys. Commun. 259, 107610 (2021). https://doi.org/10.1016/j.cpc.2020.107610
T. Keck, Comput. Softw. Big Sci. 1(1), 2 (2017). https://doi.org/10.1007/s41781-017-0002-8
T. Keck, Machine learning algorithms for the Belle II experiment and their validation on Belle data. Ph.D. thesis, KIT, Karlsruhe (2017). https://doi.org/10.1007/978-3-319-98249-6
T. Keck et al., Comput. Softw. Big Sci. 3(1), 6 (2019). https://doi.org/10.1007/s41781-019-0021-8
R. Zadeh, B. Ramsundar, TensorFlow for Deep Learning: From Linear Regression to Reinforcement Learning (O’Reilly Media, 2018)
P. Baldi, P. Sadowski, D. Whiteson, Nat. Commun. 5, 4308 (2014). https://doi.org/10.1038/ncomms5308
D.E. Rumelhart, G.E. Hinton, R.J. Williams, Nature 323(6088), 533 (1986). https://doi.org/10.1038/323533a0
Nvidia corporation. GEFORCE GTX 970. https://www.nvidia.com/content/geforce-gtx/GTX_970_User_Guide.pdf
J.F. Krohn et al., Nucl. Instrum. Meth. A 976, 164269 (2020). https://doi.org/10.1016/j.nima.2020.164269
G.C. Fox, S. Wolfram, Nucl. Phys. B 149, 413 (1979). https://doi.org/10.1016/0550-3213(79)90120-2 [Erratum: Nucl. Phys. B 157, 543 (1979)]
Y. Amhis et al., Eur. Phys. J. C 77(12), 895 (2017). https://doi.org/10.1140/epjc/s10052-017-5058-4. Updated results and plots available at https://hflav.web.cern.ch
T. Skwarnicki, A study of the radiative CASCADE transitions between the Upsilon-Prime and Upsilon resonances. Ph.D. thesis, Cracow, INP (1986)
M. Pivk, F.R. Le Diberder, Nucl. Instrum. Meth. A 555, 356 (2005). https://doi.org/10.1016/j.nima.2005.08.106
B. Efron, Ann. Stat. 7(1), 1 (1979). https://doi.org/10.1214/aos/1176344552
Acknowledgements
We thank the SuperKEKB group for the excellent operation of the accelerator; the KEK cryogenics group for the efficient operation of the solenoid; the KEK computer group for on-site computing support; and the raw-data centers at BNL, DESY, GridKa, IN2P3, and INFN for off-site computing support. This work was supported by the following funding sources: Science Committee of the Republic of Armenia Grant No. 20TTCG-1C010; Australian Research Council and research grant Nos. DP180102629, DP170102389, DP170102204, DP150103061, FT130100303, FT130100018, and FT120100745; Austrian Federal Ministry of Education, Science and Research, Austrian Science Fund No. P 31361-N36, and Horizon 2020 ERC Starting Grant no. 947006 “InterLeptons”; Natural Sciences and Engineering Research Council of Canada, Compute Canada and CANARIE; Chinese Academy of Sciences and research grant No. QYZDJ-SSW-SLH011, National Natural Science Foundation of China and research grant Nos. 11521505, 11575017, 11675166, 11761141009, 11705209, and 11975076, LiaoNing Revitalization Talents Program under contract No. XLYC1807135, Shanghai Municipal Science and Technology Committee under contract No. 19ZR1403000, Shanghai Pujiang Program under Grant No. 18PJ1401000, and the CAS Center for Excellence in Particle Physics (CCEPP); the Ministry of Education, Youth and Sports of the Czech Republic under Contract No. LTT17020 and Charles University grants SVV 260448 and GAUK 404316; European Research Council, 7th Framework PIEF-GA-2013-622527, Horizon 2020 ERC Advanced Grants No. 267104 and 884719, Horizon 2020 ERC Consolidator Grant No. 819127, Horizon 2020 Marie Sklodowska-Curie grant agreement No. 700525 ‘NIOBE,’ and Horizon 2020 Marie Sklodowska-Curie RISE project JENNIFER2 grant agreement No. 822070 (European grants); L’Institut National de Physique Nucléaire et de Physique des Particules (IN2P3) du CNRS (France); BMBF, DFG, HGF, MPG, and AvH Foundation (Germany); Department of Atomic Energy under Project Identification No. RTI 4002 and Department of Science and Technology (India); Israel Science Foundation grant No. 2476/17, United States-Israel Binational Science Foundation grant No. 2016113, and Israel Ministry of Science grant No. 3-16543; Istituto Nazionale di Fisica Nucleare and the research grants BELLE2; Japan Society for the Promotion of Science, Grant-in-Aid for Scientific Research grant Nos. 16H03968, 16H03993, 16H06492, 16K05323, 17H01133, 17H05405, 18K03621, 18H03710, 18H05226, 19H00682, 26220706, and 26400255, the National Institute of Informatics, and Science Information NETwork 5 (SINET5), and the Ministry of Education, Culture, Sports, Science, and Technology (MEXT) of Japan; National Research Foundation (NRF) of Korea Grant Nos. 2016R1D1A1B01010135, 2016R1D1A1B02012900, 2018R1A2B3003643, 2018R1A6A1A06024970, 2018R1D1A1B07047294, 2019K1A3A7A09033840, and 2019R1I1A3A01058933, Radiation Science Research Institute, Foreign Large-size Research Facility Application Supporting project, the Global Science Experimental Data Hub Center of the Korea Institute of Science and Technology Information and KREONET/GLORIAD; Universiti Malaya RU grant, Akademi Sains Malaysia and Ministry of Education Malaysia; Frontiers of Science Program contracts FOINS-296, CB-221329, CB-236394, CB-254409, and CB-180023, and SEP-CINVESTAV research grant 237 (Mexico); the Polish Ministry of Science and Higher Education and the National Science Center; the Ministry of Science and Higher Education of the Russian Federation, Agreement 14.W03.31.0026, and the HSE University Basic Research Program, Moscow; University of Tabuk research grants S-0256-1438 and S-0280-1439 (Saudi Arabia); Slovenian Research Agency and research grant Nos. J1-9124 and P1-0135; Agencia Estatal de Investigacion, Spain grant Nos. FPA2014-55613-P and FPA2017-84445-P, and CIDEGENT/2018/020 of Generalitat Valenciana; Ministry of Science and Technology and research grant Nos. MOST106-2112-M-002-005-MY3 and MOST107-2119-M-002-035-MY3, and the Ministry of Education (Taiwan); Thailand Center of Excellence in Physics; TUBITAK ULAKBIM (Turkey); Ministry of Education and Science of Ukraine; the US National Science Foundation and research grant Nos. PHY-1807007 and PHY-1913789, and the US Department of Energy and research grant Nos. DE-AC06-76RLO1830, DE-SC0007983, DE-SC0009824, DE-SC0009973, DE-SC0010007, DE-SC0010073, DE-SC0010118, DE-SC0010504, DE-SC0011784, DE-SC0012704, DE-SC0021274; and the Vietnam Academy of Science and Technology (VAST) under grant DL0000.05/21-23.
Author information
Authors and Affiliations
Rights and permissions
Open Access This article is licensed under a Creative Commons Attribution 4.0 International License, which permits use, sharing, adaptation, distribution and reproduction in any medium or format, as long as you give appropriate credit to the original author(s) and the source, provide a link to the Creative Commons licence, and indicate if changes were made. The images or other third party material in this article are included in the article’s Creative Commons licence, unless indicated otherwise in a credit line to the material. If material is not included in the article’s Creative Commons licence and your intended use is not permitted by statutory regulation or exceeds the permitted use, you will need to obtain permission directly from the copyright holder. To view a copy of this licence, visit http://creativecommons.org/licenses/by/4.0/.
Funded by SCOAP3
About this article

Cite this article
Abudinén, F., Akopov, N., Aloisio, A. et al. B-flavor tagging at Belle II. Eur. Phys. J. C 82, 283 (2022). https://doi.org/10.1140/epjc/s10052-022-10180-9
Received:
Accepted:
Published:
DOI: https://doi.org/10.1140/epjc/s10052-022-10180-9