Abstract
International business and public policy research have examined the techniques that multinational enterprises (MNEs) use to shift revenues to subsidiaries in offshore financial centres (OFCs) in order to minimize tax liability and arbitrage for their advantage. While study of such tax arbitrage strategies has looked to geographical locations and legal dimensions to better understand these strategies, it has ignored the structural and organizational relationship between MNEs and their subsidiaries. We define two distinct types of OFC-based corporate entities based on their location among and apparent control over other MNE affiliates: ‘stand-alone’ OFCs at the end of a chain of MNE subsidiaries; and ‘in-betweener’ OFCs with equity control over further entities and hence apparent flexibility to redirect profits to other MNE subsidiaries further down the chain. We hypothesize that when MNEs have in-betweener OFCs controlling a substantial share of overall MNE profits, this indicates greater MNE interest in aggressive tax planning (ATP). We then evaluate empirical support for our claims based on an ‘equity mapping’ approach identifying stand-alone and in-betweener OFCs in 100 of the largest MNEs operating globally. This study demonstrates that a key factor determining tax arbitrage is not the amount of value registered on OFC subsidiaries’ balance sheets, but rather the portion of the group’s operating revenues and net income controlled by OFC subsidiaries. National taxing authorities could benefit from tracking in-betweener OFC locations and behaviour to counter ATP strategies, decrease sovereign arbitrage, and increase MNE tax revenue.
INTRODUCTION
In this paper, we propose that the location and structure of multinational enterprise (MNE) subsidiary entities registered in offshore financial centres (OFCs) position those MNEs to engage more easily in tax arbitrage among national tax authorities as part of a broader tax minimization strategy. We identify two types of MNE subsidiary entities located at different points in an MNE subsidiary ‘chain’ running from the parent to some endpoint: (1) ‘stand-alone’ entities located at the end of a chain; and (2) ‘in-betweener’ entities as upstream shareholders who invest in subsidiaries down the chain. MNEs with in-betweener entities that control more income may be better positioned to engage in aggressive tax planning (Avi-Yonah et al., 2008; Eicke, 2009). To identify the type of entity and calculate the share of income they control, we use an ‘equity mapping’ approach. This allows us to identify stand-alone and in-betweener entities operating in OFCs in our sample of the 100 largest non-state-owned, non-financial MNEs operating in 2018. We find that in-betweener entities operating in OFCs appear less frequently but control a larger share of overall MNE operating revenues and net income compared to stand-alone entities operating in OFCs.1 Our analyses contribute to international business (IB) and related public policy research primarily by providing novel concepts and empirics to identify MNEs more likely to engage in aggressive tax planning.
In the past decade, the battle against tax avoidance has intensified. Recent policies target individual countries and MNEs alongside their (germane) subsidiaries. The OECD, for instance, has introduced several measures including country black-listing (Kudrle, 2009; Sharman, 2009), bilateral tax information model treaties (Sawyer, 2011; Valderrama and Johanna, 2010), automatic exchange agreements (Lesage et al., 2019; Sadiq and Sawyer, 2016), and country-by-country reporting (Tang and Schultz, 2017). These policies promote comparison of MNE subsidiary structure with specific tax jurisdictional data. The EU has been developing policies designed to isolate potentially ‘artificial’ corporate entities (Heckemeyer et al., 2017; Loretz et al., 2017; Panayi, 2015, 2006). Taxation policy oversight of MNEs tends to focus on specific subsidiaries in specific countries.
This geographic focus on the legal dimension limits tax policy effectiveness. MNE tax minimization strategies are not carried out in a single subsidiary or country. They are implemented across several MNE subsidiaries not unlike other broader strategies (Eicke, 2009; Karamanou et al., 2012; Loretz et al., 2017; Panayi, 2015; Robé, 2011). Regulation of MNE tax minimization strategies requires this broader perspective to consider how MNEs structure their subsidiary corporate entities. It requires a deeper understanding of how income and revenue are distributed across MNE subsidiary operations, and how certain subsidiaries are able to re-direct that income and revenue to other subsidiaries in OFCs located in countries with lower tax rates often paired with lax corporate governance standards. Policies targeting individual MNE subsidiaries in individual countries fail to account for this organizational dimension and are more likely to fail in increasing overall tax revenue. This dimension helps explain the paradoxical outcome of a decade of tighter national tax regulation in many countries with little evidence indicating a decline in income shifting and tax arbitrage (Clausing, 2016; Cobham and Janský, 2018; Damgaard et al., 2019).
The prospect of tax arbitrage among different national taxing authorities prompts new answers to fundamental questions in IB research about firm internationalization.2 The vast and expanding literature on foreign direct investment by MNEs acknowledges a ‘wide range of potential paths any firm might take in internationalization’ (Welch and Luostarinen, 1999: 87). Yet, we often see only a narrow part of that range. Why, for instance, does an MNE in state A invest directly in state B, but delegate responsibility to an MNE subsidiary for investment in states C, D, and F? What legal and regulatory factors applying in that MNE subsidiary make it a preferred springboard for investment in states C, D, and F? A common, if implicit, assumption in IB research is that those factors are largely non-strategic. They are considered administrative factors for lawyers and accountants tucked in back-office operations, adding little, if any, value to an MNE’s competitive position in a given national market. They are thought to change little, if at all, in the MNE’s broader internationalization path. This assumption is a mistake. Lawyers, accountants, and related professionals contribute qualitatively different, but nonetheless quite valuable insights for line managers often less aware of current legal and regulatory factors in a given country and less able to anticipate shifts in those factors with changing governments and policies. Those back-office professionals can be vital partners for line managers charting international investment paths where tax rules and regulations can raise charting costs or frustrate the charting process altogether (Eicke, 2009; Karayan et al., 2002).
The policy implications of this analysis are two-fold. First, we argue that specific ways by which MNEs apportion and sequence their corporate equity structure hold vital clues to the overall internationalization strategies of the group. Second, in paying greater attention to jurisdictional arbitrage, regulators should cease treating OFC-registered MNE subsidiaries as an undifferentiated block of entities that perform more or less similar functions. Tax arbitrating techniques often exploit tax credit and amortization rules of high-tax jurisdictions where an MNE may be primarily registered, in combination with MNE subsidiaries in low-tax jurisdictions to achieve even greater tax saving. MNE subsidiaries can be classified by their organizational relationship, which distinguishes intermediating ‘in-betweeners’ from end point or ‘stand-alone’ enterprises. More effective taxation regulation requires a more focused approach, centring on those intermediating ‘in-betweeners’ that appear to play a vital role in facilitating tax arbitrage.
The remainder of this paper is divided into four additional sections. “Foundational Concepts and Literature” section immediately below discusses important foundational concepts and background literature. There, we contrast the organizational versus legal dimensions the MNE. We then discuss the international tax practices and challenges associated with studying those practices. “An Equity-Mapping Approach to Analysing International Tax Arbitrage Ability in MNEs” section discusses our equity-mapping approach to meeting those research challenges. There, we show how to identify MNE subsidiary ownership chains and introduce/distinguish two types of subsidiaries important to understanding how well-positioned an MNE is to engage in international tax arbitrage: stand-alone subsidiaries located in off-shore financial centre (OFC) countries and appearing at the end of a given MNE subsidiary chain; and in-betweener subsidiaries, also located in OFCs but appearing somewhere above a given MNE subsidiary chain. We use new data on MNE ownership in these different subsidiary types to discern where MNEs have more or less ability to shift income to other subsidiaries in countries where tax treatment is more favourable. Findings from Equity Mapping” section presents findings from application of our equity-mapping approach to the operations of 100 large MNEs operating in 2018. There, we show that in-betweener subsidiaries are less frequent than stand-alone subsidiaries but control substantially more MNE income and related revenues for tax arbitrage purposes. MNEs with in-betweener subsidiaries controlling more of both are better positioned to engage in aggressive tax planning (ATP) strategies. “Conclusion” section concludes our paper with a recitation of our central research goals and key findings, their implications for research and related public policy, and the future research directions they open up for scholars in IB and related fields.
FOUNDATIONAL CONCEPTS AND LITERATURE
Organizational Versus Legal Dimensions of the MNE
MNEs have evolved in the past three or four decades into highly complex, multi-subsidiary, multi-jurisdictional organizations, often spanning hundreds, if not thousands, of independent corporate entities, linked by a complex web of ownership arrangements (Avraham et al., 2012; UNCTAD, 2016). These organizations are typically viewed as singular economic actors, which in many ways they are. However, MNEs are technically legal constructs with a parent corporation as the sole or controlling shareholder of multiple, separately incorporated subsidiaries, affiliates, joint ventures and the like, often located in diverse jurisdictions (Blumberg, 1993; Matheson, 2008; Robé, 2011; Lambooy et al., 2013; Adriano, 2015). Each subsidiary is a separate legal person, subject to ‘the internal affairs doctrine’, i.e. the rules and regulations, including corporate governance rules, of its country of registration (Greenfeld, 1992, see also: Adriano, 2015; Blumberg, 1993; Ferran, 1999; Robé, 2011). It owns assets and partakes in contracts in markets but strictly understood, a corporation cannot be ‘multinational’ at all. The ‘multinational corporation,’ otherwise known as ‘transnational corporation’, is not a legal person. As such, it cannot own things, partake in contracts or indeed, pay tax (Blumberg, 1993; Hadari, 1973; Orts, 2013; Robé, 2011). The MNE is de facto a network of corporate entities, each of which enters into contractual relationships with other corporate persons within and outside the group. Group subsidiaries are supposed to trade with one another at ‘arms-length’ principle – a point, interestingly, well understood and previously discussed by prominent economists (Buckley et al., 2015; Demsetz, 1997; Fama, 1980; Penrose, 2009).
However, the economic concept of the MNE has largely eclipsed the implications of the legal status of the corporation in (corporate/business) literature. The legal fiction of the independence of corporate subsidiaries, notes Eicke, ‘is not consistent with the business point of view, which regards a group of companies as one economic unity’ (Eicke, 2009: 53). Taking a unitary approach to MNEs, a business perspective tends to gloss over the fact that maximizing shareholder values encourages micromanagement of every aspect of the enterprise: from strategic planning, anticipating tax impacts across time for all parties affected, negotiating the most advantageous arrangement and transforming the tax treatment of items to the most favourable status (Karayan et al., 2002). The legal organization of the group, which involves strategic tax planning, is an essential dimension of competitive business enterprise in today’s world. The starting point of strategic tax planning according to Rolfe Eicke, is the law itself, as ‘it is the main driver, since it creates planning opportunities with its wordings, is systematic inconsistencies and in particular with its omissions’ (Eicke, 2009: 11). This is a point that seems to have been lost despite ‘the abundance of riches’ (Robé, 2011: 6) in the theorizing of the firm in the past five decades.
Modern theories of the firm produced, in fact, no dearth of opportunities for further investigation of the techniques of legal portioning, sequencing and corporate arbitrage. For example, one stream of thought, often described as the neoclassical transaction cost approach, pays great attention to taxation as costs on a par with transport costs (Niehans, 1989). One would expect economists to pay greater attention to the techniques that are used to minimize those costs. Unfortunately, as Douglas Allen notes, a narrow focus on costs that occur between firms from the process of market exchange ‘seems to be the reason why the neoclassical approach never analyses questions of economic organization outside of the choice of medium of exchange’ (Allen, 2005: 906).
A potentially more promising avenue was forged with the development of the property rights approach or the firm as a web of contracts (Alchian and Demsetz, 1972; Jensen and Meckling, 1976). In contrast to neoclassical theory, the property rights approach is explicitly concerned with the qualitative institutional analysis and the internal structural organization of firms (Simon, 1978; Williamson, 1991), the latter seen as a special case of a distribution of property rights. Law of contract, and allocation of property rights within the firm have also been subjects of considerable discussion (see in particular (Simon, 1978; Williamson, 2005, 1999, 1991). Grossman and Hart develop a model of the cost and benefit of internalizing corporate entities (Grossman and Hart, 1986). Demsetz and Lehn (1985) discuss corporate equity structure. Countless studies are employing Knightian uncertainty principles to organization (Boudreaux and Holcombe, 1989). Terminology, however, can be confusing. The concepts of ‘qualitative institutional analysis’ or ‘discrete structural alternatives’ have a very different meaning in law, referring to the type, location and distribution of corporate legal person both in jurisdictions, and along the internal topography of the firm. In economics, in contrast, concepts such as ‘structural alternatives’, ‘organizational design’, or ‘qualitative institutional analysis’ relate either to typologies of market/hierarchy forms, or to the economics of corporate holdings (subsidiary versus joint ventures and the like), and do not involve the concrete legal organization of the firm and choice of corporate personality (Demsetz, 1997).
A third stream of opportunity (lost) is associated more closely with new institutionalism. This tradition treats firms as ‘problem-solving institutions’ (Demsetz, 1988: 141) operating under the constraining institutional environments which are ‘the rules of the game in society’ (North, 1990: 3). Driven by competitive strategic considerations, internationalizing firms multiply the number and variety of institutional constraints under which they must operate, as each host country imposes its own formal and informal rules of the game. Much of the economic literature seems to have taken the view, implicitly and without providing much evidence, that the structuring of internal investments through the use of the corporate legal person, including a myriad of special purpose vehicles, is mainly or exclusively concerned with minimizing ‘friction’ caused by different regulatory environments (Welch and Welch, 1996; Atwood et al., 2012; Adriano, 2015). The role that tax considerations play in the organization of the firm subsidiaries, both domestically and internationally, is simply ignored.
The fourth stream of theory derives directly from the empirical and theoretical studies in IB, stressing the concepts of risk and uncertainty as important factors in corporate planning (Welch and Welch, 1996; Buckley and Ghauri, 1999; Cohen, 2007). It is not uncommon for IB literature to refer to the legal foundations of modern MNEs (Cohen, 2007: 28). Furthermore, it is well understood that management would seek to plan for future eventualities, anticipating environmental hazards, including political, institutional and economic risks, to create – if possible – a stable investment environment. However, what is ignored is the way by which the legal structure of the organization is used to address and anticipate a myriad environmental risks, including political risk, and put in place years, sometimes decades, in advance.
International Tax Implications
In any of the above streams, we come close to a discussion of the legal organization of the firm, or at least we could see the discussion factoring into the legal structure of firms with a little additional push. The push, however, appears never to have come. The general focus remains on the firm as a singular unit. This is correct to the extent that management takes a holistic view of the group’s strategies and tactics. However, some important cost factors, in particular taxation, are handled by management, as we argued above, at the level of the subsidiary.
Publicly traded groups present consolidated accounts for the entire group and provide a group-level view of taxes owed and taxes paid. But each corporate entity in the group, including the Global Ultimate Owner (GUO) or subsidiaries located in the same country, is considered an independent taxpayer (Ferran, 1999).3 Subsidiaries registered in a zero-tax jurisdiction such as the Cayman Islands or Bermuda pay no corporate tax, whereas subsidiaries of the same group registered in an OECD country may end up paying in excess of 30% corporate tax. The system of international business taxation incentivizes management to apportion as many taxable activities to low-tax jurisdictions as possible. They do so by rerouting passive investments through their low-tax jurisdiction subsidiaries (Birkinshaw and Morrison, 1995; Dowd et al., 2017; Forte, 2016).
In a hypothetical case of ‘transfer pricing’, an American beverage company would set up an intermediating corporate entity in a low- or zero-tax jurisdiction such as the Cayman Islands or Bermuda and transfer the logo rights and trademarks to that entity. The low-/zero-tax jurisdiction-based subsidiary would then charge enormous fees for the right to use the firms’ logo to its French subsidiary selling the beverage in France. Because of large payments for the right to use the logo, the French subsidiary would show little or no profits and hence pay little tax. This makes the Bermudan subsidiary, typically with few or no employees, highly profitable while paying little or no tax in the OFC. There is by now vast literature on the relatively simple techniques of profit shifting through transfer pricing that involve mispricing and other fairly straightforward transfer pricing schemes (Greggi, 2019; Grubert and Mutti, 1991; US Department of the Treasury, 2016). Following a considerable tightening of regulations in the past decades, such techniques of tax mitigation are now far more difficult to justify and implement. Modern MNEs, on the whole, prefer to deploy far more sophisticated methods of tax mitigation exploiting and arbitraging inconsistent national rules to their advantage (Eicke, 2009).
Tax experts believe that intermediating holding companies, particularly those located in an offshore financial centre (OFC), are an ideal tool of corporate tax planning (Avi-Yonah et al., 2008; Dorfmüller et al., 2006; Eicke, 2009; Nakamoto et al., 2019; Panayi, 2013). Holding companies can be used for treaty exemption shopping or deferral shopping, transforming non-exempt profits into exempted (or deferred) profits; they can be used for rule shopping, transforming dividend income into other accounting categories such as interest payment; they can be used for tax rate shopping, i.e. transferring income to low-tax jurisdictions and similar techniques (Eicke, 2009). One popular technique of arbitrage using such intermediary holding companies exploits diverging legal rules regarding corporate nexus for taxation purposes. The concept of nexus for state taxation purposes requires that corporations have what the legislature deems as ‘sufficient contact’ with the state for that state to tax it (Brossart, 2010). However, what is considered sufficient contact can vary from one state to the next (Brossart, 2010). This tactic was reported by the US Permanent Subcommittee on Investigation of the Apple group. According to the Subcommittee, Apple Inc. exploited diverging Irish and U.S. nexus rules to reduce its corporate tax bill significantly (Levin et al., 2013; European Commission 2016.). It set up a regional treasury hub in Ireland supposedly in control of all of Apple’s operations outside the American continent. But some of Apple’s Irish subsidiaries did not meet Ireland’s threshold of nexus rules by establishing their tax residency in Ireland (European Commission, 2016: 2.1.2, 45), nor were these entities tax resident in the US either. These subsidiaries accumulated considerable earnings from the sale of Apple hardware and software in foreign markets. Since these corporate entities were not tax resident in Ireland nor in the US, they had no effective tax residency and hence were not required to pay tax. The Levine Committee and the EU Commission both concluded that Apple’s complex arrangement with its Irish SPVs could be classified as a tax avoidance scheme – Apple and the Irish government deny the charge and won an appeal to the European Court of Justice.
Apple is not alone in making use of diverging national tax rules. There are other revelations of the complex and sophisticated tax planning schemes adopted by some well-known American software companies using ‘operations centres’ in Ireland or the Netherlands to arbitrage using the United States’ Controlled Foreign Company rules (CFC) (Coyle, 2017; Loomis, 2011). They include the infamous ‘Double Irish’, ‘Dutch Sandwich’ or ‘Double Irish, Single Malt’ (Loomis, 2011; Kelly, 2015; Coyle, 2017). American IT companies took advantage of a loophole in the complex US transfer pricing rules to set up such intermediary holdings in OFC jurisdictions. Although Code Section 367 of the CFC rules applies to cross-border transfers of the intangible property embedded within a software program, it does not apply to the development of intangible assets by a foreign affiliate outside the United States. This loophole is exploited by a parent company entering into a ‘cost-sharing arrangement’ with a foreign subsidiary of the same group for updates of software products (Darby and Lemaster, 2007: 12). A leak from the Luxembourg branch of the accounting firm PricewaterhouseCoopers revealed complex financial structures intended to exploit jurisdictional tax mismatches that allowed companies to avoid taxes both in Luxembourg and elsewhere through the use of so-called hybrid loans (Marian, 2013). There are many other known cases of hybrid mismatch arrangements that are taking advantage of diverging national rules and regulations (Johannesen, 2014; OECD, 2012).
These schemes are strictly legal and hence are classified as tax avoidance. This arbitrage exploits differences in the tax treatment of an entity or instrument under the laws of two or more countries to achieve double non-taxation of all partial or complete deferral (Nessy and Rahayu, 2019: 149). The numbers involved are not trivial. It is estimated that US firms alone have amassed between US$1.9 to 3.0 trillion in cash or near-cash deposits ‘trapped’, as Reuven Avi-Yonah puts it, in OFCs (Atwood et al., 2012; Avi-Yonah, 2019; Clausing, 2016; Dowd et al., 2017; Dyreng and Lindsey, 2009; Hines, 1988; Kaye, 2014; Miller, 2011; Phillips et al., 2017; Tørsløv et al., 2018). Researchers at the IMF came up with the startling figures that about 30% of all foreign direct investments are ‘phantom investments’ operating through shell corporations (Damgaard et al., 2019).
The practice of tax arbitrage through hybrid mismatch and corporate tax gaming has been public and discussed for some time (Avi-Yonah, 2005; Graetz, 2016), though only in the last decade has the phenomenon attracted serious attention. The OECD, UNCTAD, and different EU bodies have done a great job in collating and presenting various trans-border arbitraging schemes (OECD, 2013a; TAXUD, 2018; UNCTAD, 2016). Although each known scheme is highly sophisticated and tailored to very specific conditions or sectors, they have certain common features. First, these schemes invariably consist of specific parent–subsidiary equity arrangements among affiliated members of a group, where the totality of these arrangements represents the legal structure of the firm (HM Treasury, 2014; UNCTAD, 2016). Second, as Apple and similar cases show, the single most important factor in such sophisticated hybrid mismatch tax avoidance schemes is not the precise function of those singular entities in the corporate ecology, but their ability, in combination with other subsidiaries, to arbitrage between third-country tax rules. Third, hybrid mismatch arrangements use an intermediary corporate entity in a third country contributing to the ‘deepening’ of the corporate organization, through sequencing and partitioning layers of intermediating corporate persons operating in OFC jurisdictions. Fourth, the better-known cases of arbitrage invariably implicate intermediating offshore-registered corporate entities. Often, these are usually not the traditional low-tax jurisdictions in island states, but a class of jurisdictions scoring highly on the Tax Justice Network’s corporate tax havens index (TJN, 2019). They include the Netherlands, Switzerland, Luxembourg, Singapore, Hong Kong, Ireland, and Cyprus, all of which are actively seeking to attract regional holding companies (Polak, 2010).
Related Research Challenges
Whereas some broad characteristics of corporate arbitraging structures are known, such transfers are difficult to detect in a MNE’s consolidated accounts. Firms rarely volunteer information on their corporate equity arrangement, let alone their subsidiary structures. Group corporate ecologies comprise of legal persons often numbering in the hundreds or even thousands. Current regulations do not require global firms to divulge their constitutive legal structures, let alone make their corporate ‘step books’ available to the public or to regulatory bodies.4 Many do not list any of their subsidiaries below a certain threshold (Flower, 2016; Leuz and Wysocki, 2016; Meek et al., 1995), and consider any information on the precise motivation for the establishment of corporate subsidiaries, including OFC-registered subsidiaries, commercial secrets that must be kept for reasons of competition. To date, there are no credible methods for identifying or even providing rough estimates of the size of the phenomenon of tax jurisdiction arbitrage.
One (underdeveloped) approach in comparative macroeconomic analysis of profit shifting centres focuses on the number of intermediating companies in groups (Desai et al., 2006). The more common approach, however, focuses on the number and location of OFC-registered subsidiaries of corporate groups for the simple reason that these jurisdictions levy either low or zero corporate taxes on entities registered in their territories. These data, compiled in the Orbis database, are extensively used by researchers to identify and collate the number of OFC subsidiary entities of corporate groups (Cobham and Janský, 2018; Haberly and Wójcik, 2015; Hines, 1988; Kalemli-Ozcan et al., 2015; Ribeiro, et al., 2010; Zucman, 2015). Among those, two studies have sought to analyse microdata data relating to OFC-based intermediaries (Garcia-Bernardo et al., 2017a; Nakamoto et al., 2019). Economists and economic geographers have developed sophisticated triangulation techniques to calculate the global impact of corporate profit shifting (Clausing, 2016; Cobham and Janský, 2018; Dowd et al., 2017; Garcia-Bernardo et al., 2017b; Gordon, 2016; Gumpert et al., 2016; Hines, 1988; Hines and Rice, 1994; Kaye, 2014; Phillips et al., 2017; Tørsløv et al., 2018).
The problem with these approaches is that not all OFC-registered corporate entities are set up as part of tax planning schemes.5 Furthermore, even among those that are set up for tax purposes, only those located on a chain of subsidiaries can support jurisdictional arbitrage. The problem is compounded because arbitraging structures take advantage of loopholes and blind spots that arise by arbitraging two or more corporate entities in two or more jurisdictions, hence data on the OFC corporate entities may not reveal the full extent of the effects on arbitrage.
Our approach to this multifaceted set of challenges has three components: First, we introduce improvements to the techniques of mapping the MNE parent–subsidiary equity arrangements. These improvements allow us to account for the corporate entity arrangements of entire groups, spanning thousands of non-financial MNEs. Second, we narrow the research of OFC-registered subsidiaries to a specific type of entities, specifically intermediating OFC entities, which are traceable in our novel equity maps. Third, we partially overcome data problems associated with OFC-registered entities by focusing specifically on the more-readily available data that is emanating from the ‘onshore’-registered subsidiaries linked to the OFC in-betweeners and therefore part of their arbitrage structure, should there be one.
The following section sets up the sequence of steps we took to provide the first estimates of the size and scale of the phenomenon of jurisdictional arbitrage.
AN EQUITY-MAPPING APPROACH TO ANALYSING INTERNATIONAL TAX ARBITRAGE ABILITY IN MNES
Data on MNE Subsidiary Ownership and Control
The concept of jurisdictional arbitrage refers to ‘corporate structures,’ that is two or more corporate entities, embedded in the MNE’s ecology, organized to exploit gaps, loopholes and blind spots in national regulations in order to lower overall corporate taxation. Understanding arbitrage begins with an analysis of the legal structure of firms. The legal structure of firms refers to the organization of corporate holdings and the construction of corporate groups with legal tools including agency, contract and property rights (Blumberg, 1993; Ferran, 1999; Orts, 2013; Robé, 2011). Historically, analysis of ownership patterns has been concerned with shareholder control and its impact on performance and efficiency (Aguilera and Crespi-Cladera, 2016; Chen et al., 2014; Daily and Dollinger, 1992; Powell and Rhee, 2016; Titman, 2017). In contrast, research on the internal corporate architecture of MNEs is in its infancy (Lewellen and Robinson, 2013; UNCTAD, 2015).6
The Orbis database, which contains data from the filing of corporate subsidiaries, is the starting point for our data analysis. We convert the ownership data of multinational and subsidiary organizations provided by Orbis into an equity map of corporate groups using a standard social network (SNA) approach. The structure of information that is described in social network analysis is usually constructed as an ‘adjacency matrix,’ whereby for every node in the graph, the immediate relationships with other nodes are defined. A sequence of adjacent nodes in a graph forms a ‘path’. A sequence that never revisits an edge is called a ‘trail’. In turn, a ‘walk’ is any sequence of adjacent nodes. Every path is a trail, and every trail is a walk (Borgatti et al., 2013; Kurt and Kurt, 2020). SNA uses computer algorithms to ‘walk’ through the sequential paths in the matrix most efficiently. A ‘walking’ algorithm establishes immediate connections from one node (the GUO subsidiary), in our case information on ownership patterns filed by each SCE and provided by Orbis, and then following the sequence of connections in subsequent nodes in a series of iterations.
The Orbis data are far from perfect (Kalemli-Ozcan et al., 2015; Ribeiro, et al., 2010) and requires extensive ‘cleaning’ to verify the precise location of subsidiaries on a corporate chain. Orbis’ database provides ownership relationship data between subsidiaries in a group in two distinct sets of reporting categories: direct ownership levels, and total ownership levels. The data may describe a reporting relationship where corporate entity ‘A’ owns corporate ‘B’ directly, and corporate ‘B’ owns corporate ‘C’ directly. However, it may also contain information about corporate ‘A’ as owning corporate ‘C’ indirectly, therefore misrepresenting the reported total level of ownership (seen below in Figure 1). Over thousands of links between entities on lengthy ownership chains within a group network, such misrepresentations aggregate and can completely distort information about a corporate group. Hence, we clean the data to minimize the level of indirect relationships to only those cases where there is no other direct information available, preserving where relevant the level of total ownership.7 Additionally, we introduce a control measure to find out how long a particular entity has been part of the group within a given configuration of entities, using the accounting years that pertain to the period where there is evidence to confirm the current arrangement in a chain. This is to ensure that no assumptions are made that would include corporate entities and their accounts that were not in fact part of the MNE group during the entire period.

Direct and indirect ownership pattern.
To visualize such equity maps, we use a force-tree algorithm that captures an equity map whole. Force-directed layout algorithms produce graph drawings using social ‘gravity’ as an additional force in force-directed layouts, together with a scaling technique (Perlman, 1985; Tamassia, 2013). Figure 2 is an example of the resulting graph.

An equity map of a global automobile firm manufacturer, mid-2018.
Each dot in Figure 2 represents one subsidiary of the group. The red dot at the centre is the global ultimate owner. The GUO controls some subsidiaries directly, and some indirectly, through a chain of subsidiaries. Directly controlled subsidiaries who, in turn, do not control under subsidiaries, appear graphically near the parent, many forming a cluster. The algorithm pulls the controlled subsidiary down a chain further away from parent, and so a chain of subsidiaries in revealed. Some of those chains reveal a secondary clustering. These clusters may either represent functional divisions in group, different ‘brand’ (as for instance, the Audi brand of Volkswagen would typically be represented as a branch of its own, with some clustering around Audi’s central holding company). The equity map reveals that this automobile firm consists of several organizations (or clusters). The GUO tends to control these clusters through intermediate holding companies, often organised through a chain of subsidiaries. Many of these clusters in turn have their own sub-clusters and all seem to control independent subsidiaries. The result is an ‘equity map’ and provides unique visualization of the relationship and degree of connection between MNE subsidiaries.
As discussed previously, arbitraging structures, such as the one deployed by Apple, or various types of hybrid structures revealed by OECD’s BEPS studies and by independent researchers, involve a chain of subsidiaries, whereby at least one of the intermediary subsidiaries is located in an OFC jurisdiction. The majority of such structures have their intermediaries located in non-traditional OFCs (Cobham and Janský, 2018; Garcia-Bernardo et al., 2017a; Haberly and Wójcik, 2015). We propose, therefore, to narrow our search to only OFC-registered subsidiaries that serve as intermediating entities.
Identifying Stand-Alone Versus In-Betweener MNE Subsidiaries
We differentiate OFC-registered subsidiaries along with their topographical location on corporate chains. Some OFC subsidiaries control no other subsidiaries of the group and form a kind of subsidiary dead end. They constitute stand-alone subsidiaries and would have the following (On – (On –On-On) … Off) signature (Figure 3 below). These entities undoubtedly take advantage of the regulatory environment of their OFC location, including low taxation, but due to their location on corporate chains, they cannot be used for tax arbitraging purposes. One theory is that MNEs probably employ those type of corporate entities in ‘tax neutral’ venues to perform a variety of financial and treasury operations, such as funding, hedging, forex and the like (Chorafas, 1992; Dizkırıcı, 2012; Hong Kong Monetary Authority, 2016; Polak, 2010; Stewart, 2005). As stand-alones, any profits they generate would be subject to taxation once they are repatriated to the parent. If this theory is correct, then the tax savvy MNE would ensure that the majority of its stand-alone OFC subsidiaries would have little or no operating revenues or net income, or alternatively be located under another OFC subsidiary (‘in-betweeners’), or possibly use derivative instruments to reallocate those profits (Clappers and Mac-Lean, 2019; Office, 2011; Schizer, 1999).

A stylized organization of affiliated groups, including two types of offshore entities.
Other OFC subsidiaries are in control of further subsidiaries downstream on a chain of subsidiaries. These OFC subsidiaries are ‘in-betweeners,’ in control of one or more ‘on-shore’ subsidiaries. Their signature on the corporate chain is (On – (On –Off -On) … On). It is likely that most OFC subsidiaries are set up in part to take advantage of low taxes or other unique regulatory incentives offered by OFCs, but only the second type, in-betweeners, can serve, in addition, sophisticated arbitrating purposes (Clark et al., 2015; Garcia-Bernardo et al., 2017a; Zucman, 2014). Stand-alone OFC subsidiaries are not intermediating subsidiaries and therefore unlikely to be a component of arbitrating structures, whereas an in-between subsidiary could potentially serve such purposes because their location on the corporate chains can affect the relationship among subsidiaries in a group.
We collected, cleaned and sorted data points from Orbis for the top 100 non-financial multinational enterprises globally in operating revenues in 2018. Our analysis goes as far as ten subsidiaries deep into the network per firm (see Online Appendix A). To narrow our search into in-between structures, we first generated a list of OFC jurisdictions. Our list of OFCs is based on the Tax Justice Network’s financial secrecy index (TJN, 2018), combined with the top 10 jurisdictions on the Tax Justice Network’s Corporate Tax Havens Index (TJN, 2019). We introduced an additional filter to account only for OFC subsidiaries that control subsidiaries in other jurisdictions. A Dutch holding company that controls other Dutch companies may service the local market and hence potentially is not part of a Netherlands offshore financial centre arbitrage structure. Simply put, when there is a clear reason for an intermediating entity to be in said jurisdiction, it does not count as an in-between entity. We therefore exclude such Dutch holdings from our list of OFCs (see Online Appendix B for discussion of the list of OFCs).
We then separated each group’s OFC-registered entities along those who report controlling other subsidiaries in the group (in-betweeners) and those that do not (stand-alones). This gave us a list of type 1 (stand-alones) and type 2 (in-betweeners) OFC-based subsidiaries held by each of the top 100 non-financial firms in the world in 2018. Column J in Online Appendix A presents the number of ‘standalones’ for each of the top 100 non-financial firms, and column O the number of ‘in-betweeners’ they have set up respectively. It appears to us that both for practical and for policy reasons, the exact number of type 2 subsidiaries that might facilitate jurisdictional arbitrage is less significant. We assume that as with Apple Inc., tax-oriented arbitrating ‘in-betweeners’ are likely to be placed in control over a substantial portion of the group’s operating revenues and net income. It is the portion of a group’s overall operating revenues and net income placed under the ‘control’ of such OFC entities that matter.
For example, a firm may only have one such chain in its group network but place, say, 70% of its overall revenue streams underneath it, whereas another has set up dozens but none of them control more than a few percent of revenues. The greater the portion of the group’s operating revenues and net income that is placed under ‘in-betweener’ control, the greater is the opportunity for tax arbitrage created by the group. The reason being that corporate entities on such chains have rights over the underlying financial assets and the cash flows that derive from entities down the chain. The manifestations of those rights are linked to jurisdictional rules of the intermediating entity, which are governing rights of ownership, utilization, and financial transactions.
To conclude: we are less interested in finding the number of subsidiaries controlled through ‘in-betweener’ subsidiaries. We correlate instead the mapping exercise with financial data derived from the filing of individual subsidiaries to find out, first, the portion of the entire group’s operating revenues and profits controlled by such structures and second, whether or not those ‘in-betweeners’ diverge noticeably from other OFC-registered subsidiaries.
Other Equity-Mapping Steps
To answer these questions meaningfully, we had to introduce another set of controls. Intra-group transactions may be highly episodic or recurring. To account for episodic oscillation, we take an average from the most recent 5-year period for which there is likely to be the best quality data. As of June 2018, this presents the financial years 2012-2016 (e.g. filing information for FY 2016 occurring in the calendar year 2017, the most recent year for which we could expect relative completeness of data. As discussed above, this means we cross-checked to make sure any entities we include from our 2018 sample can be traced back as part of the group accordingly). This entails both a consideration of (A) the relative size of nominal unconsolidated accounting values, relative to those offered by the consolidated GUO parent, and (B) the relation to the total value observable from all listed subsidiaries within the entire group. As context-specificity within a group can play a major role in influencing the amounts that it would be ‘normal’ to see in the accounting data, our investigation begins with a distributional overview to help calibrate what is ‘normal’ as opposed to ‘exceptional’ in the reporting of accounting values by private unconsolidated subsidiaries.
In summary, the results presented here (see Online Appendix A) refer therefore only to entities that meet the following research conditions:
-
1.
They are majority or wholly owned as of June 2018, which is ≥ 50% ownership relative to the parent GUO entity.
-
2.
They are currently held in a particular structural arrangement we can detect and classify.
-
3.
Only the accounting years for which we can confirm from the GUO that they were owned at the requisite threshold are considered, or if an indirect report by the GUO is not available, the maximum period that shareholder records can confirm that the current chain of equity holdings has been in place.
The combined effect of these mitigating measures is giving our estimations a highly conservative bias because restructuring within a group over time may have occurred. However, it is essential to guard against inflated historical values derived from M&A activities. Therefore, shareholder history information is very important for our method.
FINDINGS FROM EQUITY MAPPING
Preliminary Matters
Having resolved the location issue of ‘in-betweeners’, we encountered additional complicating factors important to discuss here before we turn to our main findings, detailed in Online Appendix A. One serious issue in comparative research using equity mapping is coverage: the Orbis database does not provide full accounting information on every subsidiary in a group. This is particularly the case regarding OFC-registered subsidiaries. Some of these data issues can be overcome because data from ‘onshore’ jurisdictions controlled by those ‘in-betweeners’ tend to be of higher quality. We can tell therefore in principle the value of operating revenues and net income generated collectively by entities under the control of in-betweeners and compare it with the MNE group’s consolidated data to find the portion of the group’s overall operating revenues and net income located under the control of those in-betweeners.
To give one example, when data provided by each subsidiary are aggregated, then in the case of the Walmart group with an annual turnover of US$500 billion, we can account for only 22.64% of the parent’s operating revenues and 22.98% of the parent’s net income as a percentage of the parents’ consolidated accounts. The fourth largest group, the Toyota Motor Corp., with $US240 billion in annual turnover, totalling up all the ‘visible’ corporate subsidiary accounts amounts to 76.84%, and 42.86% of the group’s reported consolidated operating revenues and net income. The rest are located presumably in entities that either do not file annual accounts, or in entities where their filings are not made available publicly. We therefore provide a ‘visibility’ index for each group and each accounting categories. The index tells us the portion of the consolidated figures (for each accounting category) that is ‘visible’ (that is, available on Orbis). We consider a visibility index figure of less than 50% too low to support meaningful interpretation.
The visibility index raises an additional complicating factor. For instance, the visibility index shows that we can account on Orbis for 110.4% of Royal Dutch’s operating revenues and 776.06% of its net income. This is not a one-off anomaly. We can account for 101.01% of Volkswagen’s operating revenue and − 46.92% of the groups’ net income. In other words, even with limited ‘visibility,’ aggregated figures from subsidiaries may reach above 100% of the group’s reported consolidated figure for the same accounting categories. Such anomalies arise out of the system of consolidated accounting that is used by these groups. Consolidated accounts are guided by a complex set of accounting rules and guidelines as instructed by the GUO’s home country (Rosenbloom, 2002). Considering that most firms would include a degree of intra-firm transfers of operating revenues and/or net income in their filings, aggregated operating revenues or net income can reach above 100% of the value declared by the GUO in the same accounting categories as is the case of Royal Dutch Shell and Volkswagen. Indeed, 31 firms in our sample return a 100% or above visibility index for their operating revenues accounting category. Those firms appear to be engaged in higher-than-average intra-group transfers. Whereas the accounts imply that a group like Volkswagen, for instance, generates most of its net income in entities that are ‘invisible’ on Orbis.
The visibility index compares, in other words, what may be described as a ‘pre-consolidated value’, or aggregated values generated at the entity level, which we then compare with the reported consolidated accounts. There is, as far as we can tell, no known standard for a normal rate of intra-firm transfers and hence no benchmark against that one can compare pre-consolidation indexes among MNEs. However, as far as we can tell, in the majority of the cases, the pre-consolidation values and invisibility index do not detract from reaching certain conclusions about the MNEs’ behaviour. Let us take the example of the 8th group on our list, Exxon Mobil Corp., with an annual turnover of US$237 billion a year within which 57.04% of operating revenues and 60.5% of net income is ‘visible.’ Although the group has established 58 stand-alone offshore entities, combined, they present 0% of the ‘visible’ operating revenues and net income of the group; yet 35.84% of its ‘visible’ operating revenues and 34.12% of visible net income is placed under the control of its in-betweeners (Exxon maintains a relatively high ‘in-betweeners’ count of 30). Considering that we can observe overall only 57.04% of the group’s operating revenues and 60.5% of net income, of those, 62.79% (column Q) and 57.17% (column S) respectively, are placed under the control of ‘in-betweeners.’ Such figures are substantial enough, we argue, to warrant an informed interpretation of the firm’s behaviour.
Again, as with the visibility index, the cut-off line is an artificial line we chose within our research design and not based on existing industry regulations, but we consider any figure above 50% pre-consolidation to offer a reasonable level of ‘visibility.’ Second and related, we had to ask what the ‘pre-consolidated value’ above which the figures will be considered sufficient to warrant meaningful interpretation is. Again, we believe that a figure of 50% represents a reasonable level of pre-consolidated value to sustain an interpretation. We consider, therefore, only cases that comply with the following criteria to be sufficiently robust:
-
1.
The nominal value of the pre-consolidation index for a subgroup must be greater than 50% of the consolidated value reported by the parent.
-
2.
The nominal value of the pre-consolidation index for a subgroup must be greater than 50% of the total of observable values reported from all subsidiaries in the group.
-
3.
The pre-consolidation index value for all subsidiaries must itself be greater than the median level reported from across the 100-firms sample.
These criteria are conservative by design. They limit the total incidence rate of positive identifications to only half of the corporate groups. This is to limit considerations to only cases where there is an ‘above average’ level of reporting: and thus to only those cases in which we are most able to isolate where in the corporate group most of the accounting values reported publicly by the parent company will likely come from. Only in these cases do we then concern ourselves with testing the further question of whether the unconsolidated accounting values reach magnitudes that would suggest most value reported by the parent is attributable to a particular subset of subsidiaries.
Main Findings
We now turn to our main findings, which are listed in detail in Online Appendix A and also discussed and summarized in the text and series of figures below as well as in the conclusion.
The top 100 non-financial firms have established between them 73,864 subsidiaries as of 2018. Among these, 6219 (or nearly 8.4% of the subsidiary corporate entities of the top 100 non-financial firms in the world) were located in OFC jurisdictions. Most of the firms in our sample, 84% to be exact, have established many more ‘stand-alone’ OFC entities than ‘in-betweeners’. We exclude the cases were an OFC holding controls another entity in the same jurisdictions (as described in Online Appendix B, because these may serve the local market). Once those entities are excluded, the number of OFC subsidiaries held by the top 100 non-financial firms stands at 4371, or nearly 6.4% of the total, of which 3014 (or about 4%) are ‘stand-alones’ while 1257 (or 1.7%) are in-betweeners.
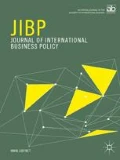
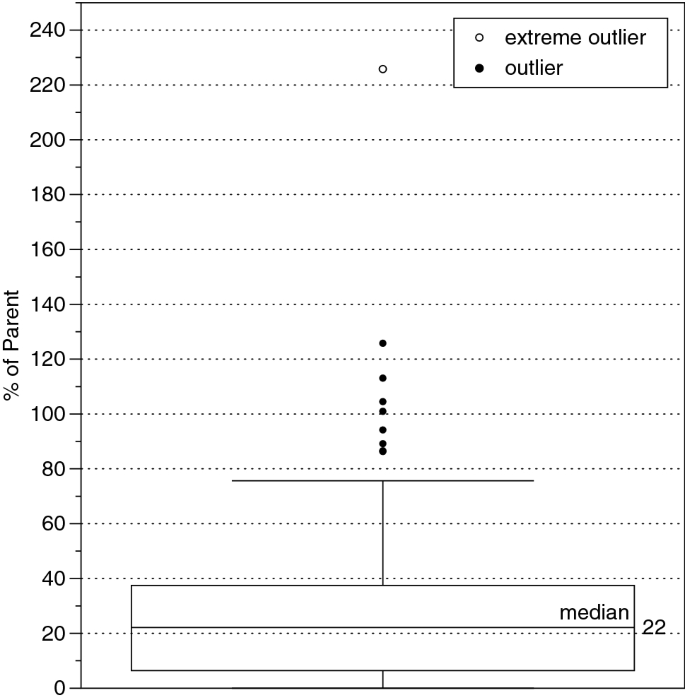
Those 1.7% ‘in-betweeners’ were overall ‘in control’ of 6208 subsidiaries in chains below them within the MNE’s subsidiary network structure. In other words, nearly 8.4% of the subsidiaries of the top 100 non-financial firms were controlled by ‘in-betweeners.’ Quite a few firms in our sample set up only one or two ‘in-betweeners,’ and placed them in control of a negligent portion of the group’s revenue. However, overall, the median scale of pre-consolidated index value for in-betweener entities for those 8.4% entities has been 66% of operating revenues and 40% of net income of the entire MNE group’s overall operating revenues and net income (see Figures 4 and 5).
In-betweener OFCs and their subsidiary holdings: 5-year mean of operating revenues (2012–2016).
In-betweener OFCs and their subsidiary holdings: 5-year mean of net income (2012–2016).
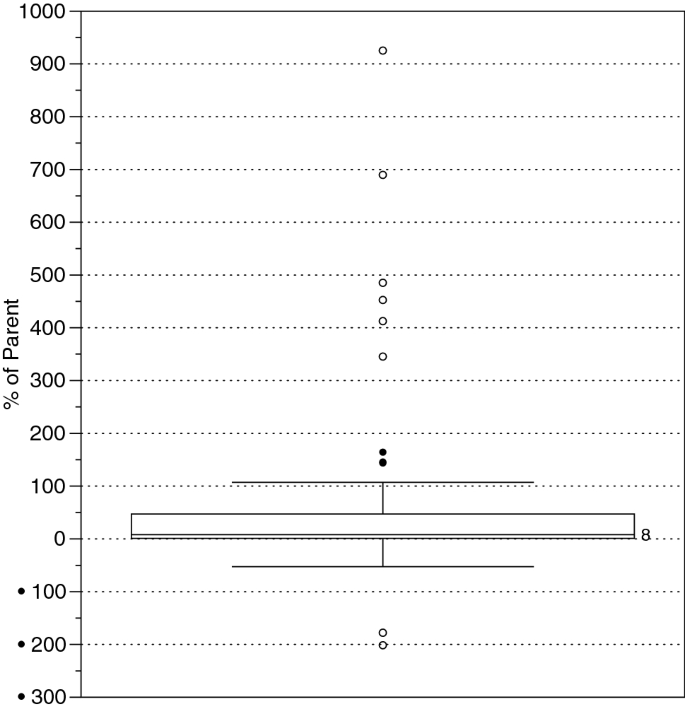
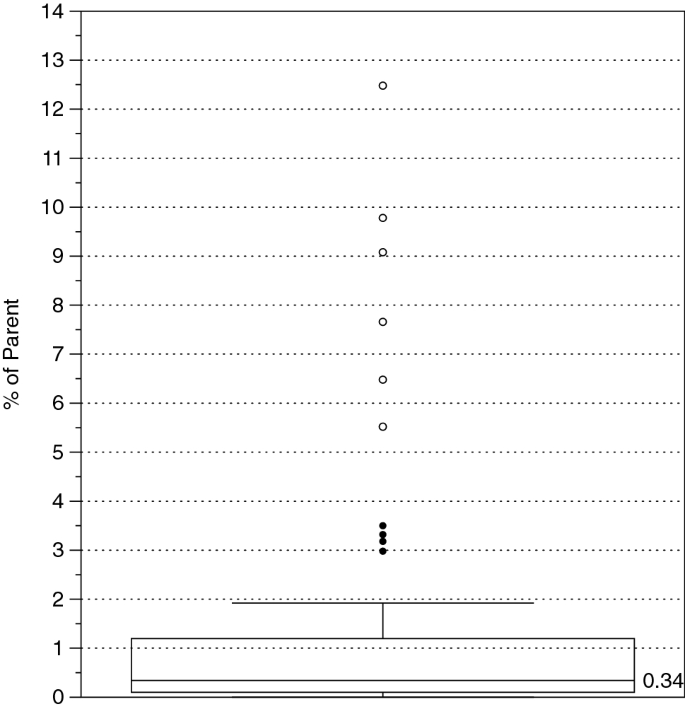
Figures 4, 5, 6, 7, and 8 present the distribution of descriptive results for all 100 non-financial corporate groups in the study. Results are presented as a box-whisker plot which describes the median, the inner quartile range (IQR) and outliers within a distribution. The IQR is the difference between the first and third quartile or the central 50% of observations (the coloured rectangle in each figure). The whiskers describe the extent of other observed values that are not statistical non-outliers. Outliers appear as dots. Black dots are defined as values more than 1.5 times the standard deviation. Extreme outliers appear as clear dots and are defined as values more than three times the standard deviation. In Figures 4, 5, 6, and 7, results describe the value of the financial reporting on net income or operating revenues for either the subset of subsidiaries held by in-betweener OFCs or stand-alone OFCs themselves. These values were calculated by aggregating the historical reporting available for the subsidiaries in question and expressing those values as a percentage of the same values being reported by the respective parent’s consolidated (total) over the same 5-year period. Figure 8 in turn presents the same calculations but for all current subsidiaries within a respective corporate group.
Stand-alone OFCs: 5-year mean of operating revenues (2012–2016).

Stand-alone OFCS: 5-year mean of net income (2012–2016).

Value of observable operating revenues and net income as a percentage of parent totals (2012–2016).
In light of the complicating factors with the data discussed in the previous section, column T in Online Appendix A identifies those firms where evidence best suggests that the majority (i.e. greater than 50%) of either the parent’s operating income or net income is placed under the control of subsidiaries incorporated in OFC jurisdictions. We applied this test for stand-alones and in-betweeners, and both operating income and net income pre-consolidation index values. We indicate cases where all three criteria were met as ‘true’ in Online Appendix A, column T. The results were true for 24 of the MNEs in the top 100. These positive results are cases where the majority of the MNE’s value is controlled through OFC-based ‘in-betweener’ holding group structures. Given that we artificially restricted our concerns to only half of the sample where the data were best and most complete, and that we then set our targets only in those cases where most values in a group appear to be placed under the control of OFC-based subsidiaries, the results suggest an unexpectedly high rate of positive incidences (i.e. 48% of the total of positive findings) when there might be many more were our controls less stringent.
Considering that the literature on aggressive tax planning has identified many ATP schemes that have ‘in-betweeners’ among them, these findings are not surprising. Yet they are worrying. They show that, whether they make use of them or intend to do so, many of the top 100 non-financial firms have created what are in effect ‘opportunity spaces’ for aggressive tax avoidance. Furthermore, they have placed those structures strategically in control of a considerable portion of the respective group’s operating revenues and net income.
Additional Findings
The study focused on a specific set of structures embedded in the corporate ecology that can serve as ‘opportunity spaces’ for tax arbitrage. Beyond those, our findings and data point to additional issues that may warrant further research.
First, as mentioned above, most OFC-registered subsidiaries are stand-alones. We found that in nearly all observable cases, the pre-consolidated value of stand-alone OFCs was a small fraction (less than 10% and typically less than 5%) of the pre-consolidated values under the control of ‘in-betweeners’. The portfolio holdings of OFC entities reveal median observations of only 0.26% and 0.08%, respectively (see Figures 5 and 6). The majority (75%) of stand-alones registered a pre-consolidated index that is equal to only 1% of the consolidated parent. These findings come with an important caveat that financial data on OFC-registered entities is generally poor. Yet, such a marked difference between the values associated with standalones and in-betweeners is too vast to be dismissed. It suggests that as a group, the stand-alones are unlikely to be engaged in significant transfer pricing and may be used, as the literature suggests, for specialized treasury operations functions such as funding, investment vehicles, cash holdings or hedging (Polak et al., 2011).
Secondly, despite the general impression of growing transparency due to the tightening of national and international regulations, the world of corporate filings remains highly opaque. As we saw above, there are nearly no available financial data at the subsidiary level for around a dozen of our cases (13% of the top 100 non-financial firms in the world). Aggregation of subsidiary reporting of operating revenues reaches values similar to the consolidated reporting in less than 50% of those companies. For the rest, considerable portions of their operating revenues and net income are locked in subsidiaries that are not required to file annual accounts at all or are in jurisdictions that do not reveal those accounts except possibly to their national financial regulators.8 These findings correlate with other in-depth studies of financial transparency such as the financial secrecy index 2018 (FSI 2018) – suggesting that opacity is still rife.
Third, we note, as alluded to above, that pre-consolidated indexes vary from one corporate group to another, and furthermore that the pre-consolidated indexes for operating revenues and net income diverge across the board. The median level of a pre-consolidated index of 66% of operating revenues compares with a pre-consolidated index of only 32% for net income (Figures 7 and 8). The aggregated median operating revenues reported by subsidiaries of the top 100 non-financial firms amount to 66% of the operating revenues reported by the same groups in their consolidated accounts. The median aggregate net income reported by subsidiaries is only 32% of the reported consolidated revenues of the same firms. Either coincidentally or by intent, a greater portion of these firms’ operating revenues is in jurisdictions that make the filings available, compared to the reported net income.
NOTES
One explanation for the divergence seen in the above Figures 7 and 8 between the two values across the board is that operating revenues are likely to be generated in large market economies, where annual filings are normally available (except for the US, hence the median is less than 100%). Whereas, according to the profit shifting literature, a higher portion of profits is reported in OFCs, which rarely make those filings available. This finding seems to correlate broadly with the findings of profit-shifting research.
An alternative explanation is that would-be profit-shifting firms are likely to have a greater interest in ensuring that a smaller portion of their profits data are subject to public scrutiny as opposed to their operating revenues, so the divergence in median values for the two pre-consolidated indexes may be significant. There could be specific case-by-case reasons for such divergence, but the size of our sample of the largest 100 industrial firms in the world is a strong sign that opacity may not be distributed randomly. The divergence in those pre-consolidated accounts is unlikely to be coincidental and may be the product of meticulous planning – a point that has not been acknowledged, let alone discussed, so far in the literature, but one merits additional research. The implications are that when comparing those values among groups, we are comparing apples with pears. Yet, it is useful to know the extent to which arbitrating structures are used among the group of top 100 non-financial MNEs.
CONCLUSION
Central Research Aims and Key Findings
This paper presents the first comparative empirical examination of the portion of a MNE group’s operating revenues and net income controlled by intermediating offshore subsidiaries (‘in-betweeners’). Described sometimes as intermediating holding companies, tax experts suggest that such structures offer a variety of opportunities for tax arbitrage. To date, the scale of the phenomenon of the use of those ‘in-betweener’ OFCs was unknown. Our analysis suggests that about a quarter of OFC-registered subsidiaries of large MNEs create the conditions that facilitate tax arbitrage, or what we call ‘opportunity spaces’ for tax arbitrage. Despite their relatively low number, this study confirms that at least among the top 100 non-financial, non-state-owned global MNEs in the world, such structures are often placed in control of large proportions of these groups’ operating revenues and net income. The greater the portion of a group’s operating revenues controlled by such structures, the more opportunities they have for tax arbitrage. We identify in Online Appendix A those firms that are heavy users of such structures.
By differentiating OFC subsidiaries along their topographical location on corporate chains, this study is able to lend support, therefore, to the many macroeconomic studies of profit shifting, but also, paradoxically, to the often-heard argument that OFC subsidiaries are used as ‘tax-neutral’ locations. The majority of enterprises, the standalones, undoubtedly benefit from the low-taxation environment provided by an OFC. Simply counting the number of OFC subsidiaries is mistaken. Under rules of most countries, any tax savings produced by those standalones is eliminated once funds are repatriated to the parent. One theory is that MNEs probably employ those types of corporate entities in ‘tax-neutral’ venues to perform a variety of financial and treasury operations, such as funding, hedging, forex and the like. If the theory is correct, then the majority of stand-alone OFC subsidiaries would have little or no operating revenues or net income – and that is exactly what this study found. The evidence presented in this paper suggests, therefore, that most probably the majority of corporate OFCs are chosen for tax-neutrality reasons, but a significant minority, those ‘in-betweeners,’ play a different role in corporate planning and are placed, therefore, in control of high proportions of a group’s operating revenues, a position which can be used for tax arbitrage.
Implications for IB and Related Policy Research and Practice
This study demonstrates that a key factor determining tax arbitrage is not the amount of value registered on OFC subsidiaries’ balance sheets, but rather the portion of the group’s operating revenues and net income controlled by OFC subsidiaries. Policymakers and the academic community should pay greater attention to the organizational structure and layering of corporate investment through diverse jurisdictions. There is extensive literature discussing the economic, managerial and normative foundations of location and corporate investment (Welch and Welch, 1996; Buckley and Ghauri, 1999; Cohen, 2007; Aguilera and Crespi-Cladera, 2016). Less is known about the choices of pathways of investment and, in particular, the layering of those investments through chains of subsidiaries. However, as we argue in this paper, the legal structure of the subsidiaries, which involves strategic tax planning, is an essential dimension of competitive business enterprise in today’s world. Conversely, the organization of corporate entities along chains of subsidiaries, and the location of vital economic and accounting data among the different components of the group, offer vital clues into corporate strategies. Whereas consolidated accounts are important for comparative research, this study shows that data at the subgroup level are also important. Equity mapping could therefore open an entirely new and fruitful avenue for IB research.
Such perspective requires a different way of thinking about policy from a world that is focused on states and corporate entities seen in isolation, to a policy that is aimed at identifying and countering relationships among entities and jurisdictions within firm networks. Here lies a promising opportunity for IB research to engage in interdisciplinary research with public policy, governance and other social sciences to further acknowledge the significant role that MNE’s play in the global and national society and reconsider how to regulate it. This article advances organizational theory into MNEs and global regulatory policy; and future research should concern itself with details into how regulation can become more effective, of course without becoming overbearing or diminishing the opportunities that lie in a global market.
Research Limitations and Future Directions
Equity-mapping research is in its infancy, but already some important limitations are noticeable, several of which were discussed in this article. Financial and accounting data derive from corporate filings, which, particularly from entities located in the US or in OFCs, is often limited. This proved less of a problem for this study, which focused on accounting data generated from corporate entities that are controlled by ‘in-betweeners’, and the majority of those were located in jurisdictions that both demands and provide access to the data. Nonetheless, some of the firms in our sample did not reach either a visibility index or pre-consolidated index of 50% and above. Whether or not those firms have chosen purposely to relocate large proportions of their operating revenues to less transparent jurisdictions could be a subject of further research. Overall, the anecdotal evidence gathered by this study suggests that, among other things, firms ‘arbitrage’ rules of transparency as well.
This study lends support to a growing consensus among academics and regulators alike about the dangers of profit shifting. For the time being, however, equity-mapping research can only point to the location of opportunity spaces for tax arbitrage. Quantitative estimation of profit-shifting and tax arbitrage would most probably require the development of mixed methodologies, combining equity mapping with more traditional methods of research.
While much of the previous decades has seen regulators and researchers focused on geographical and legal structuring of entities in paying tax, attention must now turn to the organizational structure of MNEs. Equity mapping provides a useful pathway to both analyse existing data and find new patterns of entity structure. Despite the acknowledged difficulties in such research, it will be a fruitful method for further study.
NOTES
-
1
Accounting categories such as revenues, profit and the like, are notoriously difficult because their precise meaning and definition may vary from one jurisdiction to another. In this article, we use categories of ‘operating revenues’ and ‘net income’ as provided by the Orbis database. The accounting category of operating revenues would usually, but not always, mean net sales.
-
2
The concept of tax arbitrage is used extensively in legal literature. In the words of Karayan et al.,: ‘tax arbitrage is typically behind artificial transfer pricing schemes, that is, using accounting entries to shift profits to jurisdictions that impose the lowest net taxes’ (Karayan et al., 2002: xix). It ‘enable[s] (the taxpayer..) to elect the less comprehensive tax base or the one with the more lenient anti-abuse rules’ (HJI Panayi, 2011: 11).
-
3
This is true in principle, although certain anti-abuse rules, like the Controlled Company Rules (CFC) that was introduced by the US in the early 1960s, and then adopted with a number of variations by other countries, require some members of the group to be treated collectively as one taxpayer. See: (Dueñas, 2019; HJI Panayi, 2011; Lokken, 2005; Sandler, 1998).
-
4
‘Step book’ is a term used by lawyers and accountants to describe the internal memos or reports provided by accountants or legal teams presenting corporate charts and establishing the rationale for the organization of a set of new corporate entities in a chain. The famous Luxleak files contain separate files of over 300 MNEs, each with their partial step book of the Luxembourgish component of a proposed structure to be reviewed by the Luxembourg tax authority.
-
5
As one of the leading experts on corporate profit shifting practices acknowledges: ‘Multinational corporations routinely use tax havens for treasury operations and group insurance. Some of these activities have legitimate roles’ (Zucman, 2013: 13).
-
6
This research had been the preserve of specialist due diligence firms that develop schematic representations of firm equity architecture using a variety of sources, including where available access to the firms’ step books, and manually cross-check information (Peppitt, 2008). The focus of this research had been so far practical, driven by the challenges and expense of accessing data. As a result, there has not been a substantial theoretical or methodological discussion of the challenges presented by corporate equity mapping research (Broe, 2008; Mintz, 2004).
-
7
Sometimes, it is impossible for there to be a complete direct ownership chain connecting one reporting entity to another. This can occur for instance when foreign firms list on the US stock market via the use of American depository receipts (ADRs). Here, the legal entity itself is not created in a particular state with shareholdings that connect the entity directly to a foreign owner. Rather, it is an entity created for listing purposes, such as when Toyota Motor Corp. lists on a US stock exchange. These mechanisms were created to allow foreign entities the ability to list on the US stock market without the potential constraints that may come with US purchasers buying shares in foreign countries. The listed entity, in this case, is a distinct entity given the rules of how that particular securities market works, the ADR representing the accounting values allocated to that listed entity. This illustrates how indirect reports may not always signify the invisibility of a third-party entity in between.
-
8
Net income can be negative as well as positive, and in extreme cases, may represent large pools of re-distributable profits, or large stocks of ‘losses’, illustrating how the construction of losses (‘loss-shifting’ so to speak) can itself be part of how value is managed within a corporate group.
REFERENCES
Adriano, E.A.Q. 2015. The natural person, legal entity or juridical person and juridical personality. International Affairs, 30.
Aguilera, R. V., Crespi-Cladera, R. 2016. Global corporate governance: On the relevance of firms’ ownership structure. Journal of World Business, The World of Global Business, 1965-2015(51), 50–57. https://doi.org/10.1016/j.jwb.2015.10.003
Alchian, A. A., & Demsetz, H. 1972. Production, information costs, and economic organization. The American Economic Review, 62: 777–795.
Allen, D. 2005. Transaction costs. In D. Clark (Ed), Encyclopaedia of Law and Society: American and Global Perspectives: 893–916. London: Sage.
Atwood, T. J., Drake, M. S., Myers, J. N., & Myers, L. A. 2012. Home country tax system characteristics and corporate tax avoidance: International evidence. The Accounting Review, 87: 1831–1860. https://doi.org/10.2308/accr-50222
Avi-Yonah, R. S. 2019. Globalization, Tax Competition and the Fiscal Crisis of the Welfare State: A Twentieth Anniversary Retrospective. Presented at the Taxation and Globalization, IDC, Herzliya.
Avi-Yonah, R. S. 2005. All of a piece throughout: The four ages of U.S. International Taxation. SSRN Electronic Journal. https://doi.org/10.2139/ssrn.742525
Avi-Yonah, R. S., Clausing, K. A., & Durst, M. C. 2008. Allocating business profits for tax purposes: A proposal to adopt a formulary profit split. Florida Tax Revenue, 9: 497.
Avi-Yonah, R. S., & Panayi, C. H. n.d. RETHINKING TREATY-SHOPPING LESSONS FOR THE EUROPEAN UNION 32.
Avraham, D., Selvaggi, P., & Vickery, J. I. 2012. A Structural View of U.S. Bank Holding Companies (SSRN Scholarly Paper No. ID 2118036). Social Science Research Network, Rochester, NY.
Barrera, R., Bustamante, J. 2018. The rotten apple: Tax avoidance in Ireland. The International Trade Journal, 32: 150–161. https://doi.org/10.1080/08853908.2017.1356250
Birkinshaw, J. M., Morrison, A. J. 1995. Configurations of strategy and structure in subsidiaries of multinational corporations. Journal of International Business and Studies, 26: 729–753. https://doi.org/10.1057/palgrave.jibs.8490818
Blumberg, P. I. 1993. The Multinational Challenge to Corporation Law: The Search for a New Corporate Personality. Oxford: Oxford University Press.
Borgatti, S. P., Everett, M. G., & Johnson, J. C. 2013. Analyzing Social Networks. Thousand Oaks: Sage.
Boudreaux, D. D., & Holcombe, R. G. 1989. The Coasian and Knightian theories of the firm. Managerial and Decision Economics, 10: 147–154.
Broe, L. D. 2008. International Tax Planning and Prevention of Abuse: A Study Under Domestic Tax Law, Tax Treaties, and EC Law in Relation to Conduit and Base Companies. IBFD.
Brossart, Robert T. 2010. Tax Due Diligence. In A. H. Rosenbloom (Ed), Due Diligence for Global Deal Making: The Definitive Guide to Cross-Border Mergers and Acquisitions, Joint Ventures, Financings, and Strategic Alliances. New Yok: Wiley.
Buckley, P. J., & Ghauri, P. N. 1999. The Internationalization of the Firm. Cengage Learning EMEA.
Buckley, P. J., Sutherland, D., Voss, H., El-Gohari, A. 2015. The economic geography of offshore incorporation in tax havens and offshore financial centres: The case of Chinese MNEs. Journal of Economics Geography, 15: 103–128. https://doi.org/10.1093/jeg/lbt040
Chen, V. Z., Li, J., Shapiro, D. M., Zhang, X. 2014. Ownership structure and innovation: An emerging market perspective. Asia Pacific Journal of Management, 31: 1–24. https://doi.org/10.1007/s10490-013-9357-5
Chorafas, D. N. 1992. Treasury Operations and the Foreign Exchange Challenge: A Guide to Risk Management Strategies for the New World Markets. New York: Wiley.
Clappers, T., Mac-Lean, P. 2019. Tax avoidance in the Spotlight: The EU mandatory disclosure rules and their impact on asset managers and private equity. Derivatives & Financial Instruments, 21.
Clark, G. L., Lai, K. P. Y., Wójcik, D. 2015. Editorial Introduction to the special Section: Deconstructing Offshore Finance. Economic Geography, 91: 237–249. https://doi.org/10.1111/ecge.12098
Clausing, K. A. 2016. The Effect of Profit Shifting on the Corporate Tax Base in the United States and Beyond (SSRN Scholarly Paper No. ID 2685442). Rochester, NY: Social Science Research Network.
Cobham, A., & Janský, P. 2018. Global distribution of revenue loss from corporate tax avoidance: Re-estimation and country results. Journal of International Development, 30: 206–232. https://doi.org/10.1002/jid.3348
Cohen, S. D. 2007. Multinational Corporations and Foreign Direct Investment: Avoiding Simplicity, Embracing Complexity. Oxford: Oxford University Press.
Coyle, D. 2017. Multinationals turn from ‘Double Irish’ to ‘Single Malt’ to avoid tax in Ireland [WWW Document]. The Irish Times. https://www.irishtimes.com/business/economy/multinationals-turn-from-double-irish-to-single-malt-to-avoid-tax-in-ireland-1.3290649. Accessed May 28.
Daily, C. M., & Dollinger, M. J. 1992. An empirical examination of ownership structure in family and professionally managed firms. Family Business Review, 5: 117–136. https://doi.org/10.1111/j.1741-6248.1992.00117.x
Damgaard, J., Elkjaer, T., & Johannesen, N. 2019. Empty corporate shells in tax havens undermine tax collection in advanced, emerging market, and developing economies. Finance & Development, 3.
Darby, J. B., & Lemaster, K. 2007. Double Irish more than double the tax savings: Hybrid structure reduces Irish, U.S. and Worldwide Taxation. Practical US/International Tax Strategies, 11: 11–16.
Demsetz, H. 1997. The Economics of the Business Firm: Seven Critical Commentaries. Cambridge: Cambridge University Press.
Demsetz, H. 1988. The theory of the firm revisited. Journal of Law, Economics, & Organization, 4: 141–161.
Demsetz, H., & Lehn, K., 1985. The structure of corporate ownership: Causes and consequences. Journal of Political Economy, 93: 1155–1177. https://doi.org/10.1086/261354
Desai, M. A., Foley, C. F., & Hines, J. R. 2006. The demand for tax haven operations. Journal of Public Economics, Special issue published in cooperation with the National Bureau of Economic Research: Proceedings of the Trans-Atlantic Public Economics Seminar on Fiscal Federalism 20–22 May 2004 , 90: 513–531. https://doi.org/10.1016/j.jpubeco.2005.04.004
Dizkırıcı, A. S. 2012. Comparison of Istanbul with Hong Kong and Singapore for Regional Treasury Centers. İşletme Araştırmaları Dergisi, 4: 31–44.
Dorfmüller, P., Endres, D., & Schreiber, C. 2006. Holding companies are key international tax planning tool—International Bureau of Fiscal Documentation. International Tax Review.
Dowd, T., Landefeld, P., & Moore, A. 2017. Profit shifting of U.S. multinationals. Journal of Public Economics, 148: 1–13. https://doi.org/10.1016/j.jpubeco.2017.02.005
Dueñas, S. 2019. CFC Rules Around the World.
Dyreng, S. D., & Lindsey, B. P. 2009. Using financial accounting data to examine the effect of foreign operations located in tax havens and other countries on U.S. multinational firms’ tax rates. Journal of Accounting Research, 47: 1283–1316. https://doi.org/10.1111/j.1475-679X.2009.00346.x
Eicke, R. 2009. Tax Planning with Holding Companies - Repatriation of US Profits from Europe: Concepts, Strategies, Structures. Kluwer Law International B.V.
European Commission. 2016. COMMISSION DECISION of 30.8.2016 ON STATE AID SA.38373 (2014/C) (ex 2014/NN) (ex 2014/CP) implemented by Ireland to Apple (Decision No. C(2016) 5605 final).
Fama, E. F. 1980. Agency problems and the theory of the firm. Journal of Political Economy, 88: 288–307. https://doi.org/10.1086/260866
Ferran, E. 1999. Company Law and Corporate Finance. Oxford: Oxford University Press.
Flower, J. 2016. European Financial Reporting: Adapting to a Changing World. Cham: Springer.
Forte, R. P. 2016. Multinational firms and host country market structure: A review of empirical literature. The Journal of International Trade & Economic Development, 25: 240–265. https://doi.org/10.1080/09638199.2015.1049198
Garcia-Bernardo, J., Fichtner, J., Takes, F. W., & Heemskerk, E. M. 2017a. Uncovering offshore financial centers: Conduits and sinks in the global corporate ownership network. Scientific Reports, 7: 6246. https://doi.org/10.1038/s41598-017-06322-9
Garcia-Bernardo, J., Fichtner, J., Takes, F. W., & Heemskerk, E. M. 2017b. Uncovering offshore financial centers: Conduits and sinks in the global corporate ownership network. Scientific Reports, 7: 6246. https://doi.org/10.1038/s41598-017-06322-9
Gordon, R. 2016. Increasing use of tax-transparent entities by private groups due to BEPS. Tax Specialist, 19: 136.
Graetz, M. J. 2016. Follow the Money: Essays on International Taxation - Introduction (SSRN Scholarly Paper No. ID 2784804). Rochester, NY: Social Science Research Network.
Greenfeld, L. 1992. Nationalism: Five Roads to Modernity. Cambridge: Harvard University Press.
Greggi, M. 2019. Transfer Pricing and Tax Law – BEPS Actions 8, 9, 10 and the Italian System: an Assessment. In W.W. Kraft, A. Striegel (Eds), WCLF Tax und IP Gesprächsband 2017: Immaterielle Werte als Zentrale Komponente internationaler Steuerstrategien: 205–220. Wiesbaden: Springer. https://doi.org/10.1007/978-3-658-24953-3_14
Grossman, S. J., & Hart, O. D. 1986. The costs and benefits of ownership: A theory of vertical and lateral integration. Journal of Political Economy, 94: 691–719. https://doi.org/10.1086/261404
Grubert, H., & Mutti, J. 1991. Taxes, tariffs and transfer pricing in multinational corporate decision making. The Review of Economics and Statistics, 73: 285–293.
Gumpert, A., Hines, J. R., & Schnitzer, M. 2016. Multinational firms and tax havens. The Review of Economics and Statistics, 98: 713–727. https://doi.org/10.1162/REST_a_00591
Haberly, D., & Wójcik, D. 2015. Tax havens and the production of offshore FDI: An empirical analysis. Journal of Economics Geography, 15: 75–101. https://doi.org/10.1093/jeg/lbu003
Hadari, Y. 1973. The structure of the private multinational enterprise. Michigan Law Review , 71: 729–806. https://doi.org/10.2307/1287788
Heckemeyer, J. H., Olligs, P., & Overesch, M. 2017. ‘Home Sweet Home’ versus International Tax Planning: Where Do Multinational Firms Hold Their U.S. Trademarks? (SSRN Scholarly Paper No. ID 2927926). Social Science Research Network, Rochester, NY. https://doi.org/10.2139/ssrn.2927926
Helliar, C., & Dunne, T. 2004. Control of the treasury function. Corporate Governance, 4: 34–43. https://doi.org/10.1108/14720700410534958
Hines, J. R. 1988. Taxation and U.S. Multinational Investment. Tax Policy and the Economy, 2: 33–61. https://doi.org/10.1086/tpe.2.20061772
Hines, J. R., & Rice, E. M. 1994. Fiscal paradise: Foreign tax havens and American Business. The Quarterly Journal of Economics 109, 149–182. https://doi.org/10.2307/2118431
HJI Panayi, C. 2011. The Common Consolidated Corporate Tax Base and the UK Tax System (SSRN Scholarly Paper No. ID 1809568). Rochester, NY: Social Science Research Network.
HM Treasury. 2014. Tackling aggressive tax planning in the global economy: UK priorities for the G20/OECD project for countering Base Erosion and Profit Shifting. London: HM Treasury.
Honk Kong Monetary Authority. 2016. Corporate Treasury Centres in Hong Kong Case Studies.
Jensen, M. C., & Meckling, W. H. 1976. Theory of the firm: Managerial behavior, agency costs and ownership structure. Journal of Financial Economics, 3: 305–360. https://doi.org/10.1016/0304-405X(76)90026-X
Johannesen, N. 2014. Tax avoidance with cross-border hybrid instruments. Journal of Public Economics, 112: 40–52. https://doi.org/10.1016/j.jpubeco.2014.01.011
Kalemli-Ozcan, S., Sorensen, B., Villegas-Sanchez, C., Volosovych, V., & Yesiltas, S. 2015. How to Construct Nationally Representative Firm Level data from the ORBIS Global Database (Working Paper No. 21558). National Bureau of Economic Research. https://doi.org/10.3386/w21558
Karamanou, M., Panayiotakopoulos, G., Tsoucalas, G., Kousoulis, A., & Androutsos, G. 2012. From miasmas to germs: A historical approach to theories of infectious disease transmission.
Karayan, J. E., Swenson, C. W., & Neff, J. W. 2002. Strategic Corporate Tax Planning. New York: Wiley.
Kaye, T. A. 2014. The offshore shell game: U.S. Corporate Tax Avoidance through profit shifting. Chap. L. Rev., 18: 185.
Kelly, L., 2015. Looking to the future: Life after the Double Irish. International Tax Review, 26: 56.
Kudrle, R. T. 2009. Did blacklisting hurt the tax havens? Journal of Money Laundering Control, 12: 33–49. https://doi.org/10.1108/13685200910922633
Kurt, Y., & Kurt, M. 2020. Social network analysis in international business research: An assessment of the current state of play and future research directions. International Business Review, 29: 101633. https://doi.org/10.1016/j.ibusrev.2019.101633
Lambooy, T. E., Diepeveen, R. A., Nguyen, K., & Foort, S. van ’t. 2013. The opacity of a multinational company’s organization, legal structure and power. The Dovenschmidt Quarterly, 1: 121–133.
Lesage, D., Lips, W., & Vermeiren, M. 2019. The BRICs and international tax governance: The case of automatic exchange of information. New Political Economy, 0: 1–19. https://doi.org/10.1080/13563467.2019.1584168
Leuz, C., & Wysocki, P. D. 2016. The economics of disclosure and financial reporting regulation: Evidence and suggestions for future research. Journal of Accounting Research, 54: 525–622. https://doi.org/10.1111/1475-679X.12115
Lewellen, K., & Robinson, L. A. 2013. Internal Ownership Structures of U.S. Multinational Firms (SSRN Scholarly Paper No. ID 2273553). Rochester, NY: Social Science Research Network. https://doi.org/10.2139/ssrn.2273553
Lokken, L. 2005. Whatever happened to Subpart F - U.S. CFC Legislation after the Check-the-Box Regulations. Florida Tax Revenue, 7: 185.
Loomis, S. C. 2011. The Double Irish Sandwich: Reforming Overseas Tax Havens.
Loretz, S., Sellner, R., Brandl, M.-B., Arachi, G., Bucci, V., van’t Riet, M., & Aouragh, A.. 2017. Aggressive tax planning indicators; Final Report [WWW Document]. Taxation Papers - Working Paper. https://doi.org/10.2778/847061. Accessed January 14.
Marian, O. 2013. Jurisdiction to tax corporations. Bosten College Law Review, 54: 1613.
Matheson, J. H. 2008. The modern law of corporate groups: An empirical study of piercing the corporate veil in the parent-subsidiary context. North Carolina Law Review, 87: 1091.
Meek, G. K., Roberts, C. B., & Gray, S. J. 1995. Factors influencing voluntary annual report disclosures by U.S., U.K. and Continental European Multinational Corporations. Journal of International Business Studies, 26: 555–572. https://doi.org/10.1057/palgrave.jibs.8490186
Miller, D. S. 2011. How U.S. Tax Law Encourages Investment Through Tax Havens. Tax Analysis.
Mintz, J. 2004. Conduit entities: Implications of indirect tax-efficient financing structures for real investment. International Tax and Public Finance, 11: 419–434. https://doi.org/10.1023/B:ITAX.0000033986.95921.99
Nakamoto, T., Chakraborty, A., & Ikeda, Y. 2019. Identification of key companies for international profit shifting in the Global Ownership Network. Applied Netwok Science, 4: 58. https://doi.org/10.1007/s41109-019-0158-8
Nessy, E., & Rahayu, N. 2019. Avoiding Tax using Hybrid Mismatch Arrangement Schemes in Indonesia. Presented at the Asia Pacific Business and Economics Conference (APBEC 2018), Atlantis Press. https://doi.org/10.2991/apbec-18.2019.20
Niehans, J. 1989. Transaction costs. In J. Eatwell, M. Milgate, P. Newman (Eds), Money, The New Palgrave: 320–327. London: Palgrave Macmillan. https://doi.org/10.1007/978-1-349-19804-7_41
OECD. 2013a. Addressing Base Erosion and Profit Shifting | READ online [WWW Document]. OECD iLibrary. https://read.oecd-ilibrary.org/taxation/addressing-base-erosion-and-profit-shifting_9789264192744-en. Accessed April 23.
OECD. 2013b. Global Forum on Transparency and Exchange of Information for Tax Purposes Peer Reviews: Cayman Islands 2013. Paris: Organisation for Economic Co-operation and Development.
OECD. 2012. Hybrid Mismatch Arrangements: Tax Policy and Compliance Issues. Paris: OECD.
OECD. 1998. Harmful Tax Competition An Emerging Global Issue: An Emerging Global Issue. Paris: OECD Publishing.
Office, U.S.G.A. 2011. Financial Derivatives: Disparate Tax Treatment and Information Gaps Create Uncertainty and Potential Abuse.
Orts, E. W. 2013. Business Persons: A Legal Theory of the Firm. Oxford: OUP.
Panayi, C. H. 2015. Advanced Issues in International and European Tax Law. Bloomsbury Publishing.
Panayi, C. H. 2013. European Union Corporate Tax Law. Cambridge: Cambridge University Press.
Panayi, C. H. 2006. Treaty shopping and other tax arbitrage opportunities in the European Union: A reassessment—Part 2. European Taxation, 46: 139–155.
Penrose, E. T. 2009. The Theory of the Growth of the Firm. Oxford: Oxford University Press.
Peppitt, M. 2008. Tax Due Diligence. Biggleswade: Spiramus Press Ltd.
Perlman, R.,1985. An algorithm for distributed computation of a spanningtree in an extended LAN. SIGCOMM Computer Communication Review, 15: 44–53. https://doi.org/10.1145/318951.319004
Phillips, R., Gardner, M., Robins, A., Education, U. S. P., Surka, M., & Education, U. S. P. 2017. The Use of Offshore Tax Havens by Fortune 500 Companies 60.
Polak, P. 2010. Centralization of Treasury Management in a Globalized World (SSRN Scholarly Paper No. ID 1702687). Rochester, NY: Social Science Research Network.
Polak, P., Robertson, D. C., Lind, M. 2011. The New Role of the Corporate Treasurer: Emerging Trends in Response to the Financial Crisis (SSRN Scholarly Paper No. ID 1971158). Rochester, NY: Social Science Research Network.
Powell, K. S., Rhee, M. 2016. Experience in different institutional environments and foreign subsidiary ownership structure. Journal of Management, 42: 1434–1461. https://doi.org/10.1177/0149206313506465
Ribeiro, S. P., Menghinello, S., & De Backer, K. 2010. The OECD ORBIS Database: Responding to the Need for Firm-Level Micro-Data in the OECD (OECD Statistics Working Papers No. 2010/01). https://doi.org/10.1787/5kmhds8mzj8w-en
Robé, J.-P. 2011. The legal structure of the firm. Accounting, Economics, and Law. https://doi.org/10.2202/2152-2820.1001
Rosenbloom, A. H. (Ed). 2002. Due Diligence for Global Deal Making: The Definitive Guide to Cross-Border Mergers and Acquisitions, Joint Ventures, Financings, and Strategic Alliances, 1st edn. Princeton: Bloomberg Press.
Sadiq, K., & Sawyer, A. 2016. Developing countries and the automatic exchange of information standard—A one-size-fits-all solution. Austl. Tax F., 31: 99.
Sandler, D. 1998. Tax Treaties and Controlled Foreign Company Legislation: Pushing the Boundaries. Kluwer Law International B.V.
Sawyer, A. 2011. THE OECD”S TAX INFORMATION EXCHANGE AGREEMENTS AN EXAMPLE OF (IN)EFFECTIVE GLOBAL GOVERNANCE? THE OECD 14.
Schizer, D. M. 1999. Sticks and snakes: Derivatives and curtailing aggressive tax planning. S. Cal. L. Rev., 73: 1339.
Sharman, J. C. 2009. The bark is the bite: International organizations and blacklisting. Review of International Political Economy, 16: 573–596. https://doi.org/10.1080/09692290802403502
Simon, H. A. 1978. Rationality as process and as product of thought. The American Economic Review, 68: 1–16.
Stewart, J. 2005. Fiscal incentives, corporate structure and financial aspects of treasury management operations. Accounting Forum, Tax Avoidance and Global Development, 29: 271–288. https://doi.org/10.1016/j.accfor.2005.03.001
Tamassia, R. 2013. Handbook of Graph Drawing and Visualization. Boca Raton: CRC Press.
Tang, R. Y. W., & Schultz, T. D. 2017. Country-by-country reporting: The New OECD Guidelines and IRS Final Regulations. Journal of Corporate Accounting & Finance, 28: 38–47. https://doi.org/10.1002/jcaf.22271
TAXUD, P.O. of the E. 2018. Aggressive tax planning indicators: final report. (Website).
Titman, S. 2017. Does ownership structure matter?—Titman—2017—European Financial Management—Wiley Online Library. European Financial Management, 23: 357–375.
TJN, 2019. CTHI 2019 Results [WWW Document]. https://www.corporatetaxhavenindex.org/introduction/cthi-2019-results. Accessed September 20.
TJN, 2018. FSI [WWW Document]. https://www.financialsecrecyindex.com/introduction/fsi-2018-results. Accessed May 08.
Tørsløv, T. R., Wier, L. S., & Zucman, G. 2018. The Missing Profits of Nations (Working Paper No. 24701). National Bureau of Economic Research. https://doi.org/10.3386/w24701
UNCTAD, 2016. World Investment Report 2016: Investor Nationality - Policy Challenges, United Nations Conference on Trade and Development (UNCTAD) World Investment Report (WIR). United Nations. https://doi.org/10.18356/9d7da2eb-en
UNCTAD (Ed.) 2015. Reforming international investment governance, World investment report. New York: United Nations.
US Department of the Treasury, 2016. The European Commission’s Recent State Aid Investigations of Transfer Pricing Rulings (White Paper). Washington D.C.
Valderrama, M., & Johanna, I. 2010. EU and OECD Proposals for International Tax Cooperation: A New Road? (SSRN Scholarly Paper No. ID 1977201). Rochester, NY: Social Science Research Network.
Welch, D. E., & Welch, L. S. 1996. The Internationalization process and networks: A strategic management perspective. Journal of International Marketing, 4: 11–28. https://doi.org/10.1177/1069031X9600400303
Williamson, O. E. 2005. Transaction cost economics. In Handbook of New Institutional Economics: 41–65. Boston, MA: Springer. https://doi.org/10.1007/0-387-25092-1_4
Williamson, O. E. 1999. The Mechanisms of Governance. Oxford: Oxford University Press.
Williamson, O. E. 1991. Comparative economic organization: The analysis of discrete structural alternatives. Administrative Science Quarterly, 36: 269–296. https://doi.org/10.2307/2393356
Zucman, G. 2015. The Hidden Wealth of Nations: The Scourge of Tax Havens. Chicago: University of Chicago Press.
Zucman, G. 2014. Taxing across borders: Tracking personal wealth and corporate profits. Journal of Economic Perspectives, 28: 121–148. https://doi.org/10.1257/jep.28.4.121.
ACKNOWLEDGEMENTS
The authors would like to thank our many colleagues and friends who lent their time, knowledge, and insights as we went through a number of iterations of this paper. We thank Reuven Avi-Yonah, Bruno Casela, Alex Cobham, Lorraine Eden, Daniel Haberly, Moran Harrari, Joanne Horton, Peter Jansky, Robert Kudrle, Omri Marian, Markus Meinzer, Yuval Milo, Anastasia Nesvetailova, Jenaline Pyle, Jean-Phillipe Robé, Lucio Sarno, Herman Mark Schwartz, Leonard Seabrooke, Jason Sharman, Christopher Trautvetter, two anonymous reviewers, and last, but not least, our commissioning editor at JIBP, Paul Vaaler. Without his patience and support this paper would have never seen the light of the day. Research for the paper was funded by the ERC Advanced Grant: Corporate Arbitrage and CPL Maps: Hidden Structures of Controls in the Global Economy (CORPLINK). Grant no. 69494.
Author information
Authors and Affiliations
Corresponding author
Additional information
Publisher's Note
Springer Nature remains neutral with regard to jurisdictional claims in published maps and institutional affiliations.
Accepted by Paul Vaaler, Area Editor 23 May 2020. This article has been with the authors for two revisions.
Electronic supplementary material
Below is the link to the electronic supplementary material.
Rights and permissions
Open Access This article is licensed under a Creative Commons Attribution 4.0 International License, which permits use, sharing, adaptation, distribution and reproduction in any medium or format, as long as you give appropriate credit to the original author(s) and the source, provide a link to the Creative Commons licence, and indicate if changes were made. The images or other third party material in this article are included in the article's Creative Commons licence, unless indicated otherwise in a credit line to the material. If material is not included in the article's Creative Commons licence and your intended use is not permitted by statutory regulation or exceeds the permitted use, you will need to obtain permission directly from the copyright holder. To view a copy of this licence, visit http://creativecommons.org/licenses/by/4.0/.
About this article

Cite this article
Phillips, R., Petersen, H. & Palan, R. Group subsidiaries, tax minimization and offshore financial centres: Mapping organizational structures to establish the ‘in-betweener’ advantage. J Int Bus Policy 4, 286–307 (2021). https://doi.org/10.1057/s42214-020-00069-3
Received:
Revised:
Accepted:
Published:
Issue Date:
DOI: https://doi.org/10.1057/s42214-020-00069-3