
Abstract
Continuous agricultural innovations are required to feed the exploding human population through natural or artificial resources. Though light is ample on earth, two-third of unavailable ocean and one-third of available soil are major limiting factors to free growth. Excessive fertilizer usage is irreversibly altering the chemical ecology of soil, further reducing the available area. Seed metabolism might be a potential answer to this resource crunch. Without genetic modification and thus maintaining the existing biodiversity, manipulation of seed metabolism at the very onset of germination is a sustainable alternative. The current work presents seed priming with iron pyrite (FeS2) prior to sowing as one such sustainable and innovative intervention to reduce fertilizer consumption in vegetable (beetroot, carrot), spice (fenugreek), fodder (alfalfa), and oilseed (mustard, sesamum) crops. A 12-h seed pretreatment in an aqueous suspension of nano-iron disulfide/pyrite (FeS2) resulted in significant yield increase in the above crops. While agriculturists aim to restore the natural genomic diversity of different domesticated crops, environmental engineers require technologies to reduce fertilizer consumption without compromising agricultural yields, thereby making the planet more sustainable. This nanoscale seed pretreatment approach using FeS2, otherwise a benign earth abundant mineral, suggests the sustainable opportunity to translate this technology to other crops thereby enhancing the global agricultural production.
Introduction
The Green Revolution has dramatically changed the global agriculture canvass by exploding agricultural productivity through a combination of strategies like improved seeds, newer agro-technologies, mechanization of farms, increased chemical intervention using fertilizers and pesticides, better irrigation practices, combined with strong governmental support, resulted in fewer farmers producing significantly more food and fiber at much lower prices [4, 15–17, 24, 25, 33]. The yield per unit of farmland in India increased by around 30 % from 1947 to 1979, whereas the crop area under high yielding varieties increased from 7 to 22 % as well, when Green Revolution was in full swing [26, 27].
These Green Revolution strategies had several positives and significantly reduced farming risks; however, they came at major environmental costs, viz. depletion of topsoil quality through excessive chemical usage, reduction in water table, contamination of ground and surface water bodies, increased greenhouse gas emissions, increased health threats to humans from long-term chemical usages, increase in air pollution, reduction in family farms, increased migration toward urban areas, and fragmentation of rural communities [4, 15–17, 24, 25, 33]. Of late, the fraternity of agriculturists, environmental engineers, and policy makers proposed a new and emerging movement to mitigate these adversarial environmental impacts: sustainable eco-friendly agriculture [12–14, 21].
‘Our Common Future’ a report published by the ‘World Commission on Environment and Development’ in 1987 defined sustainability as: ‘meeting the needs of the present, without compromising the ability of future generations to meet their own needs’ [6]. Sustainable development calls for confluence between economic development, social equity, and environmental protection. Sustainable agriculture mandates extremely judicious use of natural and synthetic resources related to the agricultural production process so that natural resources are conserved and nurtured to allow for self-regeneration, thereby retaining their productive capacity. Also, in doing so, further damage should not be inflicted to the already crippled ecosystem beyond the field’s edge [12–14, 21].
The topsoil ecosystem is one of the most fragile and extremely stressed natural resources in agriculture. Most of this is rendered alkaline or saline from excessive fertilizer and pesticide usage, and when combined with erratic rainfall, it has adversely impacted its ability to regenerate. A major environmental goal here is to ensure sustainability of the soil without reducing agricultural production.
One strategy to achieve this goal is by reducing fertilizer usage without reducing the yield. Researchers are exploring avenues for reducing fertilizer requirements by tweaking the seed metabolism through growth booster molecules or seed priming agents and using different nanoparticles as fertilizers [22]. A brief table has been presented in the supplementary information, highlighting the use of different kind nanoparticles in increasing plant production (Table S1). Recently, it was discovered that ‘a brief seed pretreatment of iron pyrite nanoparticles before sowing of spinach and chickpea crops resulted in significantly higher production’ [3, 10, 28–30]. In this work, we translated this technology into vegetable (beetroot, carrot), fodder (alfalfa), spice (fenugreek), and oil seed (mustard and sesame) crops. The field trail studies demonstrated significant increase in these crops’ yields. Further in sesame, one of the oldest oilseed crops, which is mostly grown in the drought-prone regions of the world, where oxidative stress is enormous, possibility of increasing seed vigor by fortifying/pretreating with antioxidant nanoparticles, viz. ceria (CeO2) [32] was tested along with another transition metal sulfide (molybdenum sulfide; MoS2). The results upon comparison with FeS2 studies amply demonstrated the uniqueness and significance of FeS2 seed pretreatment. A comparative table has been provided in the supplementary information, Table S2, highlighting the average yield of the crops under study, in the presence and absence of fertilizer (as reported in the literature) and finally comparing it following ‘FeS2 seed pretreatment + no additional fertilizer use’ (as reported in the present study). This work is divided into two parts, viz. (a) synthesis and characterization of the iron pyrite (FeS2), molybdenum sulfide (MoS2), and cerium oxide (CeO2) nanoparticles; (b) field trial and yield estimation of the above-mentioned crops.
Materials and methods
Synthesis of FeS2 nanoparticles
FeS2 synthesis was carried out in an aqueous medium by a single-step reaction as described in extensive details in the earlier works [10, 11, 28–30]. Ferric chloride was used as the precursor, sodium polysulfide (Na2Sx) as the reactant, and trisodium citrate as the capping cum complexing agent to control the particle size and shape. Sodium polysulfide (Na2Sx) was prepared in advance by a stoichiometric chemical reaction between NaOH, H2S, and elemental sulfur. In the final reaction vessel, ferric chloride reacts with sodium citrate and forms iron–citrate complex, which slowly reacts with sodium polysulfide to form iron pyrite particles. This reaction takes place in an argon-rich atmosphere and takes approximately 8 h to complete with sodium acetate and acetic acid as buffering solution. The reaction temperature and pH are maintained at 90 °C and 6, respectively. Further, trisodium citrate stabilizes the pyrite particles by forming a multilayered assembly of citrate anions on the pyrite surface thus preventing aggregation between the particles. Figure S1 shows the schematic diagram of the FeS2 preparation (Supplementary information). Scanning electron microscopy (SEM) was used to study the morphology of the synthesized particles. The chemical identity of FeS2 was verified using powder XRD, and patterns were matched with known JCPDS samples. Further Raman spectra of the synthesized particles were taken to verify the purity of the particles.
Synthesis of MoS2 nanoparticles
The synthesis is divided into two parts. First, (NH4)2MoS4 was synthesized. To a 5 g ammonium heptamolybdate, 30 mL Conc. NH4OH was added. Then, the H2S gas was passed rapidly through the filtrate. The color of the solution initially changed to yellow and gradually turns to red. After passing H2S for 30 min, the crystals deposition started. Upon initiation of crystal formation, purging of H2S was stopped and the red solution was allowed to cool at 0 °C and red crystals of ammonium tetrathiomolybdate were isolated by filtration (G4) frit. After that, the crystals were washed in distilled water and ethanol. In the second step, the (NH4)2MoS4 was reacted with sodium dithionite to obtain the MoS2 particles. 100 mL 0.01 M (NH4)2MoS4 was taken in 250-mL round-bottom flask. To it, solid 0.7 g sodium dithionite was added very quickly. After that, 2 mL of 0.5 M HCl was added in a dropwise manner and stirred for another 30 min. Then to it, 100 mL 0.1 M (1.8 g in 100 mL) fructose solution was added and stirring was continued for another 30 min. It was left for 2 h for the completion of the nucleation process. After that, it was centrifuged three times with water and three times with acetone and vacuum dried for further use. Figure S2 of supplementary information shows the schematic diagram of the MoS2 preparation [30].
Synthesis of CeO2 nanoparticles
Cerium oxide nanoparticles (NPs) were synthesized from aqueous solutions of cerium (III) nitrate and HMTA using reported method [32]. In typical procedure, 20 mL of Ce(NO3)3·6H2O, 0.0125 M was added in a dropwise manner to 200 mL 0.0125 M HMTA and stirred for 30 min. Then, the mixture was heated at 75–80 °C with continuous stirring. A white colloidal suspension is formed within 30 min. This white colloidal suspension is to be left for 2 h at room temperature, so that it cools down gradually. The CeO2 nanoparticles were separated from the cooled suspension by centrifugation. The white particles were washed with deionized water to remove soluble impurities followed by washing with acetone and dried in vacuum and further characterized using SEM, TEM, Raman, and XRD. Figure S3 of supplementary information shows the schematic diagram of CeO2 preparation.
Seed pretreatment strategy
All crops chosen for the study were subjected to similar kind of seed pretreatment. Seeds were treated in 100 µg/mL aqueous suspension of FeS2 for 12 h (overnight). The control seeds were only treated with water for the same duration. After pretreatment, seeds were removed from the suspension and directly sowed in the field. Similar dosage and practice were followed for MoS2 and CeO2 in the sesame crop study.
Field trial of beetroot, carrot, fenugreek, and mustard along with further quantification of chlorophyll, beta-carotene, and common flavonoids in fenugreek leaves
Field trials for different crops were conducted in two different geographical locations in India during 2014–2015. The trials for beetroot, carrot, fenugreek, and mustard were conducted at Ghaziabad District (Uttar Pradesh), India, during the winter season (October 2014–February 2015). This place has a longitude, latitude, and altitude of N 77°, E 28°, and 216 m above MSL, respectively, and is in the upper Gangetic Plains having predominantly sandy-loam soil. Ghaziabad District has an annual average rainfall of 810 mm with most of the rain experienced between the month of June and September. The average temperature ranges between 7.5 °C in the month of January to 39.2 °C in the month of May, and 13.2 °C in the month of November to 33.6 °C in the month of August. The average temperature is around 25.7 °C. All the trials were conducted without using any fertilizer, insecticides, pesticides, or herbicides. Weeding was carried out manually and periodically. Two randomly chosen plots (12 square feet each) were assigned for each crop: one for the control (seed sown after pretreatment in water) and the other for the test (seed sown after pretreatment in aqueous FeS2). Equal amount of seeds was sown in the control and the test plots, and the growth and production were monitored. For carrot, beetroot, fenugreek, and mustard, seed quantities of 0.25, 0.25, 0.25 and 0.50 g, respectively, were used for control and FeS2 seed pretreatment. Individual crops were harvested at maturity, and all relevant parameters including yield were evaluated. For carrot, concentration of beta-carotene was evaluated, whereas in fenugreek leaves, concentrations of chlorophyll and the presence of other common flavonoids were quantified. Protocol for chlorophyll estimation is described in detail elsewhere [30]. Beta-carotene from carrot was extracted by liquid–liquid extraction and quantified by recording the absorbance at OD461 nm [18]. Common flavonoids were estimated using high-performance thin-layer chromatography (HPTLC) methods, and the detailed protocol has been discussed elsewhere [20].
Field trial of alfalfa and sesame
The field trials for alfalfa and sesame were conducted at Aurangabad (Maharashtra), India. The alfalfa was grown in the winter months (December 2014–May 2015), and sesame was grown during the monsoon season (August 2014–November 2014). This place has a longitude, latitude, and altitude of N 19°, E 75°, and 513 m above MSL, respectively, and is categorized as a hot, semiarid, eco-region with shallow to deep black soil.
Aurangabad District experiences an average rainfall that occurs in the monsoon season from June to September with annual rainfall which is 710 mm. The temperature range is 13.7 °C in December to 41.9 °C in May and 16.6 °C in November to 30.4 °C in August. Average temperature is 27.55 °C.
All trials were conducted under rain-fed condition, without using any fertilizer, insecticides, pesticides, or herbicides. Weeding was carried out manually and periodically. In sesame, four levels of treatments (control, FeS2, MoS2, CeO2) were used and each treatment was replicated three times, requiring 12 plots for doing a ‘Randomized Complete Block Design’ (RCBD). Each plot size was of 3 m × 4 m and was obtained by equally dividing a large continuous area into a 4 × 3 grid. Individual plots were picked randomly to apply different treatment levels. Equal number of sesame seeds in 12 identical sets was treated with seed pretreatment solutions of FeS2, MoS2, CeO2, and distilled water so that three sets of each treatment level were obtained. These treated seeds were sown in the designated plots, chosen randomly, so that 600 plants per plot occur. However, for preventing overcrowding and ease of care, after 20 days of sowing, thinning to 400 plants per plot was carried out. The thinning was also carried out randomly. All plots received sunlight, rainwater, and other care in an identical fashion. After the complete crop cycle of 110 days, the final harvesting was performed. After 40 days, 20 plants were chosen randomly from each plot for nondestructive testing method of visual inspection. In this process, the number of pods per plant was counted and the initial results were analyzed. This implies that 60 randomly selected plants for each treatment were obtained (n = 60), resulting in a representative sample of 5 % of the population. Since n > 30, using central limit theorem (CLT) we used pairwise Z test for comparing the means. Similarly, at the end of 110 days, the natural maturity cycle of the crop, again 20 random plants from each plot was taken, resulting in the same 5 % representative sampling. The null hypothesis was that the means of response variable from two different treatments were the same, against the alternate hypothesis that the mean of response variable related to FeS2 nanoparticle-pretreated seeds was significantly higher than its comparison. Hypothesis was tested using a level of significance (alpha) of 0.01. As response variables, the following eight characteristics were evaluated: (a) shoot length, (b) root length, (c) total biomass, (d) pod biomass, (e) shoot biomass, (f) root biomass, (g) number of pods per plant (at day 40 by visual observation), and (h) seed yield per plant.
Results and discussion
Characterization of FeS2 nanoparticle
The particle size varies between 100 and 200 nm (Fig. 1a). The powder XRD pattern shown in Fig. 1b indicates the typical reflection patterns of pyrite particles (JCPDS no. 42-1340). The XRD plot with 2θ values at 28.4°, 32.8°, 36.9°, 40.6°, 47.3°, 56.0°, 58.7°, 61.3°, and 64.2° can be ascribed as the crystal plane of (111), (200), (210), (211), (220), (311), (222), (023), and (321), respectively. Such type of intense peaks in the XRD pattern clearly indicates the absence of impurities like sulfur, greigite [10, 11, 28–30]. Raman spectra were recorded between the wave numbers ranging from 200 to 500 cm−1. Sharp peaks at 334.8, 376.2, and 428.6 cm−1 were observed, and these results are in agreement with the earlier work on Raman analysis of pure FeS2 crystals.

Structural characterization of FeS2 nanoparticles. a Representative TEM images showing particle sizes varying from 100 to 200 nm. b Representative XRD pattern of the synthesized particles. c Representative Raman spectra of the synthesized particles. In the Raman spectra, sharp peaks were observed at 335, 376, and 429 cm−1, in which 335 and 376 cm−1 are the characteristic active modes for FeS2 representing to the S2 libration (Eg) and in phase stretching vibration of S–S dimer (Ag), respectively. The peak which is at 429 cm−1 represents to the coupled libration and stretching (Tg) modes or combination of both
Characterization of MoS2 nanoparticle
The SEM image shows the synthesized two-dimensional MoS2 nano-sheets (Figure S4A, supplementary information). The XRD pattern showed the broad diffraction peaks around 14.50 attributed 002 plane of MoS2 (JCPDS No.: 37-1492) [19]. This broad pattern clearly indicates amorphous nature of the materials [31]. The peak around 23.20, 25.40, and 27.70 could be assigned to S due to the presence of small amount of S in MoS2 system (Figure S4B, supplementary information). Similar XRD pattern was reported in earlier works [30, 31]. Raman spectra are shown in Figure S4C (supplementary information).
Characterization of CeO2 nanoparticle
SEM image of CeO2-HMTA particles shows average particle size approximately 6.5 nm (Figure S5A, supplementary information). The X-ray diffraction pattern of CeO2-HMTA indicates single phase of CeO2 particles (Figure S5B, supplementary information). The data are in agreement with previously reported results [1, 9, 32].
Field trial of vegetables (beetroot, carrot), spice (fenugreek, further quantification of chlorophyll, beta-carotene, and common flavonoids of fenugreek leaves), and oilseed (mustard) grown in the Indian subcontinent during winter season
-
1.
Beetroot The field trial results of beetroot crop are summarized in Fig. 2a–i. It was found that there is significantly higher beet production following nano-FeS2 seed pretreatment. Total yield of control and FeS2-pretreated beetroot crop is 4.65 and 6.85 kg, respectively (n = 70), where n stands for the total number of beetroot bulbs harvested from the plot, resulting in a 47 % yield increase in beetroot, following FeS2 seed pretreatment.
Fig. 2 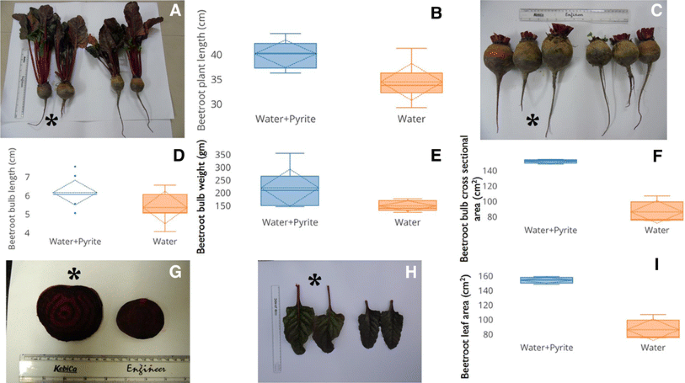
Analysis of the results for beetroot. The asterisk indicates the crop harvested after FeS2 seed pretreatment. The sampling number is shown in ‘n’ which represents approximately 10–15 % of the total sample size, and standard deviation is shown as SD. Water stands for control seed pretreatment in ‘water alone.’ a The representative pictures of fully mature beetroot crop showing larger bulb size of beet crops following FeS2 seed pretreatment. b The mean ± SD plant length (including the leaves) for control and FeS2 seed pretreatment is 34 ± 3.7 and 39.9 ± 2.7 cm, respectively. ANOVA analysis indicated that a p < 0.01; n = 10, thus highlighting a significant difference in the two population. c The representative pictures of fully mature beetroot bulb for comparison. d The mean ± SD beetroot bulb length for control and FeS2 seed pretreatment is 6.1 ± 0.6 and 5.3 ± 0.8 cm, respectively. ANOVA analysis indicated that a p < 0.05; n = 10. e The mean ± SD beetroot bulb weight for control and FeS2 seed pretreatment is 143.8 ± 20.1 and 215.1 ± 72.8 g, respectively. ANOVA analysis indicated that a p < 0.05, n = 7. f The mean ± SD of the cross-sectional area of the beetroot bulb for control and FeS2 seed pretreatment is 84.7 ± 14.7 g and 150 ± 2.5 cm2, respectively. g Representative picture of the beetroot cross section. h Representative pictures of the leaves obtained from FeS2-pretreated and control leaves. i The mean ± SD of the leaf area for control and FeS2 seed pretreatment is 84.7 ± 14.7 g and 152 ± 4.3 cm2, respectively
-
2.
Carrot The field trial results of carrot crop are summarized in Fig. 3a–d. It was found that there is significantly higher carrot production following nano-FeS2 seed pretreatment. Total yield of control and FeS2-pretreated carrot crop is 11.4 and 13.6 kg, respectively (n = 70), where n stands for the total number of carrot bulbs harvested from the plot. This amounts to a 19 % increase in the yield of carrot, following FeS2 seed pretreatment. There was no difference observed in the level of beta-carotene in control as well test case.
Fig. 3 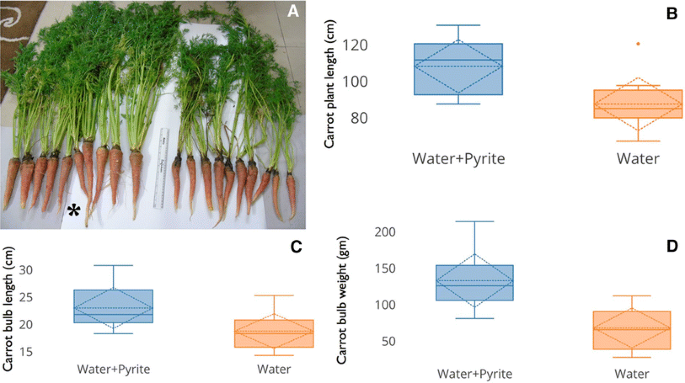
Analysis of the results for carrot. The asterisk indicates the crop harvested after FeS2 seed pretreatment. The sampling number is shown in ‘n’ which represents approximately 10–15 % of the total sample size, and standard deviation is shown as SD. Water stands for control seed pretreatment in ‘water alone.’ a The representative pictures of fully mature carrot crop following FeS2 seed pretreatment and control. b The mean ± SD of the total length of the carrot plant for control and FeS2 seed pretreatment is 34 ± 5.7 and 42 ± 5.7 cm2, respectively, where n = 10. ANOVA analysis indicated that p < 0.01 between the two populations. c The mean ± SD of the total length of the carrot bulb for control and FeS2 seed pretreatment is 18.4 ± 3.1 and 22.7 ± 3.7 cm, respectively, where n = 10. ANOVA analysis indicated that p < 0.05 between the two populations. d The mean ± SD of the total weight of the carrot bulb for control and FeS2 seed pretreatment is 65.67 ± 27 cm and 130 ± 36 g, respectively, where n = 10. ANOVA analysis indicated that p < 0.01 between the two populations
-
3.
Fenugreek Fenugreek is a commonly used spice in Asian, African, and Latin American continents, as well as it is used for its leaves in several parts of the world. The following parameters were evaluated in fenugreek: the shoot length, root length, leaf area, and number of leaves per plants. Further, chlorophyll and the presence of common flavonoids in the leaves were assayed and quantified. Representative picture of the actual growing plots, morphological details of the leaves, and comparative analysis of the shoot length is shown in Figure S6 (Supplementary information).
Leaf assay was performed from ten randomly chosen plants. Total leaf area was obtained from all the trifoliate leaves from each of these selected plants, and then, it is divided by the total number of leaves to get the average leaf area. Similarly total leaf number was calculated. The data are summarized in Fig. 4a–d. The higher level of chlorophyll (Fig. 4c) suggests that FeS2-pretreated seeds resulted in more energy efficient plants. This opens the possibility that in temperate areas of the world, where sunlight is limited during a significant portion of the year, this technology could be exploited for maximizing crop yields during the limited cropping seasons.
Fig. 4 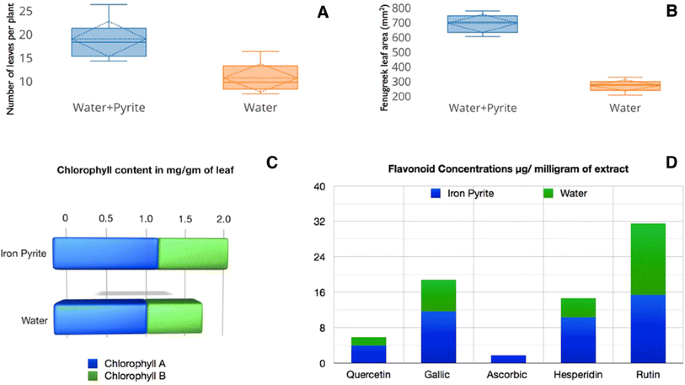
Analysis of the fenugreek crop at day 50 from the time of sowing. a The mean ± SD of the number of leaves per plant for control and FeS2 seed pretreatment is 263.4 ± 37.33 and 684.7 ± 61.3 mm2, respectively. ANOVA analysis indicated that a p < 0.01; n = 10, thus highlighting a significant difference in the two populations. b The mean ± SD of the leaf area for control and FeS2 seed pretreatment is 10 ± 3 and 18 ± 2, respectively. ANOVA analysis indicated that a p < 0.01; n = 10, thus highlighting a significant difference in the two populations. c In control and FeS2 seed-pretreated plants, the average chlorophyll concentration is 1.6 and 2.1 mg/g of leaf tissue, respectively. Thus, there is a 30 % increase in the chlorophyll concentration in the leaves following FeS2 seed pretreatment. This could be one of the possible contributing factors in higher growth following FeS2 seed treatment. d There was no significant difference in the concentrations of some of the common flavonoids. However, a slightly elevated level of ascorbic acid in FeS2 seed-pretreated plants was seen
-
4.
Mustard Mustard is a prominent oilseed crop and is used for several culinary applications. This crop is grown during the winter months between October and February, in the northern plains of India. The crop takes 120 days to mature. At maturity, the crop was harvested and total seed weight was evaluated. The total seed production for control and FeS2 nanoparticle-pretreated crop was 230 and 380 g, respectively (n = 30, total number of plants harvested). This indicates a 65 % increase in the seed yield following FeS2 pretreatment. Representative pictures of the mustard plants following FeS2 seed pretreatment are shown in supplementary Figure S7.


Field trial of fodder (alfalfa) and oilseed (sesame)
-
1.
Alfalfa It is a perennial flowering plant, grown mostly for fodder. After 75th day of sowing, the following parameters were evaluated: (a) leaves per plant, (b) number of branches per plant, (c) leaf area (mm2), (d) root length, (e) shoot length, (f) fresh weight (biomass). Table 1 summarizes the findings. The data clearly indicate a statistically significant increase in mean parameters of alfalfa plants germinated from FeS2-pretreated seeds. The pretreatment resulted in more soil cover, thus having more anchorage of the soil and thereby possibly reducing soil erosion. Such an approach could be sustainable approach in a fragile ecosystem where there is extensive soil erosion resulting in loss of critical mass of top soil. Figure 5 shows the representative comparative pictures of the alfalfa plants following FeS2 seed pretreatment and control.
Table 1 Comparison of the growth parameters in 75-day-old alfalfa crop, in control and FeS2 seed pretreatment Fig. 5 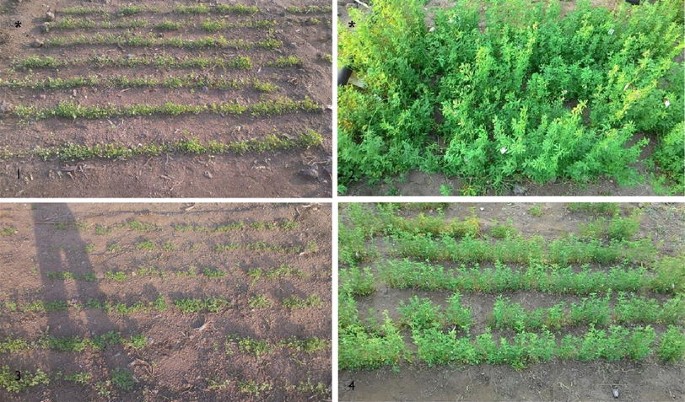
Field trial with alfalfa. Representative pictures of the plots are numbered from 1 to 4 in the photographs. Plot 1 and plot 2 (both upper panels) showed the 25 days after sowing and 75 days after sowing, respectively, in the FeS2 seed-pretreated plots. Similarly plot 3 and plot 4 (both lower panels) showed the 25 days after sowing and 75 days after sowing, respectively, in the control plots. Visible observations showed higher foliage growth in the FeS2 seed-pretreated plants. They showed a dense soil cover
-
2.
Sesame Archeological evidence suggests that Sesamum indicum L. is the most ancient oil seed used by mankind. Sesame seed contains 50–60 % oil, 35–50 % protein rich in amino acids like tryptophan and methionine, 1.3 % calcium and natural antioxidants (sesamolin, sesamin, sesamol). The presence of these natural antioxidants makes sesame oil very stable. The high nutritional value of sesame seeds and its widespread use in food and pharmaceutical products have put increasing demand for its seeds in the international agricultural and food trade [5, 7, 8, 23]. But it is noteworthy that bulk of the sesame production is concentrated in the hot semiarid tropics of the world where precipitation is marginal and erratic, resulting in crops undergoing major stress induced damage. We evaluated the yield of 120-day-old fully mature sesame crop following a brief seed pretreatment with control, FeS2, MoS2, and CeO2 at the time of sowing in an aqueous suspension of the above-mentioned particles.

The most obvious question is ‘What was the rational for using three different nanoparticles for sesame crop?’. The sesame and other oilseed plants suffer from chronic sulfur deficiency. The sulfur deficiency becomes more critical in drought-prone regions with erratic rainfall. Most of the sesame farmers are marginal land holders and are concentrated in the semiarid tropics of the world where rainfall and soil health are a issue. One of the approaches which have been attempted in this study is to fortify the germinating sesame seeds with two abundant sources of sulfur, viz. FeS2 and MoS2. The approach was twofold. First, to test whether this effect is unique to FeS2 seed pretreatment or by replacing Fe with Mo, the similar effect can be observed. Second, this experiment was the first step toward understanding the mechanism of action of FeS2; ‘Is sulfur playing the key role, or iron playing the role or both together is playing the key role?’ The other aspect which has been addressed in sesame field trial is ‘the inherent problem of oxidative stress experienced by the germinating seeds in the drought-prone regions of the world.’ The critical question asked in this field trial is ‘Could fortification of the germinating seeds with a potential antioxidant nanoparticle, viz. CeO2, increases the production, by overcoming the initial oxidative stress?’. Here, it is noteworthy that Chinese farmers use CeO2 in the paddy field as a micronutrient. So unlike other inorganic materials, CeO2 is already used by the farmers, a possible translatable farming strategy [10, 28–30]. In the subsequent section, the results had been summarized. Following the results, the possible mechanism of action of these different nanoparticles has been discussed.
The results are summarized in Figs. 6, 7 and Table 2. Visually, no significant difference is seen on shoot growth after different treatments (Fig. 6a–c).

Shoot and root length of the sesame crop upon harvesting at day 110. a There is no significant difference in shoot length upon FeS2 and MoS2 treatment. b Similarly for root length, there is no significant difference between FeS2 and MoS2 treatment. c Visual observation does not depict any mark change in the shoot growth

Fresh biomass and fruit yield of the sesame crop. a Total biomass upon harvesting. b Pod biomass. c Shoot biomass d Root biomass. e Number of pods per plant estimated at day 40 by random visual observation. f Seed yield per plant upon harvesting
At the end of 110 days, a significant difference in biomass of seed pod, shoot, and root lengths was observed for the plants germinated from FeS2-pretreated seeds (Fig. 7a–d). Here again, no major difference in plant length can be observed visually; however, when the number of pods per plant at day 40 was estimated, FeS2-pretreated plants exhibited marked increase in number of pods. Eventually after harvesting, it was observed that FeS2 pretreatment resulted in significantly large seed yield per plant (Fig. 7e, f). A comparative summary of the growth parameters of the sesame crop is tabulated in Table 2.
In the subsequent paragraphs, overall implications of this study have been discussed. There are three key observations made in this study, which has been enumerated below:
-
1.
There is an increase in yield in multiple crops, following seed pretreatment with FeS2 + water.
-
2.
An attempt to emulate the effect with FeS2, with another transition metal sulfide, viz. MoS2, replacing iron with Mo, failed to yield the same effect at least in one major oilseed crop (sesame).
-
3.
Fortifying seeds with an inorganic antioxidant did not offer any increase in yield (sesame).
The possible answer to these observations lies in the aqueous chemistry of FeS2. In the presence of water, FeS2 generates very trace amounts of H2O2, FeS, elemental sulfur, FeSO4, Fe2O3 [10, 28–30]. It has been shown that the trace amounts of Fe2O3 are a plant growth stimulant (Table S1). Similarly H2O2 seed treatment supports faster seed germination [10, 28–30]. Further, elemental sulfur also helps in seed fortification. The growth promoting effects upon seed pretreatment with FeS2 nanoparticles with six different crops are indicating that it is possibly the exposure of the seeds to a mixture of FeS2 along with the above-mentioned trace compounds (Fe2O3, H2O2, S, FeS, Fe2SO4), generated in the aqueous suspension, and is responsible for this drastic improvement in growth. Further, a slight acidic nature of the aqueous suspension of FeS2 catalyzes this process. The results obtained from MoS2 partly support the claim. Why this yield increase result cannot be completely emulated by another common sulfide, viz. MoS2? MoS2 is very inert as compared to FeS2 in an aqueous environment. It is well known that MoS2 remains unaffected by dilute acids and molecular oxygen [2]. Thus, MoS2 + H2O alone could not bring any such remarkable change in the seed metabolism. This interesting observation requires further exploration to dissect the role of MoS2 in seed germination. Similarly CeO2 though a potential antioxidant molecule [1, 9, 32] does not have any positive influence as a seed pretreatment agent. Why is it so? It is a well-known fact that exposure of germinating seeds with antioxidant enzymes like catalase delays germination. Essentially, catalase scavenges the H2O2 and delays the germination. A germinating seed secretes endogenous H2O2 to assist in faster breakdown of the stored carbohydrates present in the cotyledons, so as to promote faster grown. Such a reaction is hindered in the presence of an antioxidant, thus delaying the germination. Possibly CeO2 is mimicking the effect of catalase by scavenging the endogenous H2O2 generated by the seeds. This finding needs further exploration so as to understand the mechanism of action of CeO2 and FeS2, a radical scavenger (H2O2), and a radical generator (H2O2) [1, 9, 10, 28–30, 32]. Thus, FeS2 is possibly not entering inside the seed, instead interacting with water to generate trace compounds, which are responsible for increasing the seed metabolism.
Conclusion
Agriculturists and environmental engineers have to ensure that the natural genomic diversity of different domesticated crops is restored, by adopting technologies that allow for reducing fertilizer consumption and yet increase the yield. Only then the food demand of the increasing global population can be met, while ensuring sustainability of mother nature. This nanoscale approach of using FeS2 seed pretreatment, which otherwise is a benign earth abundant mineral, warrants the possibility of translating this technology to other crops and enhances the global crop production. We hope that our study will be the curtain raiser to the next ‘sustainable green revolution.’
References
Arya A, Sethy NK, Singh SK, Das M, Bhargava K (2013) Cerium oxide nanoparticles protect rodent lungs from hypobaric hypoxia-induced oxidative stress and inflammation. Int J Nanomed 8:4507–4520. doi:10.2147/IJN.S53032 (Epub 2013 Nov 21)
Benavente E, Santa Ana M, Mendizábal F, González G (2002) Intercalation chemistry of molybdenum disulfide. Coord Chem Rev 224:87–109
Bhargava K (2015) Innovations to give us hope for the future. Nurturing a sustainable future, Women’s Forum Italy 29–30 June 2015. http://www.womens-forum.com/speakers/kalpana-bhargava/837
Bowonder B (1979) Impact analysis of the green revolution in India. Technol Forecast Soc Change 15(4):297–313. doi:10.1016/0040-1625(79)90023-4
Brar GS, Ahuja K (1980) Sesame: its culture, genetics, breeding and biochemistry. Annual Review of Plant Science. Kalyani Publishers, New Delhi
Brundtland GH (1987) Report of the world commission on environment and development: our common future. The United Nations World Commission on Environment and Development, Oxford University Press, Oxford
Budowski P, Markley K (1951) The chemical and physiological properties of sesame oil. Chem Rev 48:125–151
Budowski P (1964) Recent research on sesamin, sesamolin, and related compounds. J Am Oil Chem Soc 41:280–285
Das M, Patil S, Bhargava N, Kang JF, Riedel LM, Seal S, Hickman JJ (2007) Auto-catalytic ceria nanoparticles offer neuroprotection to adult rat spinal cord neurons. Biomaterials 28(10):1918–1925
Das M, Srivastava G, Das C, Dubey A, Sethy NK, Bhargava K, Singh SK, Philip D (2015) Iron pyrite as seed treatment biostimulant: the new revolution? New AG Int 41–42. http://www.newaginternational.com
Dubey A, Singh SK, Tulachan B, Roy M, Srivastava G, Philip D, Sarkar S, Das M (2016) Nano iron pyrite (FeS2) exhibits bi-functional electrode character. RSC Adv 6:16859–16867. doi:10.1039/C6RA01973K
Desai BK, Pujari BT (2007) Sustainable agriculture: a vision for future. New India Publishing Agency, ISBN 10: 8189422634 ISBN 13: 9788189422639
Fukuoka M (2001) One straw revolution. Other India Press, Goa
Jacobsen S-E, Sorenen M, Pedersen SM, Weiner J (2013) Feeding the world: genetically modified crops versus agricultural biodiversity. Agron Sustain Dev 33(4):651–662
Joshi MV (1999) Green-revolution and its impacts. APH Publishing Corporation, New Delhi
Ju XT, Kou CL et al (2007) Changes in the soil environment from excessive application of fertilizers and manures to two contrasting intensive cropping systems on the North China Plain. Environ Pollut 145(2):497–506. doi:10.1016/j.envpol.2006.04.017
Kahrl F, Li Y et al (2007) Green house gas emissions from nitrogen fertilizer use in China. Environ Sci Policy 145(2):497–506. doi:10.1016/j.envsci.2010.07.006
Karnjanawipagul P, Nittayanuntawech W, Rojsanga P, Suntornsuk L (2010) Analysis of β-carotene in carrot by spectrophotometry. Warasan Phesatchasat 37(1–2):8–16
Lu C, Liu WW, Li H, Tay BK (2014) Binder-free CNT network-MoS2 composite as a high performance anode material in lithium ion batteries. Chem Commun 50:3338–3340
Mehrotra S, Kirar V, Vats P, Nandi SP, Negi PS, Misra K (2015) Phytochemical and antimicrobial activities of Himalayan Cordyceps sinensis (Berk.) Sacc. Indian J Exp Biol 53(1):36–43
Mitsch WJ (1993) Ecological engineering: a cooperative role with the planetary life-support systems. Environ Sci Technol 27:438–445
Paparella S, Araújo SS, Rossi G, Wijayasinghe M, Carbonera D, Balestrazzi A (2015) Seed priming: state of the art and new perspectives. Plant Cell Rep 34:1281–1293
Pathak N, Rai AK, Kumari R, Thapa A, Bhat KV (2014) Sesame crop: an underexploited oilseed holds tremendous potential for enhanced food value. Agric Sci 5:519–529
Pingali PL (2012) Green revolution: impacts, limits, and the path ahead. PNAS 109:12302–12308. doi:10.1073/pnas.0912953109
Singh B, Sekhon GS (1976) Nitrate pollution of groundwater from nitrogen fertilizers and animal wastes in the Punjab, India. Agric Environ 3(1):57–67. doi:10.1016/0304-1131(76)90007-2
Singh J (1972) A new technique for measuring agricultural productivity in Haryana (India). Geogr 19:15–33
Singh J, Dhillion SS (2000) Agricultural geography, 2nd edn. Tata McGraw Hill, New Delhi
Srivastava G, Das A, Kusurkar TS, Roy M, Airan S, Sharma RK, Singh SK, Sarkar S, Das M (2014) Iron pyrite, a potential photovoltaic material, increases plant biomass upon seed pretreatment. Mat Express 4:23–31
Srivastava G, Das CK, Das A, Singh SK, Roy M, Kim H, Sethy N, Kumar A, Sharma RK, Singh SK, Philip D, Das M (2014) Seed treatment with iron pyrite (FeS2) nanoparticles increases the production of spinach. RSC Adv 4:58495–58504
Srivastava G (2016) Iron pyrite: a seed biostimulant. Doctoral thesis, Indian Institute of Technology Kanpur, India Electronic Thesis and Dissertations (ETD) link. http://172.28.64.70:8080/jspui/handle/123456789/15534
Tian Y, Zhao X, Shen L, Meng F, Tang L, Deng Y, Wang Z (2006) Synthesis of amorphous MoS2 nanospheres by hydrothermal reaction. Mater Lett 60:527–529
Ujjain SK, Das A, Srivastava G, Ahuja P, Roy M, Arya A, Bhargava K, Sethy N, Singh SK, Sharma RK, Das M (2014) Nanoceria based electrochemical sensor for hydrogen peroxide detection. Biointerphases. doi:10.1116/1.4890473
Volokh AA, Gorbunov AV et al (1990) Phosphorus fertilizer production as a source of rare-earth elements pollution of the environment. Sci Total Environ 95:141–148. doi:10.1016/0048-9697(90)90059-4
Acknowledgments
This work is partly supported by DRDO CARS grant on the role of cerium oxide nanopaticles as a putative high-altitude medicine (DIPAS/BSBE/20110112) to MD. KB and NS acknowledge the funding obtained from DIP-254 on cerium nanoparticles. Part of the work has evolved from the doctoral thesis of CKD, which was awarded at IIT Kanpur, India. This work is part of GS’s doctoral thesis (IIT Kanpur, India). Part of this work is the doctoral thesis of AD of Design program of IIT Kanpur, India. MR is supported by SB/FT/CS-199/2013 (DST- SERB, GOI).
Author information
Authors and Affiliations
Corresponding author
Additional information
Chinmaya Kumar Das, Gaurav Srivastava and Amarish Dubey have contributed equally to this work.
Electronic supplementary material
Below is the link to the electronic supplementary material.
Rights and permissions
About this article

Cite this article
Das, C.K., Srivastava, G., Dubey, A. et al. Nano-iron pyrite seed dressing: a sustainable intervention to reduce fertilizer consumption in vegetable (beetroot, carrot), spice (fenugreek), fodder (alfalfa), and oilseed (mustard, sesamum) crops. Nanotechnol. Environ. Eng. 1, 2 (2016). https://doi.org/10.1007/s41204-016-0002-7
Received:
Accepted:
Published:
DOI: https://doi.org/10.1007/s41204-016-0002-7