
Abstract
The modelling of nonlinear viscous effects for a wave energy converter (WEC) under control systems represents a difficult task. The control system aims to maximize the power capture of WECs. Consequently, large velocities of these devices observe. In addition, the linear potential theory is unable to show a realistic prediction of power production by neglecting viscous effects. A common way of modelling the viscous drag force of WECs is based on the viscous term of the Morison equation. In the literature, this approach shows that drag coefficient has a high variability that depends mainly on the relative velocity of the device. In the paper, two models analyze the nonlinear viscous effects on three cylindrical point absorbers. They have different diameter (D) to draft (T) ratios and are controlled by latching control. The first model approaches the viscous force according to the Morison equation. The second model is a heuristic model proposed by the present study. This new approach calculates the viscous force based on two parameters. Computational fluid dynamics (CFD) evaluates the fidelity of both models and the power production of the three-point absorbers. The proposed model shows good concordance with the CFD results at low and high velocities of point absorbers. The power production of the three-point absorbers controlled by latching shows that the power conversion increase is proportional to the D/T ratio.


References
Anbarsooz M, Passandideh-Fard M, Moghiman M (2014) Numerical simulation of a submerged cylindrical wave energy converter. Renew Energy 64:132–143. https://doi.org/10.1016/j.renene.2013.11.008
Asmuth H, Schmitt P, Elsaesser B, Henry A (2015) Determination of non-linear damping coefficients of bottom-hinged oscillating wave surge converters using numerical free decay tests. In: The 1st international conference on renewable energies offshore, Lisbon, Portugal, pp 507–513
Babarit A, Hals J, Muliawan MJ, Kurniawan A, Moan T, Krokstad J (2012) Numerical benchmarking study of a selection of wave energy converters. Renew Energy 41:44–63. https://doi.org/10.1016/j.renene.2011.10.002
Backer G (2009) Hydrodynamic design optimization of wave energy converters consisting of heaving point absorbers. Dissertation, Ghent University. http://www.vliz.be/imisdocs/publications/220173.pdf
Bhinder MA, Babarit A, Gentaz L, Ferrant P (2011) Assessment of viscous damping via 3D-CFD modelling of a floating wave energy device. In: The 9th European wave and tidal energy conference, EWTEC, Southampthon, UK, pp 1–6
Budal K, Falnes J (1980) Interacting point absorbers with controlled motion. In: Power from sea waves. Academic Press, London, pp 381–399
Cruz JMBP, Salter SH (2006) Numerical and experimental modelling of a modified version of the Edinburgh Duck wave energy device. Proc Inst Mech Eng Part M J Eng Maritime Environ 220(3):129–147. https://doi.org/10.1243/14750902jeme53
Cummins WE (1962) The impulse response function and ship motions. Schiffstechnik 47:101–109
Davidson J, Giorgi S, Ringwood JV (2015) Linear parametric hydrodynamic models for ocean wave energy converters identified from numerical wave tank experiments. Ocean Eng 103:31–39. https://doi.org/10.1016/j.oceaneng.2015.04.056
Devolder B, Rauwoens P, Troch P (2016) Numerical simulation of a single Floating Point Absorber Wave Energy Converter using OpenFOAM®. In: The 2nd international conference on renewable energies offshore, Lisbon, Portugal, pp 197–205. https://doi.org/10.1201/9781315229256-25
Devolder B, Stratigaki V, Troch P, Rauwoens P (2018) CFD simulations of floating point absorber wave energy converter arrays subjected to regular waves. Energies 11(3):641. https://doi.org/10.3390/en11030641
Falcão AFO (2010) Wave energy utilization: a review of the technologies. Renew Sustain Energy Rev 14(3):899–918. https://doi.org/10.1016/j.rser.2009.11.003
Giorgi G, Ringwood JV (2016) Implementation of latching control in a numerical wave tank with regular waves. J Ocean Eng Mar Energy 2(2):211–226. https://doi.org/10.1007/s40722-016-0052-8
Giorgi G, Ringwood JV (2017a) Nonlinear Froude-Krylov and viscous drag representations for wave energy converters in the computation/fidelity continuum. Ocean Eng 141:164–175. https://doi.org/10.1016/j.oceaneng.2017.06.030
Giorgi G, Ringwood JV (2017b). Consistency of viscous drag identification tests for wave energy applications. In: 12th European wave and tidal energy conference, Cork, Ireland, pp 1–8
Giorgi G, Penalba M, Ringwood JV (2016) Nonlinear hydrodynamic models for heaving buoy wave energy converters. In: 3rd Asian wave and tidal energy conference, Singapore, pp 144–153.
Guo B, Patton RJ (2017) Non-linear viscous and friction effects on a heaving point absorber dynamics and latching control performance. IFAC-PapersOnLine 50(1):15657–15662. https://doi.org/10.1016/j.ifacol.2017.08.2394
ITTC -Recommended procedures and guidelines (2011) Practical guidelines for ship CFD applications. In: 26th |ITTC specialist committee on CFD in marine hydrodynamics,7.5 – 03 – 02 – 03, Rio de Janeiro, Brazil. https://ittc.info/media/1357/75-03-02-03.pdf
Jin S, Patton RJ, Guo B (2018) Viscosity effect on a point absorber wave energy converter hydrodynamics validated by simulation and experiment. Renew Energy 129:500–512. https://doi.org/10.1016/j.renene.2018.06.006
Journee JMJ, Massie WW (2001) Offshore hydromechanics. Delft University of Technology, Delft
Kalofotias F (2016) Study for the hull shape of a wave energy converter point absorber; design optimization & modeling improvement, Master’s thesis, University of Twente. http://purl.utwente.nl/essays/70530
Koca K, Kortenhaus A, Oumeraci H, Zanuttigh B, Angelelli E, Cantù M, Suffredini R, Franceschi G (2013). Recent advances in the development of wave energy converters. In: The 10th European wave and tidal energy conference, Aalborg, Denmark
Kolios A, Di Maio LF, Wang L, Cui L, Sheng Q (2018) Reliability assessment of point-absorber wave energy converters. Ocean Eng 163:40–50. https://doi.org/10.1016/j.oceaneng.2018.05.048
Li Y, Yu Y-H (2012) A synthesis of numerical methods for modeling wave energy converter-point absorbers. Renew Sustain Energy Rev 16(6):4352–4364. https://doi.org/10.1016/j.rser.2011.11.008
Molin B, Ferziger J (2003) Hydrodynamique des structures offshore. Appl Mech Rev 56(2):B29. https://doi.org/10.1115/1.1553447 (French)
Morison JR, Obrien MP, Johnson JW, Schaaf SA (1950) The force exerted by surface waves on piles. J Petrol Technol 2(05):149–154
Musiedlak P, Ransley E, Greaves D, Child B, Hann M, Iglesias G (2017) Investigation of model validity for numerical survivability testing of WECs. In: The 12th European wave and tidal energy conference, Cork, Ireland
Ogilvie TF (1964) Recent progress toward the understanding and prediction of ship motions. The 5th Symposium on Naval Hydrodynamics, Bergen, Norway, 3–80. http://resolver.tudelft.nl/uuid:5accdabd-b484-4450-9613-e1d2c5ee211e
Payne GS (2006) Numerical modelling of a sloped wave energy device. Dissertation, The University of Edinburgh. http://hdl.handle.net/1842/15607
Penalba M, Davidson J, Windt C, Ringwood JV (2018) A high-fidelity wave-to-wire simulation platform for wave energy converters: Coupled numerical wave tank and power take-off models. Appl Energy 226:655–669. https://doi.org/10.1016/j.apenergy.2018.06.008
Ransley EJ (2015) Survivability of wave energy converter and Mooring coupled system using CFD. Dissertation, 281. University of Plymouth. http://hdl.handle.net/10026.1/3503
Ransley EJ, Greaves D, Raby A, Simmonds D, Hann M (2017) Survivability of wave energy converters using CFD. Renew Energy 109:235–247. https://doi.org/10.1016/j.renene.2017.03.003
Sarpkaya, T (1976) In-line and transverse forces on smooth and sand-roughened cylinders in oscillatory flow at high Reynolds numbers. http://hdl.handle.net/10945/60923
Sumer BM, Fredsøe J (2006) Hydrodynamics around cylindrical structures. Adv Ser Ocean Eng. https://doi.org/10.1142/6248
Windt C, Davidson J, Ringwood JV (2018) High-fidelity numerical modelling of ocean wave energy systems: A review of computational fluid dynamics-based numerical wave tanks. Renew Sustain Energy Rev 93:610–630. https://doi.org/10.1016/j.rser.2018.05.020
White FM (2011) Fluid Mechanichs, 7th edn. McGraw-Hill, New York, p 885
Xie J, Zuo L (2013) Dynamics and control of ocean wave energy converters. Int J Dyn Control 1(3):262–276. https://doi.org/10.1007/s40435-013-0025-x
Acknowledgements
The authors acknowledge the support from the Brazilian Research Council (CNPq), contract numbers 380950/2018-9 (INEOF-National Institute for Ocean and River Energy) and 305657/2017-8, respectively. Special thanks to FAPERJ for the support of the wave energy research at the Subsea Technology Lab (COPPE), contract number E-26/202.600/2019.
Author information
Authors and Affiliations
Corresponding author
Additional information
Publisher's Note
Springer Nature remains neutral with regard to jurisdictional claims in published maps and institutional affiliations.
Appendix
Appendix
1.1 Mesh sensitivity study
The mesh sensitivity study of the buoy b107 uses the free decay test developed by Jin et al. (2018), see Fig. 13. The experimental test shows that after 3.5 s the buoy suffered a slight mechanical friction, which prevented its free movement. This explains the difference between the CFD and experimental results in the last amplitude.

Mesh sensitivity study, buoy b107
The decay test simulation uses two symmetrical planes that pass through the vertical axis of each buoy. The symmetrical planes avoid high computational cost. The mesh sensitivity study focused on the free surface around the buoy. Different sizes of elements are tested before obtaining the first numerical result close to the experimental result, Mesh 1. From Mesh1, a sensitivity analysis is developed focused on the refinement and dimensions of the NWT, Mesh 2 and Mesh 3. The element size is 0.0124 m for Mesh 1, and 0.0062 m for Mesh 2 and Mesh 3. Mesh 1 and Mesh 2 considered the width of the NWT shown in Fig. 3. Mesh 3 considered the dimension of NWT with the same width of the experimental tank in Jin et al. (2018), 6 m. Mesh 2 and Mesh 3 show good agreement with the experimental result (amplitude and period). Therefore, for the free surface around each buoy the element size is 0.0062 m. Considering the Mesh 3, Fig. 14 shows the displacement and velocity of the buoy b107 in the decay test.

Displacement and velocity of the decay test, buoy b107
1.2 Laminar model
In this research a laminar solution is assumed. Different analysis are presented below that justify that a laminar solution is enough in the present work:
-
First analysis, the oscillating flow around the buoy. Since the hydrodynamics of cylindrical structures in oscillatory flows, the Keulegan–Carpenter (KC) number and the Reynolds number (Re), are defined by
$$\text{Re}=\frac{\rho {U}_{\text{m}}D}{\mu }$$(18)$$\text{KC}=\frac{{U}_{\text{m}}{T}_{\text{w}}}{D}$$(19)where \(\mu\) is the dynamic viscosity of the water, \({U}_{\text{m}}\) is the amplitude of the horizontal flow velocity, \({T}_{\text{w}}\) is the wave period, and \(D\) is the diameter of the cylinder. The values of KC and Re numbers are equal to 0.85 and 4.5 × 10⁴, respectively. For the calculated KC, the orbital motion of the water particles around the body wall does not show a clear turbulent behavior according to Sumer and Fredsøe (2006). Similar values of KC and Re numbers are considered in Devolder et al. (2018), where the results of laminar CFD simulation showed good agreement with experimental results.
-
Second analysis, the flow of the buoy wall is analyzed as a flat plate. Applying the latching control system without PTO (wave height = 0.08 m), the maximum relative velocity recorded between flow and body is 0.78 m/s, buoy b107. Considering a characteristic length as the sum of the draft (0.28 m) plus maximum amplitude of motion (0.126 m) of buoy b107, the Re on the wall of the body is 3 × 10⁵ and is less than critical Reynolds for a flat plate, 5 × 10⁵ (steady flow). Considering the latching control system and laminar CFD solutions, Giorgi and Ringwood (2016) and Giorgi et al. (2016) show good results for a heaving-buoy wave energy converter. Laminar CFD solutions are also observed in Devolder et al. (2016, 2018), Giorgi et al. (2016) and Anbarsooz et al. (2014).
-
Third analysis, behavior of the vortices on the sharp edge of the cylinder. As expected, the numerical results show vortices in the lower part of the buoy, see Figs. 15 and 16. They are of low intensity and with little interaction with the body wall. The vorticity field shows that there is no beginning of a chaotic flow behavior as in turbulent flow with eddies of different length scales. The vortices generated are well-defined structures. They do not show signs of breakdown, because the injection of kinetic energy is not enough and is not constant. The latching duration contributes to decreasing in vortex intensity when the body begins its movement.
Fig. 15 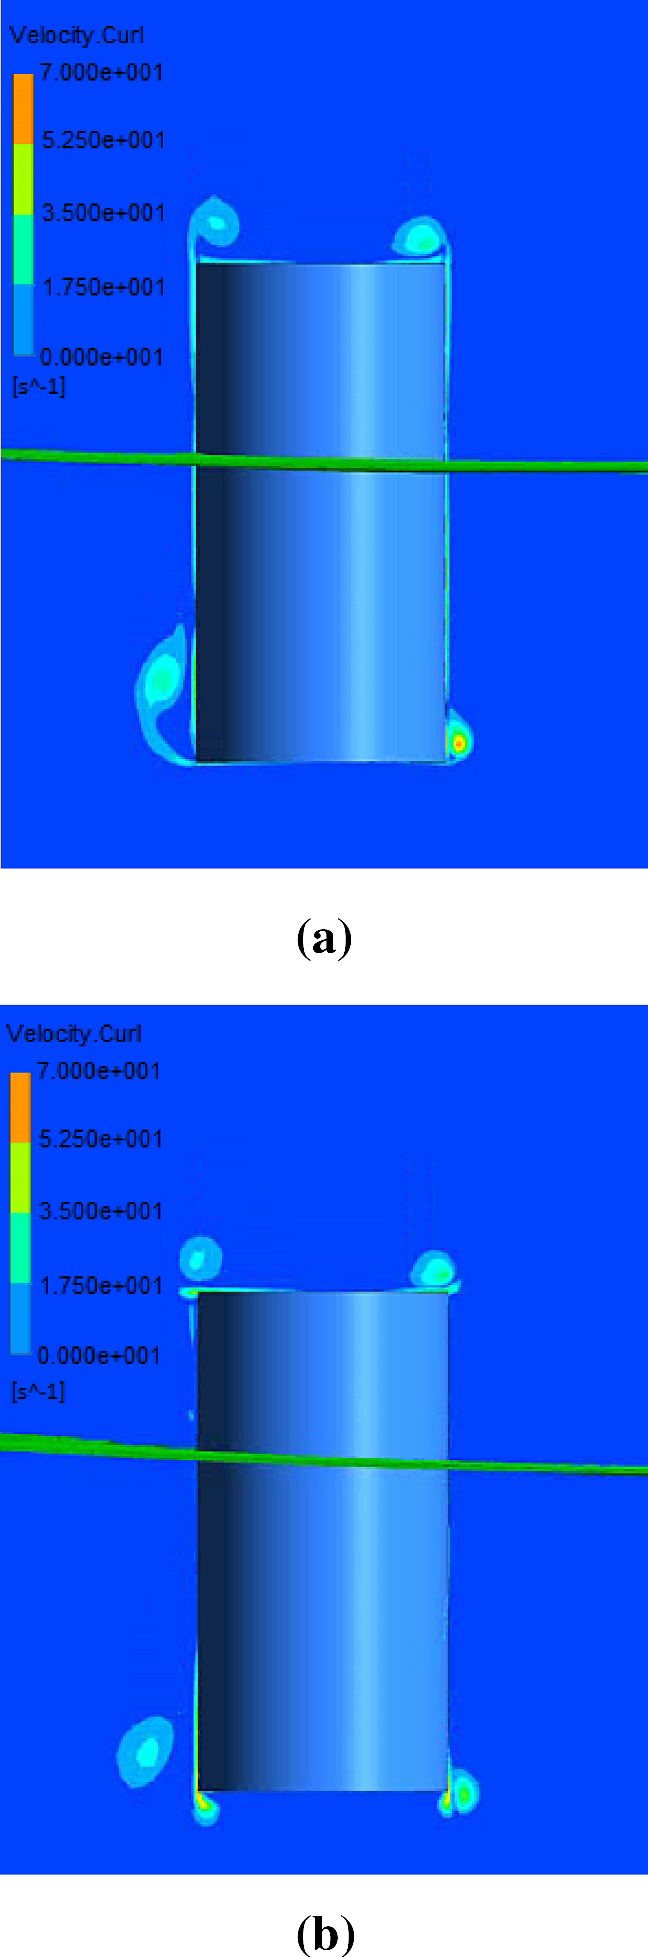
Free surface and vorticity field (in the plane of symmetry) around b107 downwards, latching duration 0.2 s, wave direction (from left to right), (a) before maximum amplitude, (b) at maximum amplitude
Fig. 16 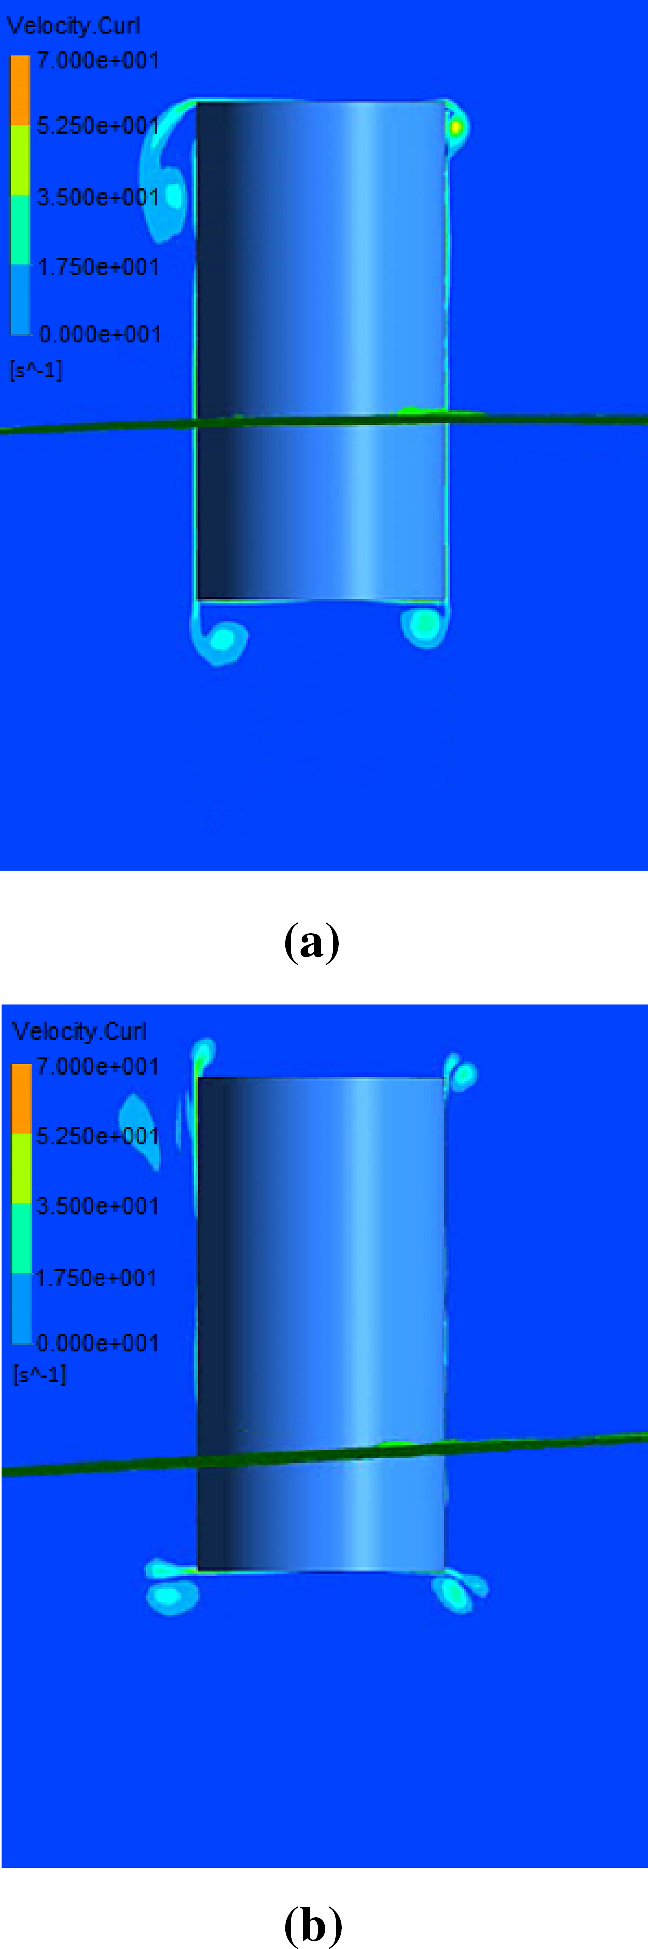
Free surface and vorticity field (in the plane of symmetry) around b107 upwards, latching duration 0.2 s, wave direction (from left to right), (a) before maximum amplitude, (b) at maximum amplitude
-
Fourth analysis, experimental decay test. Laminar solution reproduced the experimental decay test of buoy b107 satisfactorily, see Fig. 14. This numerical result shows a maximum velocity equal to 0.87 m/s, higher than the maximum relative velocity obtained using the latching control system, 0.78 m/s (without PTO).
-
Finally, from the point of view of the numerical solution stability, the laminar flow solution always showed stability, indicating that there is no evidence of a possible transition from laminar to turbulent flow. In view of the previous discussion, the laminar CFD solution is justified in this work. It is important to mention that when PTO is applied the amplitude and velocity of each buoy are reduced. Based on numerical simulation, the maximum velocity of the buoy obtained with PTO is 0.47 m/s, which corresponds to the buoy b010 and a wave height of 0.1 m.


The vorticity field of Figs. 15 and 16 is described in more detail, only the vortices generated in the water are analyzed. When the buoy goes down, Fig. 15a, vorticity detaches from the lower body. When the body reaches the maximum amplitude, Fig. 15b, vorticity detaches from the wall. Finally, both generated vortices show destructive interaction, because they have opposite rotation. When the buoy goes up, Fig. 16a, the vorticity detaches from the wall. In addition, at the maximum amplitude, Fig. 16b, the vorticity detaches from the lower body. Again, an adverse interaction occurs between the generated vortices. The latching duration contributes to decreasing in vortex intensity when the body begins its movement. In Figs. 15a and 16a, the movement of the water particles of the incoming waves affects the vortices generated, stretching their structure. When the PTO system is applied, the intensity of vortices decreases, because the buoy velocity also decreases.
1.3 Latching duration
The latching duration represents the parameter that defines the efficiency of the latching control system. Based on CFD, the approximation of the optimum constant latching duration for each buoy is calculated by testing different latching durations for a regular wave of height and period of 0.08 m and 1.66 s, respectively. According to Fig. 17 the optimum latching duration for buoy b060, b107 and b154 are 0.04 s, 0.20 s and 0.18 s, respectively. PTO is not considered in this analysis.

Buoy amplitude versus latching duration, PTO is not considered
Rights and permissions
About this article

Cite this article
Avalos, G.O.G., Estefen, S.F. Viscous effect for heaving cylindrical point absorbers controlled by a latching control system and a novel approach to viscous force. J. Ocean Eng. Mar. Energy 7, 363–378 (2021). https://doi.org/10.1007/s40722-021-00205-y
Received:
Accepted:
Published:
Issue Date:
DOI: https://doi.org/10.1007/s40722-021-00205-y