
Abstract
Recent years have witnessed increasing use of positron emission tomography (PET) in cancer staging and monitoring. In particular, 18F-fluoro-2-deoxy-d-glucose (FDG) has frequently been used in clinical practice for tumor detection, staging, and gross tumor volume definition in different cancer sites. More recently, there has been accumulating evidence that pre- and intra-treatment FDG uptake could be used as a prognostic factor for predicting cancer treatment outcomes. Typically, quantitative analysis of FDG uptake is based on observed changes in the standardized uptake value (SUV). However, SUV descriptors themselves might be influenced by the initial FDG uptake intensity, radiotracer distribution, and changes in tumor volume. These factors and others might make this approach prone to significant intra- and inter-observer variability. Alternatively, more recent efforts have been directed toward the use of advanced image feature analysis techniques as part of the emerging field of radiomics. In this work, we review recent advances and discuss current challenges regarding the use of PET imaging for predicting cancer outcomes. We discuss issues related to image feature extraction, statistical modeling, tracer type, and combination with other imaging modalities for the purpose of developing robust PET-based models of treatment outcomes. We provide examples based on our experience, and that of others, of PET imaging used alone or with other complementary modalities for predicting outcomes in radiotherapy and their application in personalizing treatment through dose painting. We also highlight the potential opportunities in this field for personalizing cancer treatment and improving clinical decision making.
Introduction
Positron emission tomography (PET) imaging is increasingly used in oncology in general, and in radiation oncology in particular, for the purposes of diagnosis, grading, staging and assessment of treatment response. For instance, PET imaging with 18F-fluoro-2-deoxy-d-glucose (FDG), a glucose metabolism analog, has been applied for the diagnosis, staging and treatment planning of lung cancer [1–10], head and neck cancer [11, 12], prostate cancer [13], cervical cancer [14, 15], colorectal cancer [16], lymphoma [17, 18], melanoma [19] and breast cancer [20–22]. Moreover, there is accumulating evidence that pre-treatment or post-treatment FDG PET uptake could be used as a prognostic factor for predicting outcomes [23–27]. This suggestion was motivated by the fact that tumor uptake is dependent on the characteristics of its microenvironment, which may influence treatment response. For instance, in a pre-clinical study, FDG uptake appeared to be positively correlated with hypoxia and negatively correlated with proliferation and perfusion [28]. Besides FDG, other PET tracers have been shown to be useful biomarkers for interrogating tumor properties that could affect response to therapy such as blood flow, investigated using 15O-water; hypoxia using 18F-fluoromisonidazole (FMISO) or 64Cu-diacetyl-bis(N(4)-methylthiosemicarbazone) (Cu-ATSM); and DNA synthesis and cell proliferation using 18F-fluorothymidine (FLT) and 18F-1-(2′-deoxy-2′-fluoro-β-d-arabinofuranosyl)-thymine (FMAU) [29]. Tumor oxygenation could be evaluated using Cu-ATSM [30] or FMISO [31], both of which have been shown to correlate with treatment failure. Cellular proliferation may be measured with radiolabeled nucleosides, such as FLT. In an experimental model, changes in FLT uptake post-irradiation were shown to be more pronounced than changes in FDG uptake and to correlate well with the proliferative activity of transplanted tumors [32]. In a pilot study, it was shown that FLT can be used to monitor changes in cellular proliferation in lung cancer patients during radical chemoradiotherapy [33].
The extraction of quantitative information from imaging modalities and the relating of this extracted information to biological and clinical endpoints is the subject of a new emerging field referred to as ‘radiomics’ [34, 35]. Traditionally, quantitative analysis of uptake of FDG or of other PET tracers is based on observed changes in the standardized uptake value (SUV). For instance, decreased SUVs post-irradiation have been associated with better outcomes in lung cancer [36, 37]. However, SUV measurements themselves are potentially prone to errors due to the initial FDG uptake kinetics and radiotracer distribution, which are dependent on the initial radiotracer injected activity and the time elapsing between the tracer injection and the image acquisition. In addition, some commonly reported SUV measurements might be sensitive to changes in tumor volume definition (e.g., mean SUV). These factors and others might make such an approach subject to significant intra- and inter-observer variability [25, 27, 38].
Several approaches have been proposed in the literature to overcome the limitations of simple SUV descriptors. A visual assessment method was used by Kalff et al. [25] to evaluate heterogeneity in FDG images from patients with locally advanced rectal carcinoma. Hicks et al. [27] applied a simple pattern recognition technique to FDG images of lung cancer and found that inflammatory changes correlated with tumor response suggesting that tumor radioresponsiveness and normal tissue radiosensitivity may be linked. However, more recent approaches have focused on the application of more advanced image-based features to distinguish responders from non-responders to therapy. Moreover, the extraction of relevant image features to a particular clinical endpoint remains a challenging task. This is an emerging area in outcomes research that innovative approaches developed in the field of radiomics aim to investigate. The problem of radiomics could be posed as an engineering pattern recognition problem [38–40], which requires an understanding of the observed clinical endpoint and the underlying characteristics of the imaging modality considered. Image-derived features can generally be divided, according to their nature, into spatial (static) and temporal (dynamic) features or combinations of the two. Static image features would include intensity histogram analysis, shape and morphology, and texture/roughness. These image-based features can provide better spatial characterization of uptake heterogeneity than the simple SUV descriptors currently employed [38] and might therefore result in improved ability to predict treatment outcomes [41]. Dynamic features are extracted from time-varying acquisition protocols such as dynamic PET or MR. These features are based on kinetic analysis using, for example, tissue compartment models and parameters related to tracer transport and binding rates, and they can provide radiomics modelers with valuable temporal information about tracer uptake variability [42].
In addition to the valuable physiological information (tumor metabolism, proliferation, necrosis, hypoxic regions, etc.) that can be collected from PET, additional knowledge can be gained from incorporating other imaging modalities that provide anatomical information, thereby making it possible to improve treatment planning, monitoring and prognosis in different cancer sites. For instance, changes in tumor volume captured on CT may be predictive of local tumor control in lung cancer patients [43, 44]. Interestingly, recent studies show that rectum status (full/empty) or the presence of bowel gas at the time of treatment planning may predict treatment failure [45] and the risk of rectal bleeding [46], probably due to a shift of the irradiation field compared to anatomy upon delivery. The complementary nature of different imaging modalities has led to direct efforts toward combining the physical and biological information they provide to achieve better treatment outcomes. For example, PET/CT has been utilized for staging, planning and assessment of response to radiation therapy in different cancer sites including lung, gynecological, and colorectal cancers [47]. Denecke et al. [48] compared CT, MRI and FDG PET in the prediction of outcome of neoadjuvant radiochemotherapy in patients with locally advanced primary rectal cancer, demonstrating sensitivities of 100 % for FDG PET, 54 % for CT, and 71 % for MRI, and specificities of 60 % for FDG PET, 80 % for CT, 67 % for MRI. Benz et al. [49] showed that combined assessment of metabolic and volumetric changes predicts tumor response in patients with soft-tissue sarcomas. Similarly, Yang et al. [50] showed that the combined evaluation of contrast-enhanced CT and FDG PET/CT predicts clinical outcomes in patients with aggressive non-Hodgkin’s lymphoma.
In this review, we will describe different imaging features used for characterizing tumor behavior. We will provide a review of the statistical modeling techniques that could be applied to integrate these different features for the purpose of developing robust PET-based models of treatment outcomes and discuss their application in personalizing treatment using techniques such as dose painting. We also discuss current issues and challenges and highlight the potential opportunities in this field for personalizing cancer treatment and improving clinical decision making in oncology.
PET image-based features
The features extracted from PET images (radiomics) can be divided into static (time-invariant) and dynamic (time-varying) features according to the acquisition protocol at the time of scanning and into pre- or intra-treatment features according to the scanning time point. Examples of static and dynamic features used in the literature are described below and summarized in Table 1.
Static PET features
-
(a)
SUV descriptors: SUV measurement is a standard method in quantitative analysis of PET images [51]. In this case, raw intensity values are converted into SUVs and statistical descriptors such as maximum, minimum, mean, standard deviation (SD), and coefficient of variation (CV) are extracted. An example is shown in Fig. 1, which shows PET-based nomograms for predicting cervical cancer treatment response [52].
Fig. 1 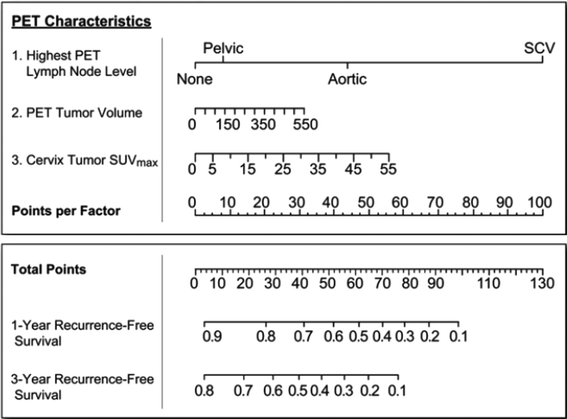
FDG PET-based prognostic nomograms using PET lymph node involvement, cervical tumor SUVmax, and PET tumor volume for recurrence-free survival (reproduced with permission from Ref. [52])
-
(b)
Total lesion glycolysis (TLG): This is defined as the product of tumor volume and mean SUV [5, 49, 53].
-
(c)
Intensity–volume histogram (IVH): This is analogous to the dose–volume histogram widely used in radiotherapy treatment planning to reduce complicated 3D data to a single curve that is easier to interpret. Each point on the IVH defines the absolute or relative volume of the structure (tumor or normal tissue) that exceeds a variable intensity threshold as a percentage of the maximum intensity [38]. This method allows the extraction of several metrics from PET images for outcome analysis, such as I x (minimum intensity to x% highest intensity volume), V x (percentage volume having at least x% intensity value), in addition to descriptive statistics (mean, minimum, maximum, SD, etc.). We have previously reported examples of the use of the IVH approach for predicting local control in lung cancer from PET/CT images [54].
-
(d)
Morphological features: These are generally geometrical shape attributes such as eccentricity (a measure of non-circularity), which is useful for describing tumor growth directionality; Euler number (the number of connected objects in a region minus the number of holes), which is useful for describing tumors with necrotic regions; and solidity (this is a measurement of convexity), which may be a characteristic of benign versus malignant lesions [55, 56]. In an interesting demonstration of this principle, a shape-based metric, based on the deviation from an idealized ellipsoid structure (i.e., eccentricity), was found to provide an indication of metastatic behavior in tumors and showed a strong association with survival in patients with sarcoma [56, 57]. A more advanced extension of this approach has recently been developed, which utilizes a tubular representation of the sarcoma structure with simplified radial analysis of FDG uptake. Interestingly, this approach could be used to distinguish between early phases of tumors characterized by high uptake at the core, and later advanced stages, characterized by central necrotic regions (voids in uptake) [58].
-
(e)
Textural features: Texture in imaging refers to the relative distribution of intensity values within a given neighborhood. It integrates intensity with spatial information resulting in higher order histograms (probability distributions) as opposed to conventional first-order intensity histograms. It worth emphasizing that texture metrics are independent of tumor position, orientation, size and brightness, and take into account the local intensity-spatial distribution [59, 60]. This is a crucial advantage over direct (first-order) histogram metrics (e.g., mean and SD), which only measure intensity variability independent of the underlying spatial distribution in the tumor microenvironment. Texture methods are broadly divided into three categories: statistical methods (e.g., high-order statistics, co-occurrence matrices, moment invariants), model-based methods (e.g., Markov random fields, Gabor filter, wavelet transform), and structural methods (e.g., topological descriptors, fractals) [61, 62]. Among these methods, statistical approaches based on the co-occurrence matrix and its variants such as the gray level co-occurrence matrix (GLCM), neighborhood gray tone difference matrix (NGTDM), run-length matrix (RLM), and gray level size-zone matrix (GLSZM) have been widely applied for characterizing FDG PET heterogeneity [63]. Four commonly used features from the GLCM include (Table 2): energy, entropy, contrast, and homogeneity [60]. The NGTDM is thought to provide more human-like perception of texture such as (Table 3): coarseness, contrast, busyness, and complexity [64]. RLM and GLSZM emphasize regional effects. Textural features were shown to predict response in cancers of the cervix [38], esophagus [65], head and neck [66], and lung [67]. In addition, textural features from FLT PET were demonstrated to quantify intra-tumor proliferation heterogeneity in breast cancer treated with chemotherapy [68]. MaZda is a dedicated software for image texture analysis [69].
Table 2 Selected GLCM (P ij ) features for analysis of PET data Table 3 Selected NGTDM with s i being the ith entry and p i the probability of occurrence of gray tone i in the PET data

Figures 2, 3, 4 show examples of the use of the IVH and texture in different scenarios: in FDG PET of cervical cancer (Fig. 2), FDG PET/CT of lung cancer (Fig. 3), and multi-tracer imaging (FDG/Cu-ATSM PET) of cervical cancer (Fig. 4).

Left patient A and right patient B data. a PET scan of cervical tumor showing the region of interest (brown) and the 40 % maximum SUV delineated tumor (green). b Intensity–volume histogram (IVH) plots. Surface plots of the co-occurrence matrix for c cervical tumor ROI and d 40 % maximum SUV delineated tumor. Note that patient B’s tumor seems to be more heterogeneous. This could be inferred visually from the shallowness of the IVH, and the spread of the co-occurrence plot (reproduced with permission from Ref. [38]) (color figure online)

Pre-treatment PET/CT image of a patient with NSCLC who failed locally. a PET/CT overlaid image. b Intensity–volume histograms (IVH) of b CT and c PET, respectively. d, e Are the texture maps of the corresponding region of interest for CT (intensity bins equal 100 HU) and PET (intensity bins equal 1 unit of SUV), respectively. Note the variability between the CT and PET features: the PET IVH and GLCM matrices show much greater heterogeneity for this patient. Importantly, the amount of PET and CT gross disease image heterogeneity varies greatly between patients (color figure online)

The two rows, referring to an individual patient with primary cervical cancer, show texture maps for FDG (metabolic marker) and Cu-ATSM (hypoxia marker) alone, and overlapping texture maps of the two markers (color figure online)
Dynamic PET features
These features are based on kinetic analysis using tissue compartment models and parameters related to tracer transport and its binding rates [42]. In the case of FDG, a three-compartment model can be used to depict the trapping of FDG-6-phosphate in tumors [70, 71]. In Fig. 5, we show an example of estimation of kinetic parameters from dynamic FDG PET compartmental modeling. The glucose metabolic uptake rate can be evaluated using these estimated kinetic parameters. The uptake rate and other compartment estimates themselves can be used to form “parameter-map” images. Image features, including the previously described static ones such as IVH or texture, can be derived from these parameter maps. The literature reports examples of the use of dynamic features for predicting response. The glucose metabolic rate was correlated with pathologic tumor treatment response in lung cancer [72]. Thorwarth et al. [73, 74] published interesting data on the scatter of voxel-based parameter maps of local perfusion and hypoxia in head and neck cancer. Tumors showing greater variation in local perfusion and hypoxia showed less reoxygenation during a course of radiotherapy and had worse treatment outcomes.

General compartmental model of tracer kinetics in a tumor. For instance, in case of FDG, C p(t) denotes the plasma input function, which could be estimated from blood sampling or using reference tissue models; C f(t) the concentration of un-phosphorylated (free) FDG; and C b(t) the concentration of FDG-6-phosphate (bound). The bi-directional transport across the membrane via GLUTs is represented by the rate-constants K 1 and k 2 , the phosphorylation of FDG is denoted by k 3 while the action of G6-phophatase is represented with rate constant k 4 . Using estimates of compartmental modeling, measures of metabolic uptake rate (K) could be evaluated by the relation K = K 1 × k 3 /(k2 + k4) by simple solution of the ordinary differential equation of the corresponding system (color figure online)
Outcome modeling
Outcomes in oncology and particularly in radiation oncology are characterized by tumor control probability (TCP) and the surrounding normal tissue complication probability (NTCP) [75, 76]. We have previously presented a detailed review of outcome modeling in radiotherapy [77]. DREES is a dedicated software tool for modeling radiotherapy response [78]. In the context of the modeling of image-based treatment outcomes, the observed outcome (e.g., TCP or NTCP) is considered to be adequately captured by extracted image features [38, 40]. We will highlight this approach using logistic regression and machine learning methods.
Logistic regression
Logistic modeling is a common tool for multi-metric (multi-variable) modeling. In our previous work [79, 80], a logit transformation, which has a sigmoidal response shape, was used:
where n is the number of cases (patients), x i is a vector of the input variable values (i.e., static and/or dynamic image features) used to predict f(x i ) for outcome y i (i.e., TCP or NTCP) of the ith patient. The ‘x-axis’ summation is given by:
where d is the number of model variables and the β’s are model coefficients determined by maximizing the probability of the data giving rise to clinical events (i.e., TCP or NTCP). Resampling methods such as cross-validation (e.g., leave-one-out cross-validation or Jackknife) and bootstrapping (e.g., sampling with replacement) methods could be used to determine optimal model order and parameter selection as shown in the example of multi-metric modeling in lung cancer using FDG PET/CT features shown in Fig. 6 [54]. A major weakness in using this formalism, however, is that the model has limited capacity to follow details of the data trends (i.e., the model has a limited learning capacity when dealing with complex relationships that might be embedded in the data). In addition, Eq. (2) requires the user’s feedback to determine whether interaction terms or higher order variables should be added, making it a trial-and-error process. A solution to mitigate this problem is offered by applying machine learning methods as discussed below.

Multi-metric modeling of local failure from PET/CT features. a Model order selection using leave-one-out cross-validation. b Most frequent model selection using bootstrap analysis. c Plot of local failure probability as a function of patients binned into equal-size groups showing the model prediction and the original data (reproduced with permission from Ref. [54]) (color figure online)
Machine learning
Machine learning is a branch of artificial intelligence that deals with the design and development of computational and statistical methods for learning from data [81, 82]. A class of machine learning methods that is particularly powerful and computationally efficient for image-based outcome prediction applications in oncology includes so-called Kernel-based methods and their most prominent sub-type, support vector machines (SVM). These methods have been applied successfully in many diverse areas including outcome prediction [40, 83–86].
Learning is defined in this context as estimating dependencies from data [82]. There are two common types of machine learning: supervised and unsupervised. Supervised learning is used to estimate an unknown (input, output) functional mapping from known (input, output) sample pairs (e.g., classification or regression applications). On the other hand, in unsupervised learning no functional mapping is estimated and only input samples are given to the learning system (e.g., clustering or dimensionality reduction applications). In the example of outcome prediction (i.e., discrimination between patients who are at low risk versus patients who are at high risk of local treatment failure), the main function of the kernel-based technique would be to separate these two classes with ‘hyper-planes’ that maximize the margin (separation) between the classes in a nonlinear feature space. The objective here would be to minimize the bounds on the generalization testing error of a model based on previously unseen data (out-of-sample data) rather than to minimize the mean square error over the training dataset itself (data fitting).
Mathematically, the optimization problem could be formulated as minimizing the following cost function:
subject to the constraint:
where w is a weighting vector and \( \varPhi ( \cdot ) \) is a nonlinear mapping function from the input data space to the feature space, where the samples can be easily separated. The ζ i represents the tolerance error allowed for each sample to be on the wrong side of the margin (called hinge loss). Note that minimization of the first term in Eq. (3) increases the separation (margin) between the two group classes, of low versus high risk of treatment failure, whereas minimization of the second term improves fitting accuracy. The trade-off between complexity (or margin separation) and fitting error is controlled by the regularization parameter C. However, such a nonlinear formulation would suffer from the curse of dimensionality (i.e., the dimensions of the problem become too large to solve) [82, 87]. Therefore, the dual optimization problem is solved instead of the primal problem in Eqs. (3, 4), which turns out to be convex and its computational complexity becomes dependent only on the number of samples and not on the dimensionality of the feature space. Moreover, the prediction function in this case is characterized only by a subset of the training data, each of which is then known as a ‘support vector’ s i :
where n s is the number of support vectors (i.e., samples at the boundary), α i are the dual coefficients determined by quadratic programming, and K(·, ·) is the kernel function. Typical kernels (mapping functionals) include:
where c is a constant, q is the order of the polynomial, and σ is the width of the radial basis (Gaussian) functions. Note that the kernel in these cases also acts as a similarity function between sample points (support vectors) in the feature space determining their classification group and their corresponding probabilities. An example of applying kernel-based approaches to TCP modeling in lung cancer is shown in Fig. 7 [88].

An example of a kernel-based approach for modeling TCP in lung cancer. a Kernel-based mapping from a lower dimensional space (X) to a higher dimensional space (Z) called the feature space, where non-separable classes become linearly separable. b Logistic regression. c Nonlinear kernels with overlaid training points. d Comparison of different TCP models, binned by the predicted rate of local control. Note that the best performance was achieved by the nonlinear model (SVM-RBF) (reproduced with permission from Ref. [88]) (color figure online)
Performance evaluation and validation methods
Evaluation metrics
To evaluate the performance of statistical classifiers in PET-based outcome models, one can use the Matthew’s correlation coefficient (MCC) [89] as a performance evaluation metric for classification. An MCC value of 1 would indicate perfect classification, a value of −1 would indicate anti-classification, and a value close to zero would mean no correlation. Alternatively, one can use the area under the receiver–operating characteristics (AU-ROC) curve [90]; MCC and AU-ROC tend to be proportional, with ROC giving a more pictorial representation of the performance. In the case of PET-based regression outcome models, Spearman rank correlation has been widely applied, as it provides a simple robust estimator of trend, which need not necessarily show a linear relationship as in the case of Pearson correlation coefficient [91].
Statistical validation
Model selection could be conducted and evaluated using information theoretic metrics (e.g., Akaike information criteria or Bayesian information criteria) and statistical resampling methods (e.g., cross-validation or bootstrapping). These methods are useful for performance comparison purposes and when applied properly can provide statistically sound results about bias, variance, confidence intervals, prediction error and the generalizability of a derived outcome prediction model particularly when the available dataset(s) for training, validation and testing is(are) limited [92, 93].
PET-based dose painting
An interesting application for PET-based outcome modeling is found in personalized radiotherapy treatment planning, in which areas of suspected radiation resistance can be painted with higher radiation dose per fraction and total dose to achieve better tumor local control (TCP) and reduce the possible risk of distant failure while maintaining a similar, normal level of tissue toxicity (NTCP). In this context, dose painting is defined as the process of prescribing non-uniform radiation dose distribution to the targeted tumor volume based on functional or molecular imaging information relevant to treatment response [94–96]. The main strategies that have been considered in the literature can be divided into subvolume boosting and painting by numbers or a hybrid approach of both.
Subvolume boosting
This dose-painting strategy involves dividing the targeted tumor volume into discrete regions following the so-called Fletcher’s volume of cancer hypothesis [97], according to which tumor burden as found from functional imaging can be reduced by simultaneous boost techniques in radiotherapy, for instance. In this case, the radiotherapy plan would consist of delivering the boost (additional radiation doses to the subvolumes) simultaneously with the basic (large-field) treatment in all treatment sessions [98, 99]. Examples of this technique reported in the literature include the successful use of FDG PET to manually delineate tumors into subvolumes for boosting in a phase I study of locally advanced head and neck cancer [100]. Another example, in which FDG PET is used in soft-tissue sarcoma, is shown in Fig. 8; here, the FDG PET uptake in the tumor was thresholded on the basis of percentage SUV levels to define the subvolumes for boosting [101].

Soft-tissue sarcoma dose-painting distributions and dose–volume histogram (DVH) using subregions defined by FDG PET/CT and MRI information. The figure shows the dose-painting distribution on axial, coronal and sagittal views. The DVHs for the different subregions illustrates the conformality and uniformity of the dose-painting process of the escalated regions. These results were confirmed using Monte Carlo (Ref. [101]) (color figure online)
Dose painting by numbers
This dose-painting strategy involves prescribing dose (D) at the image intensity (I) voxel level, for example this could be given by [102]:
As with subvolume boosting, functional and molecular imaging modalities such as PET or MRI could be used for painting by numbers. Several authors have derived more complex mapping schemes that relate the painting process directly or indirectly to predicted TCP [103, 104]. However, the heterogeneity of the resulting dose distribution could be limited by the complexity of radiation delivery in such cases and should be taken into consideration when applying this strategy [95]. Thorwarth et al. [103] demonstrated an example of hypoxia dose painting with FMISO, in which a semi-mechanistic modeling approach was proposed and the radiosensitivity parameters of the linear quadratic model were modified according to the retention of FMISO [104].
Issues and recommendations
Structure definition
The ability to distinguish the structure of interest from neighboring structures, i.e., to segment the tumor from surrounding normal tissues, is a necessary prerequisite to subsequent image-based outcome prediction and can significantly impact on subsequent feature extraction as discussed earlier. This process of contouring or segmentation can be carried out manually, which is a pretty laborious task associated with known intra- and inter-observer variability, or it can be performed using automated or semi-automated segmentation algorithms. It was recently reported that definition of the region of interest can impact on some textural features [105]. In our work on PET-guided treatment planning in radiotherapy, we presented a comparative survey of the current methods applied for PET tumor segmentation that could range from simple thresholding to sophisticated pattern recognition approaches [106, 107]. An AAPM task group (TG-211) is currently classifying the different PET auto-segmentation methods to provide guidelines on their advantages and limitations and on the applicability of each class of methods to the different radiation oncology tasks. A promising approach to improve the robustness of PET segmentation is to combine the information it provides with that derived from other modalities such as CT or MR [108, 109].
Robustness and stability
It is well recognized that image acquisition protocols may affect the reproducibility of features extracted from PET images, and that this may consequently affect the robustness and stability of these features for outcome prediction. This applies both to static features such as SUV descriptors [110–112] and textural features [113, 114]. Interestingly, texture-based features were shown to have a reproducibility similar to or better than that of simple SUV descriptors [115]. Moreover, textural features from the GLCM seemed to exhibit lower variations than NGTDM features [113]. Nevertheless, some clinical variables can have a confounding effect on reported texture metrics across different datasets. For example, it has been reported that local entropy, a GLCM textural feature, could be dependent on tumor volume below a certain threshold in cervical cancer [105]. Other factors that may affect the stability of these features include signal-to-noise ratio, partial volume effect, motion artifacts, parameter settings, resampling size, and image quantization [38, 114]. In the case of dynamic features, similar concerns are raised with regard to the variability of kinetic parameter estimates along with the extra scanning time requirements involved [116, 117]. Turkheimer et al. [118] proposed using a multi-resolution Bayesian approach to reduce such variability in dynamic PET. Although certain features may exhibit better robustness than others and would be preferable for outcome modeling, some form of standardization of PET acquisition protocols and pre-processing steps, while accounting for possible clinical confounding effects, may still be necessary to avoid issues related to reproducibility of PET-derived features.
Future directions
The field of quantitative PET for predicting cancer treatment outcomes is still in its infancy. Nevertheless, it is a promising area with great potential for advancing outcome prediction and personalizing treatment management for cancer patients. These models could be used to adapt treatment plans to pre-treatment and intra-treatment responses of tumors and to design individualized treatment plans to achieve increased treatment response effectiveness with fewer side effects. Moreover, the advancement of this field will significantly benefit from the identification of novel PET probes of cancer biology as well as new technological developments in PET hardware and software tools. The use of complementary imaging information such as PET/CT or PET/MR will further improve the quality of extracted image features and lead to a superior ability to predict which tumors are likely to fail or need alternative therapy. These model predictions could be used for dose-painting purposes and/or for adaptation of treatment management using longitudinal scanning protocols.
Conclusion
The role of imaging as a biomarker of radiotherapy response is continuously expanding as part of the emerging of field of radiomics, in which imaging features are correlated with biological and clinical endpoints. In this review, we categorized PET extracted features as static (time-invariant) or dynamic (time-varying) features according to the scanning acquisition protocol. Static features include SUV descriptors, IVH, morphological and textural features. Among these features, texture analysis has received the most attention due to its ability to discern tumor uptake heterogeneity. Dynamic features are derived from kinetic analysis and can provide temporal information about PET uptake biodistribution over time. We provided an overview of the statistical modeling techniques that could be applied to integrate these different features for the purpose of developing robust PET-based models of treatment outcomes and we presented examples using logistic regression and machine learning algorithms. We also discussed the application of such PET-based models in dose painting. The use of multiple tracers or multimodality imaging such as PET/CT or PET/MR will provide a wealth of information to improve the prediction power of these models. Current major issues in this field include standardization of tumor segmentation and the acquisition parameter effects on the stability and robustness of these features for predicting outcomes from one institutional dataset to another. PET-based predictive modeling is an evolving area for personalizing cancer treatment that includes applications such as dose painting and adaptive radiotherapy. However, the field is still in its infancy and would significantly benefit from collaborative efforts by the various different communities of stakeholders in nuclear medicine, oncology, radiation biology and bioinformatics to overcome current challenges and realize its potential for promoting informed clinical decision making in oncology.
References
Verhagen AF, Bootsma GP, Tjan-Heijnen VC, van der Wilt GJ, Cox AL, Brouwer MH et al (2004) FDG-PET in staging lung cancer: how does it change the algorithm? Lung Cancer 44:175–181
Bradley J, Thorstad WL, Mutic S, Miller TR, Dehdashti F, Siegel BA et al (2004) Impact of FDG-PET on radiation therapy volume delineation in non-small-cell lung cancer. Int J Radiat Oncol Biol Phys 59:78–86
Bradley JD, Perez CA, Dehdashti F, Siegel BA (2004) Implementing biologic target volumes in radiation treatment planning for non-small cell lung cancer. J Nucl Med 45(Suppl 1):96S–101S
Bradley J (2004) Applications for FDG-PET in lung cancer; staging, targeting, and follow-up. The Radiological Society of North America, Chicago
Erdi YE, Macapinlac H, Rosenzweig KE, Humm JL, Larson SM, Erdi AK et al (2000) Use of PET to monitor the response of lung cancer to radiation treatment. Eur J Nucl Med 27:861–866
Mac Manus MP, Hicks RJ (2003) PET scanning in lung cancer: current status and future directions. Semin Surg Oncol 21:149–155
Mac Manus MP, Hicks RJ, Matthews JP, McKenzie A, Rischin D, Salminen EK et al (2003) Positron emission tomography is superior to computed tomography scanning for response-assessment after radical radiotherapy or chemoradiotherapy in patients with non-small-cell lung cancer. J Clin Oncol 21:1285–1292
MacManus MR, Hicks R, Fisher R, Rischin D, Michael M, Wirth A et al (2003) FDG-PET-detected extracranial metastasis in patients with non-small cell lung cancer undergoing staging for surgery or radical radiotherapy—survival correlates with metastatic disease burden. Acta Oncol 42:48–54
Pandit N, Gonen M, Krug L, Larson SM (2003) Prognostic value of [18F]FDG-PET imaging in small cell lung cancer. Eur J Nucl Med Mol Imaging 30:78–84
Toloza EM, Harpole L, McCrory DC (2003) Noninvasive staging of non-small cell lung cancer: a review of the current evidence. Chest 123:137S–146S
Schwartz DL, Ford E, Rajendran J, Yueh B, Coltrera MD, Virgin J et al (2005) FDG-PET/CT imaging for preradiotherapy staging of head-and-neck squamous cell carcinoma. Int J Radiat Oncol Biol Phys 61:129–136
Suarez Fernandez JP, Maldonado Suarez A, Dominguez Grande ML, Santos Ortega M, Rodriguez Villalba S, Garcia Camanaque L et al (2004) Positron emission tomography (PET) imaging in head and neck cancer. Acta Otorrinolaringol Esp 55:303–309
Oyama N, Miller TR, Dehdashti F, Siegel BA, Fischer KC, Michalski JM et al (2003) 11C-acetate PET imaging of prostate cancer: detection of recurrent disease at PSA relapse. J Nucl Med 44:549–555
Mutic S, Malyapa RS, Grigsby PW, Dehdashti F, Miller TR, Zoberi I et al (2003) PET-guided IMRT for cervical carcinoma with positive para-aortic lymph nodes-a dose-escalation treatment planning study. Int J Radiat Oncol Biol Phys 55:28–35
Miller TR, Grigsby PW (2002) Measurement of tumor volume by PET to evaluate prognosis in patients with advanced cervical cancer treated by radiation therapy. Int J Radiat Oncol Biol Phys 53:353–359
Ciernik IF (2004) Radiotherapy of rectal cancer. Schweiz Rundsch Med Prax 93:1441–1446
Castellucci P, Zinzani P, Nanni C, Farsad M, Moretti A, Alinari L et al (2004) 18F-FDG PET early after radiotherapy in lymphoma patients. Cancer Biother Radiopharm 19:606–612
Spaepen K, Stroobants S, Verhoef G, Mortelmans L (2003) Positron emission tomography with [(18)F]FDG for therapy response monitoring in lymphoma patients. Eur J Nucl Med Mol Imaging 30(Suppl 1):S97–S105
Fogarty GB, Tartaglia CJ, Peters LJ (2004) Primary melanoma of the oesophagus well palliated by radiotherapy. Br J Radiol 77:1050–1052
Biersack HJ, Bender H, Palmedo H (2004) FDG-PET in monitoring therapy of breast cancer. Eur J Nucl Med Mol Imaging 31(Suppl 1):S112–S117
Lind P, Igerc I, Beyer T, Reinprecht P, Hausegger K (2004) Advantages and limitations of FDG PET in the follow-up of breast cancer. Eur J Nucl Med Mol Imaging 31(Suppl 1):S125–S134
Zangheri B, Messa C, Picchio M, Gianolli L, Landoni C, Fazio F (2004) PET/CT and breast cancer. Eur J Nucl Med Mol Imaging 31(Suppl 1):S135–S142
Brun E, Kjellen E, Tennvall J, Ohlsson T, Sandell A, Perfekt R et al (2002) FDG PET studies during treatment: prediction of therapy outcome in head and neck squamous cell carcinoma. Head Neck 24:127–135
Hope AJ, Saha P, Grigsby PW (2006) FDG-PET in carcinoma of the uterine cervix with endometrial extension. Cancer 106:196–200
Kalff V, Duong C, Drummond EG, Matthews JP, Hicks RJ (2006) Findings on 18F-FDG PET scans after neoadjuvant chemoradiation provides prognostic stratification in patients with locally advanced rectal carcinoma subsequently treated by radical surgery. J Nucl Med 47:14–22
Grigsby PW, Siegel BA, Dehdashti F, Rader J, Zoberi I (2004) Posttherapy [18F] fluorodeoxyglucose positron emission tomography in carcinoma of the cervix: response and outcome. J Clin Oncol 22:2167–2171
Hicks RJ, Mac Manus MP, Matthews JP, Hogg A, Binns D, Rischin D et al (2004) Early FDG-PET imaging after radical radiotherapy for non-small-cell lung cancer: inflammatory changes in normal tissues correlate with tumor response and do not confound therapeutic response evaluation. Int J Radiat Oncol Biol Phys 60:412–418
Pugachev A, Ruan S, Carlin S, Larson SM, Campa J, Ling CC et al (2005) Dependence of FDG uptake on tumor microenvironment. Int J Radiat Oncol Biol Phys 62:545–553
Shields AF (2006) Positron emission tomography measurement of tumor metabolism and growth: its expanding role in oncology. Mol Imaging Biol 8:141–150
Dehdashti F, Mintun MA, Lewis JS, Bradley J, Govindan R, Laforest R et al (2003) In vivo assessment of tumor hypoxia in lung cancer with 60Cu-ATSM. Eur J Nucl Med Mol Imaging 30:844–850
Lee ST, Scott AM (2007) Hypoxia positron emission tomography imaging with 18f-fluoromisonidazole. Semin Nucl Med 37:451–461
Sugiyama M, Sakahara H, Sato K, Harada N, Fukumoto D, Kakiuchi T et al (2004) Evaluation of 3′-deoxy-3′-18F-fluorothymidine for monitoring tumor response to radiotherapy and photodynamic therapy in mice. J Nucl Med 45:1754–1758
Everitt S, Hicks RJ, Ball D, Kron T, Schneider-Kolsky M, Walter T et al (2009) Imaging cellular proliferation during chemo-radiotherapy: a pilot study of serial (18)F-FLT positron emission tomography/computed tomography imaging for non-small-cell lung cancer. Int J Radiat Oncol Biol Phys 75:1098–1104
Lambin P, Rios-Velazquez E, Leijenaar R, Carvalho S, van Stiphout RG, Granton P et al (2012) Radiomics: extracting more information from medical images using advanced feature analysis. Eur J Cancer 48:441–446
Kumar V, Gu Y, Basu S, Berglund A, Eschrich SA, Schabath MB et al (2012) Radiomics: the process and the challenges. Magn Reson Imaging 30:1234–1248
Wong CY, Schmidt J, Bong JS, Chundru S, Kestin L, Yan D et al (2007) Correlating metabolic and anatomic responses of primary lung cancers to radiotherapy by combined F-18 FDG PET-CT imaging. Radiat Oncol 2:18
Coon D, Gokhale AS, Burton SA, Heron DE, Ozhasoglu C, Christie N (2008) Fractionated stereotactic body radiation therapy in the treatment of primary, recurrent, and metastatic lung tumors: the role of positron emission tomography/computed tomography-based treatment planning. Clin Lung Cancer 9:217–221
El Naqa I, Grigsby P, Apte A, Kidd E, Donnelly E, Khullar D et al (2009) Exploring feature-based approaches in PET images for predicting cancer treatment outcomes. Pattern Recognit 42:1162–1171
El Naqa I, Wei L, Yang Y (2009) Content-based image retrieval for digital mammography. In: Mohammed S, Fiaidhi J (eds) Ubiquitous health and medical informatics: the ubiquity 20 trend and beyond. IGI Global, Hershey
El-Naqa I, Yang Y, Galatsanos NP, Nishikawa RM, Wernick MN (2004) A similarity learning approach to content-based image retrieval: application to digital mammography. IEEE Trans Med Imaging 23:1233–1244
El Naqa I, Bradley J, Guild C, Apte A, Fergus S, Dehdashti F et al (2008) Pattern recognition analysis of FDG-PET uptake characteristics for assessing response in NSCLC post-radiotherapy treatment. Int J Radiat Oncol Biol Phys 72:S113
Watabe H, Ikoma Y, Kimura Y, Naganawa M, Shidahara M (2006) PET kinetic analysis—compartmental model. Ann Nucl Med 20:583–588
Seibert RM, Ramsey CR, Hines JW, Kupelian PA, Langen KM, Meeks SL et al (2007) A model for predicting lung cancer response to therapy. Int J Radiat Oncol Biol Phys 67:601–609
Ramsey CR, Langen KM, Kupelian PA, Scaperoth DD, Meeks SL, Mahan SL et al (2006) A technique for adaptive image-guided helical tomotherapy for lung cancer. Int J Radiat Oncol Biol Phys 64:1237–1244
Stasi M, Munoz F, Fiorino C, Pasquino M, Baiotto B, Marini P et al (2006) Emptying the rectum before treatment delivery limits the variations of rectal dose–volume parameters during 3DCRT of prostate cancer. Radiother Oncol 80:363–370
de Crevoisier R, Tucker SL, Dong L, Mohan R, Cheung R, Cox JD et al (2005) Increased risk of biochemical and local failure in patients with distended rectum on the planning CT for prostate cancer radiotherapy. Int J Radiat Oncol Biol Phys 62:965–973
Bussink J, Kaanders JH, van der Graaf WT, Oyen WJ (2011) PET-CT for radiotherapy treatment planning and response monitoring in solid tumors. Nat Rev Clin Oncol 8:233–242
Denecke T, Rau B, Hoffmann KT, Hildebrandt B, Ruf J, Gutberlet M et al (2005) Comparison of CT, MRI and FDG-PET in response prediction of patients with locally advanced rectal cancer after multimodal preoperative therapy: is there a benefit in using functional imaging? Eur Radiol 15:1658–1666
Benz MR, Allen-Auerbach MS, Eilber FC, Chen HJJ, Dry S, Phelps ME et al (2008) Combined assessment of metabolic and volumetric changes for assessment of tumor response in patients with soft-tissue sarcomas. J Nucl Med 49:1579–1584
Yang D-H, Min J-J, Jeong Y, Ahn J-S, Kim Y-K, Cho S-H et al (2009) The combined evaluation of interim contrast-enhanced computerized tomography (CT) and FDG-PET/CT predicts the clinical outcomes and may impact on the therapeutic plans in patients with aggressive non-Hodgkin’s lymphoma. Ann Hematol 88:425–432
Strauss LG, Conti PS (1991) The applications of PET in clinical oncology. J Nucl Med 32:623–648
Kidd EA, El Naqa I, Siegel BA, Dehdashti F, Grigsby PW (2012) FDG-PET-based prognostic nomograms for locally advanced cervical cancer. Gynecol Oncol 127:136–140
Larson SM, Erdi Y, Akhurst T, Mazumdar M, Macapinlac HA, Finn RD et al (1999) Tumor treatment response based on visual and quantitative changes in global tumor glycolysis using PET-FDG imaging. The visual response score and the change in total lesion glycolysis. Clin Positron Imaging 2:159–171
Vaidya M, Creach KM, Frye J, Dehdashti F, Bradley JD, El Naqa I (2012) Combined PET/CT image characteristics for radiotherapy tumor response in lung cancer. Radiother Oncol 102:239–245
Jain AK (1989) Fundamentals of digital image processing. Prentice Hall, Englewood Cliffs
O’Sullivan F, Roy S, O’Sullivan J, Vernon C, Eary J (2005) Incorporation of tumor shape into an assessment of spatial heterogeneity for human sarcomas imaged with FDG-PET. Biostatistics 6:293–301
O’Sullivan F, Roy S, Eary J (2003) A statistical measure of tissue heterogeneity with application to 3D PET sarcoma data. Biostatistics 4:433–448
O’Sullivan F, Wolsztynski E, O’Sullivan J, Richards T, Conrad EU, Eary JF (2011) A statistical modeling approach to the analysis of spatial patterns of FDG-PET uptake in human sarcoma. IEEE Trans Med Imaging 30:2059–2071
Castleman KR (1996) Digital image processing. Prentice Hall, Englewood Cliffs
Haralick R, Shanmugam K, Dinstein I (1973) Texture features for image classification. IEEE Trans Syst Man Cybern 3:610–621
Zhang J, Tan T (2002) Brief review of invariant texture analysis methods. Pattern Recogn 35:735–747
Castellano G, Bonilha L, Li LM, Cendes F (2004) Texture analysis of medical images. Clin Radiol 59:1061–1069
Chicklore S, Goh V, Siddique M, Roy A, Marsden P, Cook GR (2013) Quantifying tumour heterogeneity in 18F-FDG PET/CT imaging by texture analysis. Eur J Nucl Med Mol Imaging 40:133–140
Amadasun M, King R (1989) Textural features corresponding to textural properties. IEEE Trans Syst Man Cybern 19:1264–1274
Tixier F, Le Rest CC, Hatt M, Albarghach N, Pradier O, Metges J-P et al (2011) Intratumor heterogeneity characterized by textural features on baseline 18F-FDG PET images predicts response to concomitant radiochemotherapy in esophageal cancer. J Nucl Med 52:369–378
Cheng N-M, Dean Fang Y-H, Tung-Chieh Chang J, Huang C-G, Tsan D-L, Ng S-H et al (2013) Textural features of pretreatment 18F-FDG PET/CT images: prognostic significance in patients with advanced T-stage oropharyngeal squamous cell carcinoma. J Nucl Med 54:1703–1709
Cook GJ, Yip C, Siddique M, Goh V, Chicklore S, Roy A et al (2013) Are pretreatment 18F-FDG PET tumor textural features in non-small cell lung cancer associated with response and survival after chemoradiotherapy? J Nucl Med 54:19–26
Willaime JM, Turkheimer FE, Kenny LM, Aboagye EO (2013) Quantification of intra-tumour cell proliferation heterogeneity using imaging descriptors of 18F fluorothymidine-positron emission tomography. Phys Med Biol 58:187–203
Szczypinski PM, Strzelecki M, Materka A, Klepaczko A (2009) MaZda—a software package for image texture analysis. Comput Methods Progr Biomed 94:66–76
Graham MM, Peterson LM, Hayward RM (2000) Comparison of simplified quantitative analyses of FDG uptake. Nucl Med Biol 27:647–655
Patlak CS, Blasberg RG (1985) Graphical evaluation of blood-to-brain transfer constants from multiple-time uptake data. Generalizations. J Cereb Blood Flow Metab 5:584–590
Choi NC, Fischman AJ, Niemierko A, Ryu JS, Lynch T, Wain J et al (2002) Dose-response relationship between probability of pathologic tumor control and glucose metabolic rate measured with FDG PET after preoperative chemoradiotherapy in locally advanced non-small-cell lung cancer. Int J Radiat Oncol Biol Phys 54:1024–1035
Thorwarth D, Eschmann S-M, Holzner F, Paulsen F, Alber M (2006) Combined uptake of [18F]FDG and [18F]FMISO correlates with radiation therapy outcome in head-and-neck cancer patients. Radiother Oncol 80:151–156
Thorwarth D, Eschmann S-M, Paulsen F, Alber M (2007) A model of reoxygenation dynamics of head-and-neck tumors based on serial 18F-fluoromisonidazole positron emission tomography investigations. Int J Radiat Oncol Biol Phys 68:515–521
Steel GG (2002) Basic clinical radiobiology, 3rd edn. Arnold/Oxford University Press, London/New York
Webb S (2001) The physics of three-dimensional radiation therapy: conformal radiotherapy, radiosurgery, and treatment planning. Institute of Physics Pub, Bristol
El Naqa I (2013) Outcomes modeling. In: Starkschall G, Siochi C (eds) Informatics in radiation oncology. CRC Press/Taylor and Francis, Boca Raton, pp 257–275
El Naqa I, Suneja G, Lindsay PE, Hope AJ, Alaly JR, Vicic M et al (2006) Dose response explorer: an integrated open-source tool for exploring and modelling radiotherapy dose–volume outcome relationships. Phys Med Biol 51:5719–5735
Deasy JO, El Naqa I (2007) Image-based modeling of normal tissue complication probability for radiation therapy. In: Mehta M, Bentzen S (eds) Radiation oncology advances. Springer, New York
El Naqa I, Bradley JD, Lindsay PE, Blanco AI, Vicic M, Hope AJ et al (2006) Multi-variable modeling of radiotherapy outcomes including dose–volume and clinical factors. Int J Radiat Oncol Biol Phys 64:1275–1286
Cherkassky VS, Mulier F (2007) Learning from data: concepts, theory, and methods, 2nd edn. IEEE Press/Wiley-Interscience, Hoboken
Hastie T, Tibshirani R, Friedman JH (2009) The elements of statistical learning: data mining, inference, and prediction, 2nd edn. Springer, New York
El Naqa I, Bradley J, Deasy J (2005) Machine learning methods for radiobiological outcome modeling. In: Mehta M, Paliwal B, Bentzen S (eds) Physical, chemical, and biological targeting in radiation oncology. Medical Physics Publishing, Madison
El-Naqa I, Yang Y, Wernick MN, Galatsanos NP, Nishikawa RM (2002) A support vector machine approach for detection of microcalcifications. IEEE Trans Med Imaging 21:1552–1563
Schèolkopf B, Tsuda K, Vert J-P (2004) Kernel methods in computational biology. MIT Press, Cambridge
Shawe-Taylor J, Cristianini N (2004) Kernel methods for pattern analysis. Cambridge University Press, Cambridge
Haykin S (1999) Neural networks: a comprehensive foundation, 2nd edn. Prentice Hall, Upper Saddle River
El Naqa I, Deasy JO, Mu Y, Huang E, Hope AJ, Lindsay PE et al (2010) Datamining approaches for modeling tumor control probability. Acta Oncol 49:1363–1373
Matthews BW (1975) Comparison of the predicted and observed secondary structure of T4 phage lysozyme. Biochim Biophys Acta 405:442–451
Hanley J, McNeil B (1982) The meaning and use of the area under a receiver operating characteristic (ROC) curve. Radiology 143:29–36
Sprent P, Smeeton NC (2001) Applied nonparametric statistical methods, 3rd edn. Chapman & Hall/CRC, Boca Raton
Kennedy R, Lee Y, Van Roy B, Reed CD, Lippman RP (1998) Solving data mining problems through pattern recognition. Prentice Hall, Englewood Cliffs
Efron B, Tibshirani RJ (1998) An introduction to the bootstrap. 1st CRC Press, Boca Raton (reprint ed. Chapman & Hall/CRC, Boca Raton)
Bentzen SM (2008) Dose painting and theragnostic imaging: towards the prescription, planning and delivery of biologically targeted dose distributions in external beam radiation oncology. Cancer Treat Res 139:41–62
Bentzen SM, Gregoire V (2011) Molecular imaging-based dose painting: a novel paradigm for radiation therapy prescription. Semin Radiat Oncol 21:101–110
Grégoire V, Jeraj R, Lee JA, O’Sullivan B (2012) Radiotherapy for head and neck tumours in 2012 and beyond: conformal, tailored, and adaptive? Lancet Oncol 13:e292–e300
Fletcher GH (1984) Lucy Wortham James Lecture. Subclinical disease. Cancer 53:1274–1284
Ling CC, Humm J, Larson S, Amols H, Fuks Z, Leibel S et al (2000) Towards multidimensional radiotherapy (MD-CRT): biological imaging and biological conformality. Int J Radiat Oncol Biol Phys 47:551–560
Lebesque JV, Keus RB (1991) The simultaneous boost technique: the concept of relative normalized total dose. Radiother Oncol 22:45–55
Madani I, Duthoy W, Derie C, De Gersem W, Boterberg T, Saerens M et al (2007) Positron emission tomography-guided, focal-dose escalation using intensity-modulated radiotherapy for head and neck cancer. Int J Radiat Oncol Biol Phys 68:126–135
Seuntjens J, Serban M, Vallieres M, Hathout L, Freeman C, El Naqa I (2012) Dose-escalation based on MR-PET/CT for soft-tissue sarcoma. Int J Radiat Oncol Biol Phys 84:S660–S661
Bassler N, Jäkel O, Søndergaard CS, Petersen JB (2010) Dose- and LET-painting with particle therapy. Acta Oncol 49:1170–1176
Thorwarth D, Eschmann SM, Paulsen F, Alber M (2007) Hypoxia dose painting by numbers: a planning study. Int J Radiat Oncol Biol Phys 68:291–300
Toma-Dasu I, Uhrdin J, Antonovic L, Dasu A, Nuyts S, Dirix P et al (2012) Dose prescription and treatment planning based on FMISO-PET hypoxia. Acta Oncol 51:222–230
Brooks FJ, Grigsby PW (2014) The effect of small tumor volumes on studies of intratumoral heterogeneity of tracer uptake. J Nucl Med 55:37–42
Zaidi H, Abdoli M, Fuentes CL, El Naqa IM (2012) Comparative methods for PET image segmentation in pharyngolaryngeal squamous cell carcinoma. Eur J Nucl Med Mol Imaging 39(5):881–891
Zaidi H, El Naqa I (2010) PET-guided delineation of radiation therapy treatment volumes: a survey of image segmentation techniques. Eur J Nucl Med Mol Imaging 37:2165–2187
El Naqa I, Yang D, Apte A, Khullar D, Mutic S, Zheng J et al (2007) Concurrent multimodality image segmentation by active contours for radiotherapy treatment planning. Med Phys 34:4738–4749
Markel D, Zaidi H, El Naqa I (2013) Novel multimodality segmentation using level sets and Jensen-Renyi divergence. Med Phys 40:121908
Nahmias C, Wahl LM (2008) Reproducibility of standardized uptake value measurements determined by 18F-FDG PET in malignant tumors. J Nucl Med 49:1804–1808
Kinahan PE, Fletcher JW (2010) Positron emission tomography-computed tomography standardized uptake values in clinical practice and assessing response to therapy. Semin Ultrasound CT MRI 31:496–505
Hatt M, Cheze-Le Rest C, Aboagye EO, Kenny LM, Rosso L, Turkheimer FE et al (2010) Reproducibility of 18F-FDG and 3′-Deoxy-3′-18F-Fluorothymidine PET tumor volume measurements. J Nucl Med 51:1368–1376
Galavis PE, Hollensen C, Jallow N, Paliwal B, Jeraj R (2010) Variability of textural features in FDG PET images due to different acquisition modes and reconstruction parameters. Acta Oncol 49:1012–1016
Cheng NM, Fang YH, Yen TC (2013) The promise and limits of PET texture analysis. Ann Nucl Med 27:867–869
Tixier F, Hatt M, Le Rest CC, Le Pogam A, Corcos L, Visvikis D (2012) Reproducibility of tumor uptake heterogeneity characterization through textural feature analysis in 18F-FDG PET. J Nucl Med 53:693–700
O’Sullivan F, Saha A (1999) Use of ridge regression for improved estimation of kinetic constants from PET data. IEEE Trans Med Imaging 18:115–125
Turkheimer FE, Hinz R, Gunn RN, Aston JA, Gunn SR, Cunningham VJ (2003) Rank-shaping regularization of exponential spectral analysis for application to functional parametric mapping. Phys Med Biol 48:3819–3841
Turkheimer FE, Aston JA, Asselin MC, Hinz R (2006) Multi-resolution Bayesian regression in PET dynamic studies using wavelets. Neuroimage 32:111–121
Acknowledgments
This work was partially supported by the Canadian Institutes of Health Research (CIHR) under grant MOP-114910 and the Natural Sciences and Engineering Research Council (NSERC) of Canada under grant RGPIN 397711-11.
Conflict of interest
Issam El Naqa declares no conflict of interest.
Human and Animal Studies
All required ethics approvals were properly obtained for the presented data.
Author information
Authors and Affiliations
Corresponding author
Additional information
Color figures online at http://link.springer.com/article/10.1007/s40336-014-0063-1.
Rights and permissions
About this article

Cite this article
Naqa, I.E. The role of quantitative PET in predicting cancer treatment outcomes. Clin Transl Imaging 2, 305–320 (2014). https://doi.org/10.1007/s40336-014-0063-1
Received:
Accepted:
Published:
Issue Date:
DOI: https://doi.org/10.1007/s40336-014-0063-1