
Abstract
Since the Moon is less flattened than the Earth, most lunar GIS applications use a spherical datum. However, with the renaissance of lunar missions, it seems worthwhile to define an ellipsoid of revolution that better fits the selenoid. The main long-term benefit of this might be to make the lunar adaptation of methods already implemented in terrestrial GNSS and gravimetry easier and somewhat more accurate. In our work, we used the GRGM 1200A Lunar Geoid (Goossens et al. in A global degree and order 1200 model of the lunar gravity field using GRAIL mission data. In: Lunar and planetary science conference, Houston, TX, Abstract #1484, 2016; Lemoine et al. in Geophys Res Lett 41:3382–3389. http://dx.doi.org/10.1002/2014GL060027, 2014), a 660th degree and order potential surface, developed in the frame of the GRAIL project. Samples were taken from the potential surface along a mesh that represents equal area pieces of the surface, using a Fibonacci sphere. We tried Fibonacci spheres with several numbers of points and also separately examined the effect of rotating the network for a given number of points on the estimated parameters. We estimated the best-fitting rotation ellipsoid’s semi-major axis and flatness data by minimizing the selenoid undulation values at the network points, which were obtained for a = 1,737,576.6 m and f = 0.000305. This parameter pair is already obtained for a 10,000 point grid, while the case of reducing the points of the mesh to 3000 does not cause a deviation in the axis data of more than 10 cm. As expected, the absolute value of the selenoid undulations have decreased compared to the values taken with respect to the spherical basal surface, but significant extreme values still remained as well.
1 Introduction
The theoretical shape of a celestial body is defined by Gauss (1828) as the level surface of its gravitational field for a specific potential value. On the Earth, this potential surface is aligned with the mean sea level, but on other celestial bodies, such as the Moon, in the absence of sea, a potential value is chosen, compared to which about half of the Moon's surface is higher and half is lower. The resulting W = 2,821,713.3 m2 *s−2 (Martinec & Pěč 1988) is the potential value for the selenoid surface. In addition to the theoretical definition of the shape of a celestial body, it is also essential to have a reference surface (a sphere or rotation ellipsoid in general) that can be described easily, with a few parameters, whose centre lies at the centre of mass of the body and which deviates as little as possible from the potential surface.
In our work, we have created a lunar rotation ellipsoid fitting this criteria using the GRGM 1200A Lunar Geoid from the GRAIL mission. To do this, we sampled the selenoid with a mesh of points representing the same areas and then used a program to find the semi-major axis-semi-minor axis pair that gave the best fit.
Such a rotating ellipsoid has significant practical benefits. It can be used well as a geodetic datum, and thus has a significant role as a base surface for various Geographic Informaton System (GIS) applications. What makes the problem of selenodetical datums relevant now is that lunar exploration is experiencing a renaissance, with not only the US but also the EU (in cooperation with the US) and China planning to send a series of space probes and landers to the Moon. NASA's Artemis program began this year, and its goal is to land on the Moon again, and perform research there. The Chinese Chang'e program has been going on for more than a decade, and its ultimate goal is to land a man on the far side of the Moon. During these missions, more time than ever before is planned to be spent on the lunar surface, during which positioning, and hence the lunar equivalent of Global Navigation Satellite System (GNSS), will play a major role. Since the basic data for GNSS applications is always the ellipsoid of revolution that best approximates the geometric shape on Earth, the simplest lunar application of these requires the parameters of the ellipsoidal approximation of the solenoid.
For LunaNet (NASA 2022), which NASA plans to create for GIS applications, the reference surface is currently planned to be the Lunar Reference Frame Standard, a sphere with a radius of 1737.4 km (NASA 2008). However, in the future, mainly in the process of the migration of gravimetric applications developed on Earth and the equations of the terrestrial GNSS, it is conceivable that a rotational ellipsoid will replace it.
2 Data
For the estimation of the ellipsoidal parameters, we used the latest and highest resolution selenoid-model, the GRGM 1200A Lunar Geoid, based on GRAIL (Fig. 1). This includes the coefficients of the spherical harmonical functions up to 660th degree and order (Goossens et al. 2016; Lemoine et al. 2014) and also provides direct data from the far side of the Moon.

3 Methods
Besides the selenoid model, sampling points were needed to perform the estimation. The aim was to define points that represent equal areas on a spherical surface.
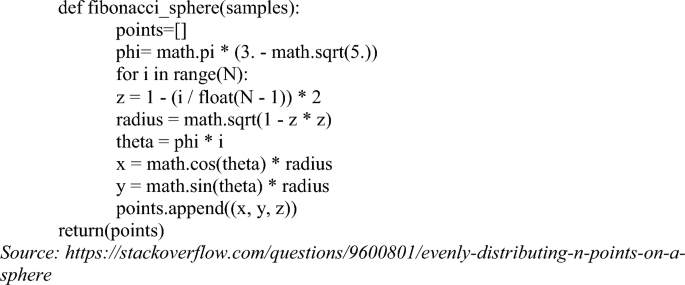
The points were determined using the Fibonacci sphere (Fig. 2). This is a set of points that maps the Fibonacci spiral onto a sphere. To create this, the z-axis was first divided into as many parts as the number of sample points defined. This gives the latitudes, and the longitudes were determined by rotations calculated with the Fibonacci number (Appendix A).
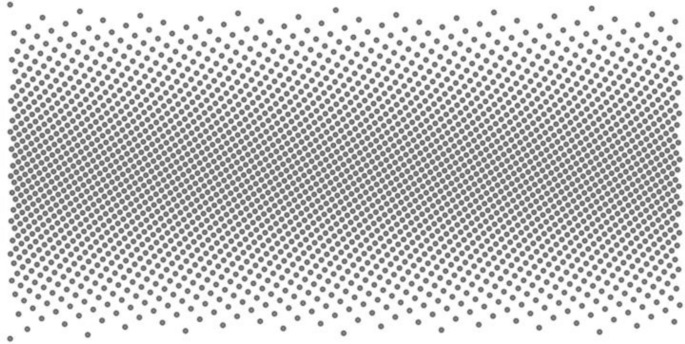
Display of the 3000-point Fibonacci sphere in QGIS
This was then used to sample the selenoid model. The resulting database contains the coordinates of the points and the altitude of the selenoid above a reference surface (a sphere of radius 1737.4 km). From this, the ellipsoidal approximation was made in a Python program. The idea is to find a semi-major axis-semi-minor axis pair for which the sum of the squares of the undulations of the selenoid at the sample points is minimal.
Equation 1: Method to calculate the best-fitting ellipsoid for an N-point Fibonacci sphere.
Since the semi-major axis-major axis pair cannot be any value, both must be in the vicinity of the lunar reference sphere, all calculations were only performed between 1734 and 39 kms in the program. In addition, several iterative steps were used, first determining the minimum at a resolution of only 100 m, then at a higher resolution in the vicinity of the resulting minimum ± 100 m, and so on down to a resolution of 10 cm, saving a lot of time.
This program was not only used once on a single grid, but we also tested how the number of points on the Fibonacci sphere affected the results, using 100, 300, 1000, 3000, 5000, 10,000 and 100,000 point spheres, performing the steps of the calculation described above.
4 Results
The semi-major axes, semi-minor axes and flatnesses of the ellipsoids thus obtained are shown in the table below. The seven results are based on samples of 100, 300, 1000, 3000, 5000, 10,000 and 100,000 points, with an accuracy of 10 cm (Table 1).
The parameters estimated from 100,000 sampled points have the highest accuracy (this result is the same as the parameters obtained for 10,000 points), so the half major axis of the rotation ellipsoid optimally fitting the Moon has a major axis of 1,737,576.6 m, a minor axis of 1,737,046.8 m and a flatness of 3.05*10–4 (Cziráki & Timár 2023).
5 Discussion
5.1 Comparison of the most accurate result with other reference surfaces
As shown in Table 2, the parameters of the rotation ellipsoid we have estimated differ by 176.6 and 353.2 m from the best fitting sphere. The flattening is 3/10,000, which is quite small, the same value on Earth is roughly 33/10,000 (World Geodetic System, WGS84), a significantly larger deviation from the sphere. This is due to the Earth's much faster axial rotation, which not only affects its gravitational field but also distorts its physical shape.
Our results were also compared to the triaxial ellipsoid created in 2010. This is based on the Chang'e 1 and Lunar Prospector (Konopliv et al. 2001) data CE-1-LAM-LEVEL (Wang et al. 2010). As can be seen from Table 2, the differences are 125.9, − 12.8 and − 112.8 ms respectively. These may be due to the fact that the two models describe different geometric bodies. Another important difference is that the selenoid models used to calculate the parameters of the two ellipsoids are not the same. In the case of CE-1-LAM-LEVEL, the primary source of the selenoid model is the 180 degree and order model of the Lunar Prospector mission (Wang et al. 2010), which is lower in resolution than the GRGM 1200A model we used, and the Lunar Prospector model does not have direct data from the far side of the Moon, while GRAIL provided data from the far side with the same resolution as the near side. The differences between the two ellipsoids could therefore be due to these factors.
5.2 Variation of results as a function of Fibonacci spheres with different numbers of points
A central element of our research was that we carried out the estimation with meshes containing different numbers of points. These also provide information on the minimum number of points at which the result does not differ or differs only marginally from the most accurate estimate.
This was not expected for the samples with few points, as they represented too large areas (e.g., 379,323 km2 for the 100-point sphere). Nevertheless, no deviation of more than 1 m was observed in our original sample. In order to determine the uncertainties, the 100-point sphere was rotated above the selenoid model every 30 degrees, the results of which are presented in Sect. 5.3.
The resolution of the GRGM 1200A selenoid model is roughly 16.54 km, so the aim was to perform the calculation with a Fibonacci sphere of similar resolution. The 100,000-point Fibonacci sphere is the closest to achieving this, with 1 point representing 379 km2. Of course, the two resolutions are not exactly the same, as the selenoid model does not provide data in equal areas, but they are still similar in magnitude.
An important result, however, is that the result obtained with a 100,000 point sphere is already obtained with a sample with a tenth of a point, and from the 3000 point sample onwards, there is no difference of more than 10 cm.
5.3 Effect of rotating the Fibonacci sphere on the results
The results obtained are influenced to some extent by the position of the sampling points relative to the selenoid model. The significance of this decreases as the number of points increases and becomes negligible. In order to quantify this effect, the 100- and 5000-point Fibonacci spheres were rotated every 30 degrees above the selenoid and the approximation was also performed with these samples.
As expected, there are significant variations (Figs. 3, 4), especially among the 100-point samples, with a deviation of 5.56 m for the semi-major axis and 7.54 m for the semi-minor axis, and differences of more than 10 m. At 5000 points, the differences are almost negligible, with a standard deviation of 0.09 m for the semi-major axis and 0.14 m for the semi-minor axis, and all differences are within 0.5 m.
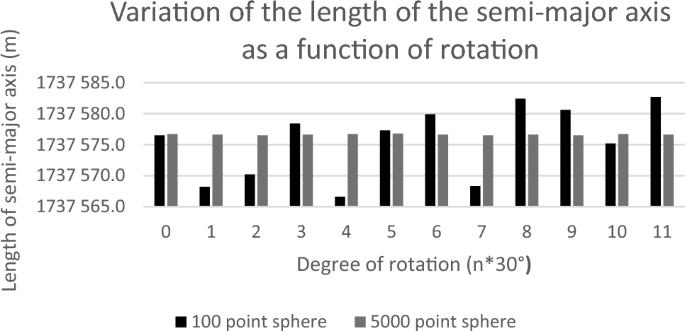
Length of the semi-major axis of the fitted ellipsoid for spheres with different positions
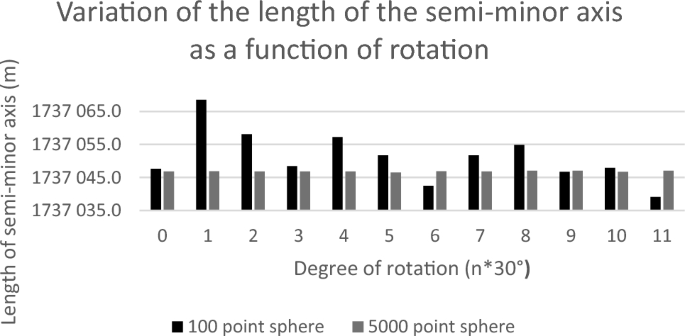
Length of the semi-minor axis of the fitted ellipsoid for spheres with different positions
5.4 Histogram of selenoid undulations on the resulting ellipsoid
The histogram of the selenoid undulations is of interest for the resulting ellipsoid, and for the selenoid model as well. This is shown with 5 m intervals in Fig. 5.

Histogram of the selenoid undulations at the points of a Fibonacci sphere of 100,000 points, and the density function of the normal distribution (m = −0.0147 m, σ = 110 m) fitted to it
Fortunately, the expected value of the fitted normal distribution is 0, but there are significant outliers. These are mainly indicative of inequalities in the potential surface of the selenoid. For example, mass concentrations, mascons (Muller & Sjorgen 1968), which cause a variation of several hundred mgal, have such an effect on the shape of the potential surfaces, and it is therefore not surprising that such excursions are observed.
It is also interesting to note that the extremes are much larger than, for example, on the Earth, where the geoidundulation values do not exceed ± 110 m. And for the Moon, these values reach as high as ± 450 m. This is mainly due to the absence of active planeto-dynamics, which does not allow the formation of mass accretions of this magnitude on Earth. Without these, anomalies can persist on the Moon, which can affect the shape of the potential surfaces to such a large extent.
5.5 Map representation of the selenoid undulations
As can be seen in Fig. 6, the outliers are localised, mainly in the vicinity of certain craters. The positive anomalies mainly occur near the two craters on the Moon's near side, Mare Serenitatis and Mare Imbrium. The largest negative anomalies are found at the South Pole Aitken and at the Mare Orientale craters.

The undulations of the selenoid visualised in QGIS
On the map representation of the undulations, the outliers characterise the selenoid model, not the ellipsoid, since the localised large anomalies are not significantly reduced by just one extra parameter. More information about the effect of the ellipsoid can be obtained by comparing Fig. 6 with Fig. 1, which is basically a map of the selenoidal undulations with respect to the reference sphere. This shows that the ellipsoid has reduced the undulations somewhat in general, but most strikingly, it has almost completely eliminated the anomalies at the poles. This was expected, as the rotation ellipsoid should show the greatest improvement in this area compared to the sphere.
5.6 Definition of the ideal ellipsoid on Earth
Using the methods described in Chapter 3, and with some minor modifications, the ideally fitting ellipsoid of the geoid was also calculated. This is, of course, a very widely used existing ellipsoid, WGS84 (DMA 1984). The primary aim of the calculation is therefore not to create a "new" ellipsoid, but rather to see how well our method can reproduce the parameters of WGS84, essentially to check the calculation method used for the Moon.
The input data used was the geoid model grid of EGM96 (Lemoine et al. 1996), downloaded from https://www.agisoft.com/downloads/geoids/. This takes into account the coefficients of the spherical harmonic functions up to 360 degrees and order. The geoid was sampled using the 100,000-point Fibonacci sphere.
The ideal ellipsoid for the geoid was also calculated to an accuracy of 10 cm. This, as expected, differs only minimally from the parameters of WGS 84. Its semi-major axis is 6,378,137.0 m and its semi-minor axis is 6,356,752.3142 m. For the ellipsoid we obtained, the former is 6,378,136.4 m and the latter 6,356,751.7 m.
6 Conclusion
In our research, we performed an ellipsoidal approximation of the lunar gravitational field, we searched for the rotational ellipsoid that deviates least from the Moon's specific potential surface, which defines the selenoid. In doing so, we sampled the GRGM1200A selenoid model using a Fibonacci sphere with points representing equal areas, and then with this database, we estimated the parameters of the ellipsoid using a program based on a least-squares approximation of the selenoid undulations.
The resulting ellipsoid has its centre at the centre of mass of the Moon, a semi-major axis of 1,737,576.6 m, a semi-minor axis of 1,737,046.8 m and a flattening of 0.000305. The ellipsoidal parameters were determined with an accuracy of 10 cm, using multiple samples.
In our research, we also performed the calculation for the Earth geoid, with the aim of showing that this method can give a good estimate of the ideally fitting ellipsoid. Since the parameters of this ellipsoid on Earth are known, we compared our results to it, and they were very close, with a deviation of only 60 cm.
In the future, we would like to extend our research to the Earth, and investigate the differences in best fitting ellipsoids using varying geoid models.
References
Cziráki K,Timár G (2023) Estimation of the parameters of a lunar ellipsoid of revolution based on GRAIL selenoid data and Fibonacci mesh. EGU General Assembly 2023, Vienna, Austria, 24–28 Apr 2023, EGU23-7979, https://doi.org/10.5194/egusphere-egu23-7979
DMA Defense Mapping Agency (1986) Department of defense world geodetic system 1984: its definition and relationships with local geodetic systems. Technical Report 8350.2. St. Louis, Missouri, USA
Gauss CF (1828) Bestimmung des Breitenunterschiedes zwischen den Sternwarten von Göttingen und Altona. Vandenhoeck und Ruprecht, Göttingen, p.84
Goossens S, Lemoine FG, Sabaka TJ, Nicholas JB, Mazarico E, Rowlands DD, Loomis BD, Chinn DS, Neumann GA, Smith DE and Zuber MT (2016) A global degree and order 1200 model of the lunar gravity field using GRAIL mission data. In: Lunar and planetary science conference, Houston, TX, Abstract #1484. https://doi.org/10.1002/2014GL060027
Konopliv AS, Asmar SW, Carranza E, Sjogren WL, Yuan DN (2001) Recent gravity models as a result of the lunar prospector mission. Icarus 150(1):1–18. https://doi.org/10.1006/icar.2000.6573
Lemoine FG, Goossens S, Sabaka TJ, Nicholas JB, Mazarico E, Rowlands DD, Loomis BD, Chinn DS, Neumann GA, Smith DE, Zuber MT (2014) GRGM900C: a degree 900 lunar gravity model from GRAIL primary and extended mission data. Geophys Res Lett 41:3382–3389. https://doi.org/10.1002/2014GL060027
Lemoine FG, Kenyon SC, Factor JK, Trimmer RG, Pavlis NK, Chinn DS, Cox CM, Klosko SM, Luthcke SB, Torrence MH, Wang YM, Williamson RG, Pavlis EC, Rapp RH, Olson TR (1998) The development of the joint NASA GSFC and NIMA geopotential model EGM96, NASA/TP-1998-206861, NASA Goddard Space Flight Center, Greenbelt, MD USA, p. 575
Martinec Z, Pěč K (1988) A determination of the parameters of the level surface of lunar gravity. Earth Moon Planet 43:21–31
Muller PM, Sjorgen WL (1968) Mascons: lunar mass concentrations. Science 161:680–684
NASA National Aeronautics and Space Administration (2008) A standardized lunar coordinate system for the lunar reconnaissance orbiter and lunar datasets
NASA National Aeronautics and Space Administration (2022) LunaNet interoperability specification document. LN-IS V004
Wang WR, Li F, Liu JJ, Ren X, Zou XD, Mu LL, Yan JG, Zou YL, Zhang HB, Lü C, Liu JZ, Zuo W, Su Y, Wen WB, Bian W, Wang M, Li CL, Ouyang ZY (2010) Triaxial ellipsoid models of the Moon based on the laser altimetry data of Chang’E-1. Sci China Earth Sci 53(11):1594–1601. https://doi.org/10.1007/s11430-010-4060-6
Acknowledgements
Supported by the ÚNKP-22-6 New National Excellence Program of the Ministry for Culture and Innovation from the source of the National Research, Development and Innovation Fund.
Funding
Open access funding provided by Eötvös Loránd University.
Author information
Authors and Affiliations
Corresponding author
Ethics declarations
Conflict of interest
Gábor Timár serves on the Editorial Board of the journal; he has fully withdrawn himself in advance from the evaluation process of this article. The authors have no financial or proprietary interests in any material discussed in this article.
Appendices
Appendix A
Python code for calculating a Fibonacci mesh
Rights and permissions
Open Access This article is licensed under a Creative Commons Attribution 4.0 International License, which permits use, sharing, adaptation, distribution and reproduction in any medium or format, as long as you give appropriate credit to the original author(s) and the source, provide a link to the Creative Commons licence, and indicate if changes were made. The images or other third party material in this article are included in the article's Creative Commons licence, unless indicated otherwise in a credit line to the material. If material is not included in the article's Creative Commons licence and your intended use is not permitted by statutory regulation or exceeds the permitted use, you will need to obtain permission directly from the copyright holder. To view a copy of this licence, visit http://creativecommons.org/licenses/by/4.0/.
About this article

Cite this article
Cziráki, K., Timár, G. Parameters of the best fitting lunar ellipsoid based on GRAIL’s selenoid model. Acta Geod Geophys 58, 139–147 (2023). https://doi.org/10.1007/s40328-023-00415-w
Received:
Accepted:
Published:
Issue Date:
DOI: https://doi.org/10.1007/s40328-023-00415-w