
Abstract
The interpretation of petrophysical logs unveil the reservoir traits and augment an intuition of hydrocarbon (gas) bearing zones. This study focused on interpretation of petrophysical signatures (encountered in Kadanwari-01, 03, 10 and 11) of Lower Goru Formation (LGF). LGF composed of shoreface sands and near shelf shale, deposited in Cretaceous age in middle and lower Indus basins, Pakistan. The results upshot the reservoir potential tapped in interbeded sand packages of LGF. The petrophysical attributes such as shale content from radioactivity tools (GR, SGR), effective porosity from NPHI-RHOB response and average porosity, derived fluids saturation of porous sand reservoir pockets by averaging, the Wyllie–Rose permeability of the selected producing zones and matching of respective resistivity responses (LLD, LLS) quantified in LGF. Lithology indicator (M–N plots) and mineral identification (MID) plot provide a basis to classify the lithology of potential sands derived by neutron, density and sonic logs. The isoperimetric surfaces depict the spatial distribution of derived results of the corresponding prospect zone (PZ). A correlation from NE to SW of study area yields a lateral profile of physical characters and distribution of PZs. Prospect Zone-3 results exhibit good quality of reservoir sands (30–37 m thick), characterizing \({\phi }_{\text{ND}}\) from 0.12 to 0.23 and Shc 0.36–0.6. PZ-3 and PZ-4 are evaluated best prospect zones in this study and may be recommended for drilling.
Introduction
Pakistan’s discovered gas fields are speedily depleting resources (Shar et al. 2017). The Kadanwari gas field (Fig. 1) is located in gas prone Middle Indus Basin (MIB) of Pakistan. This gas field discovered in 1989 (Kadanwari-01, discovery well) and several successful discoveries from conventional structural traps in early Cretaceous lower Goru sands convince the geoscientists for further exploration and development (Ahmad et al. 2004). Eleven wells have been drilled in this studied gas field (Ahmad and Chaudhry 2002). Moreover, verbal communication with industry personal (ENI, Pakistan) reported 40 wells have been drilled in the concession block. The literature review of MIB suggests that a significant amount of untapped potential can be unearthed from structural and stratigraphic fairways of virgin plays in mature fields wherein conventional elements of hydrocarbon trapping mechanisms are well established. The lower Goru sands are producing reservoirs in Kadanwari gas field on a regional scale. Certainly, many intervals of LGF are gas bearing, but lack sufficient permeability to produce gas at commercial profits (Ahmad and Chaudhry 2002; Ahmad et al. 2007).

Site map of Kadanwari concession and understudy boreholes. Kadanwari-03 (K-03) similarly expressed Kadanwari-01 (K-01), and other boreholes
This study primarily focuses on the petrophysical assessment of LGF up to 10’s of meter depth scale and presents detailed characterization of prospect zones. Literature review and overview of seismic interpretations suggests that two-dimensional seismic reflection profiles do not efficiently map thin sand packages of faulted Kadanwari region. The petrophysical logs provide panaceas of such cases and considered a handy tool (Khalid et al. 2015). The geophysical response provides remotely sensed geological conditions in boreholes and the interpretation of geophysical response add paramount reservoir estimations. The petrophysical exploration of thin sand packages of LGF help to model one-dimensional geological signatures encountered in the understudy boreholes (Fig. 1) and when correlated with adjacent borehole the two-dimensional visualizations provide lateral correlations. This study contributes to spatial mapping of newly identified gas prospects and present spatial distribution of evaluated reservoir attributes such as porosity distribution, permeability, thicknesses of zones of interest, shale content and distinguishes the hydrocarbon fluid nature. However, the petrophysical examination of LGF is challenging in understudy field due to fluctuating deltaic conditions, mutable geological influences, varying mineralogical concentrations, sways of regional tectonic settings, structural geometries, shale washout in boreholes, and shale instability in development phase etc.
An overview of geology and stratigraphy
Geological evolution of the basins reveals the hypothesis of petroleum system, action of tectonic jargon and depositional disorders.
Kadanwari gas field is one of the southernmost gas fields of MIB which lies on the southeastern flank of the regional Jacobabad High (Kazmi and Jan 1997). Early rifting of the Gondwanaland (Paleozoic) caused by rising basaltic magma (in upper Asthenosphere), squeezed the over-lying Lithosphere (producing broad tectonic up-warp) which results in divergence and normal faulting in the upper lithosphere. The Lithosphere continued on thinning and resulted in magma swelling and progression of seafloor spreading.
Literature review of authors (Ahmad and Chaudhry 2002; Dolan 1990; Kadri 1995; Kazmi and Jan 1997; Munir et al. 2011) help us to develop the basin model and petroleum system of understudy area which is hypothesized on three tectonic episodes (Fig. 2). Upper brittle crust is broken by the extensional forces under rifting phase-1 (middle Jurassic) into blocks during the seafloor spreading which was separated by the active faults. It appeared that during late Paleozoic to early Mesozoic stretching of initial rifted part stopped (represented by Hiatus in late Jurassic). The rifted crust remained as Indus basin failed rift (Zaigham and Mallick 2000). Phase-2 (early Cretaceous) represents the deposition of sediments on drifting crust. Phase-3 (Late cretaceous) subsidence of the rifted continental crust and at the same time deposition of the Mesozoic sediments in the Indus Basin. Later, up-lift and erosion signifies at the top of phase-3. The lithology stack of MIB is depicted in Fig. 2 which highlights the basin fill sedimentary deposits.

Sembar and Lower Goru shales are presumed source of much of the gas fields in MIB. In Kadanwari area, Lower Goru sands form the reservoir and the transgressive marine shales of lower and upper Goru formations providing the top seal.
The understudy field consists of a number of low relief fault and dip closures (Fig. 3). These wrench faults are particularly significant and divide the study area into faulted blocks (the graben of K-01 block bounded east and west by horsts K-3 and K-10 and K-11 blocks, respectively). A loss of reservoir quality to the north provides a stratigraphic trapping component. The trapping mechanism is a complex combination of structural dip, sealing faults and loss of reservoir quality to the north.

Structural map of Kadanwari concession modified after (Ahmad and Chaudhry 2002)
Data set
We have utilized digital geophysical responses of four boreholes (.las files) awarded by Directorate General of Petroleum Concession (DGPC), Pakistan. The petrophysical logs express physical motif of stacked geological layers as a function of depth. Key information of the data (such as type of log, measured physical property at respective tool, respective log interval of targeted LGF encountered in understudy wells) is summarized in Table 1.
Methodology
The first assessment task is to know the subsurface lithology. GR log is more reliable for identification of lithology, moreover, double combo and triple combo cross-plots of neutroN–Density and neutroN–Density-sonic (M–N plots), respectively, used to reduce the uncertainty of interbeded shale and sandstone of LGF. Cross-plots of different rock properties define the visual representations of the correlation between them and provide virtual visualizations of quantum of data in comprehensive manner, which could be further interpreted as the existence of hydrocarbons (oil/gas) or other fluids (water) and lithology. The resistivity logs in respective intervals highlight separation in resistivity responses of LLD, LLS which signifies the substantial hydrocarbon potential of the Lower Goru Sand Packages (LGSP). Standard Schlumberger charts certified interpretation of lithology and hydrocarbons. Systematically progressing further, a detailed petrophysical analysis is executed to evaluate the reservoir faculties such as quantification of shale content (Vsh), effective porosity (\({\phi }_{\text{ND}}\)), saturation of water (Sw) and permeability (K). After considering environmental correction, the GR index is computed by radioactivity tool which avoid the over-estimation of reservoir porosity of LGSP. The effective porosity is computed from neutron porosity and bulk density logs and later, average effective porosity was computed by the combination of derived porosities. In the absence of core data, the used empirical methods are reliable to predict the effective reservoir porosity. Derived saturation (water/hydrocarbon) of porous reservoir of LGSP as a function of Rw has been calculated by SP log. The permeability (K) of the reservoir is calculated for precise estimation of the saturation of gas. The information about dominant matrix of LGSP and trapped hydrocarbon type is inferred from MID plots. The isoparametric maps of key findings showcase the interpolated distribution of shale content, effective porosity, saturation of hydrocarbons, and net pay thickness of reservoir of the paramount prospects.
Results and discussion
The comprehensive presentation upshots semi-quantitative and qualitative interpretation of petrophysical logs made with an aim to evaluate petrophysical faculties of targeted LGSP as reservoir of the proposed prospect zones.
-
a.
Lithology Interpretation
The interpretation of lithology of targeted zones derived from integration of log responses and cross-plots. GR index is primarily a function of shale content because the GR tool is sensitive to detect radioactive emission dominantly concentrated in clay mineral of shale and clean sand (feldspar rich). However, GR log readings increase as the proportion of shale increases in the formations. The GR response drops in front sandstones, track-1 (each understudy wells, Fig. 4a) highlights targeted zones (illustrated by four different colors) and the double combo and triple combo cross-plots (Fig. 4b, c) of neutroN–Density and neutroN–Density-sonic (M–N plots), respectively, confirms the reservoir lithology as “sandstone” of LGSP. The sandstone packages acting as reservoir within understudy area has been identified through low values of GR, neutroN–Density (ND) cross plot in which the accumulation of clusters at the base of standard sandstone axis (green color, Fig. 4b), similarly M–N cross-plots show the clusters falling dominantly in Quartz region. This work classifies four targeted prospect zones in Kadanwari Block and unearths their hydrocarbon potential. The prospect zones are chronologically ranked as PZ-1 to PZ-4.
Fig. 4 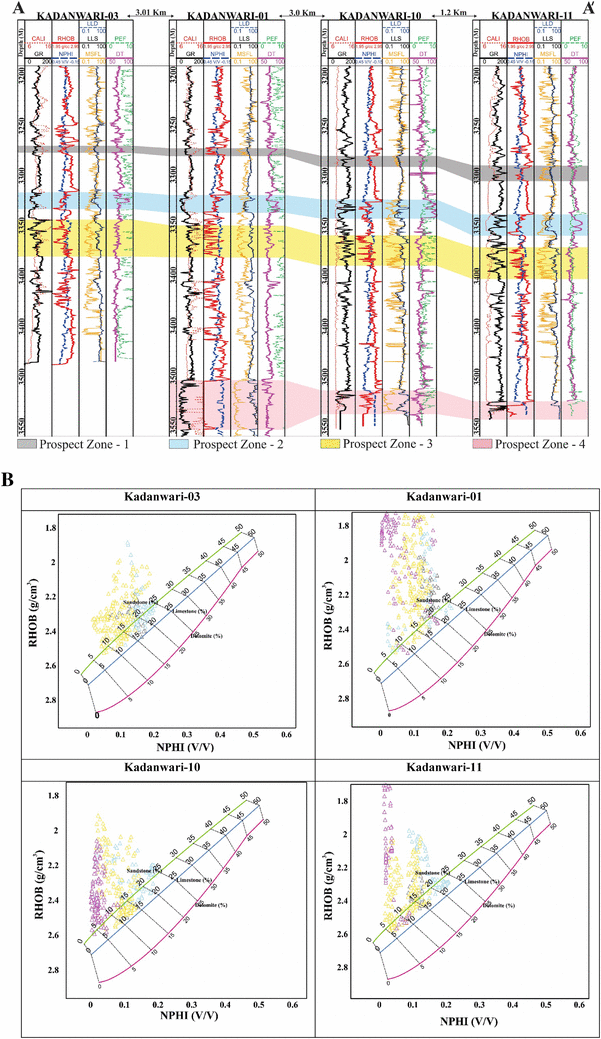
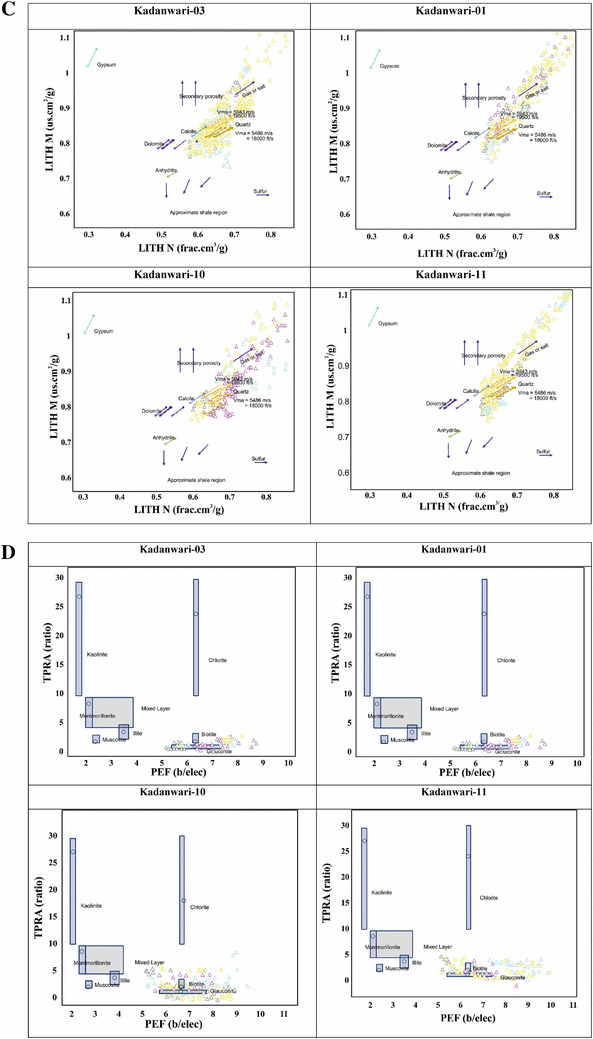
a Correlation of petrophysical curves in understudy wells (AA’ from SW–NE). b Standard cross-plots (Neutron porosity on X-axis and bulk density on Y-axis). Gray—Prospect Zone-1, Blue—Prospect Zone-2, Yellow—Prospect Zone-3, and Purple—Prospect Zone-4. c Mineral assemblages illustrate the standard M–N cross plot in respective boreholes. Gray—Prospect Zone-1, Blue—Prospect Zone-2, Yellow—Prospect Zone-3, and Purple—Prospect Zone-4. d Mineral identification plots (MID), under study wells. Gray—Prospect Zone-1, Blue—Prospect Zone-2, Yellow—Prospect Zone-3, and Purple—Prospect Zone-4
-
b.
Reservoir assessment
The credibility of sand reservoir is evaluated through estimations of petrophysical parameters such as Vsh,\({\phi }_{\text{ND}}\), Sw and K. The numerical estimates of all proposed prospect zones referred in Table 2. The maps of prospect zones yield lateral variation of petrophysical traits. The isoperimetric maps of porosity (total and effective), water and hydrocarbon saturations, shale volume, gross thickness are prepared to evaluate the spatial hydrocarbons potential in the study area. However, the spatial distribution of regional prospects is depicted in Fig. 5.
Table 2 Petrophysical evaluation of prospect zones Fig. 5 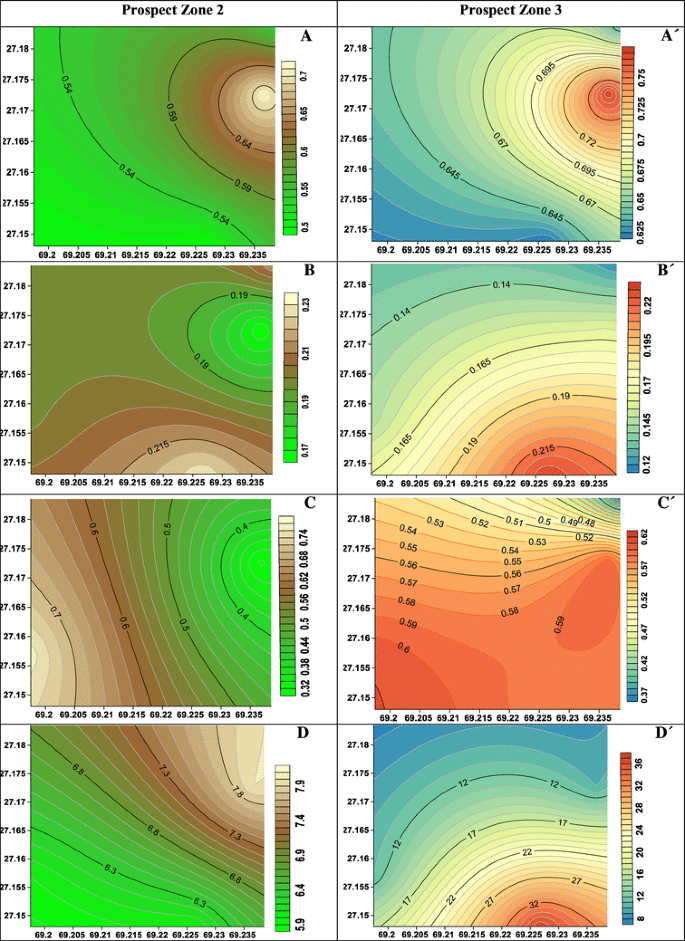
Left panel shows the prospect zones 2 and right panel shows prospect zone 3.a Volume of shale, b average effective porosity, c saturation of Hydrocarbons, d thickness


-
i.
Volume of Shale (Vsh)
Volume of shale is a significant indicator of reservoir quality. In petrophysical assessment, the low values of shale content depicting the cleanliness of the sandstone (Hussain et al. 2017). In case of sandstone the low GR value usually considered a good reservoir and vice versa. Shale content has been calculated by notion:
$${V_{{\text{sh}}}}={\text{ Gamma Ray Index }}=\frac{{{\text{GR}}~\log ~-~{\text{GRmin}} }}{{{\text{GR}}~\hbox{max} ~-{\text{GRmin}} }}.$$(1)Vsh has been calculated and average values of each prospect zone given in Table 2. The maps of derived shale content distribution (Fig. 5A, A’) of reservoir zones of prospect zone 2 (PZ-2) and prospect zone 3 (PZ-3), respectively. PZ-2 has shale content estimated 49.7% at Kadanwari-01 (southwest of study area), whereas maximum 71% at Kadanwari-10 (northeast). High values of Vsh in the reservoir zone are influenced by clay minerals (Fig. 4d) which attempt to reduce the effective porosity. The interpolation suggests that the PZ-2 has more cleanliness of reservoir in southwest of Kadanwari than northeast. PZ-3 has varying Vsh from 62% (Kadanwari-01, southwest of study area) to77% for Kadanwari-10. The interpolation trend indicates a similar character of Vsh estimated for both regional prospects.
-
ii.
Effective porosity
Reservoir quality is a function of effective porosity. The high values of effective porosities refer to better volume estimates and thus theoretically a good reservoir and vice versa.
The effective porosity of zone of interest has been computed from neutron porosity and bulk density logs. The average values of effective porosities derived from dual logs was computed. In the absence of core data, the empirical methods are reliable to predict the effective reservoir porosity(Asquith et al. 2004).The effective porosity has been calculated by notion:
$${\text{Effective porosity}}~=~{\phi _{\text{E}}}=~{\phi _{\text{T}}}_{{_{{{\text{ND}}}}}} - \left( {{\phi _{{T_{{\text{SH}}}}}}\; \times \;{V_{{\text{sh}}}}} \right).$$(2)The combination of neutron porosity (\({\phi }_{\text{N}})\) and density porosity (\({\phi }_{\text{D}})\) is denoted by \({\phi }_{{\text{T}}_{\text{ND}}}\). Neutron log provides the direct porosity (\({\phi }_{\text{N}})\) of the reservoir, however, the density porosity (\({\phi }_{\text{D}})\) is computed by the following equation: PHID = (RHOB − RLST)/(RHOMF − RLST), where RHOMF is the mud filtrate density equal by default to 1 g/cc if no input given as bulk density fluid, RLST is the limestone grain density by default set to 2.71 g/cc, and RHOB is the bulk density.
The derived average value of \({\phi }_{\text{ND}}\) in the targeted zone is given in Table 2. The distribution maps of \({\phi }_{\text{E}}\) for PZ-2 are shown in Fig. 5b; the effective porosity is estimated within range of 16% (Kadanaweri-10) to 22.9% (Kadanwari-01).The maximum value of effective porosity originates from northeast of study area while the lowermost value of effective porosity in adjacent well Kadanwari-10, influenced by the structure; further moving southwest of the study area the effective porosity increased and estimated highest. PZ-3 characterizes with \({\phi }_{\text{E}}\) 12% (Kadanwari-11) to 23% (Kadanwari-01); the variograph surface (Fig. 5B’) depicts that the effective porosity of the respective zone increases southwest of the study area.
-
iii.
Saturation of water
Indonesian equation (Poupon and Leveaux 1971) is one of the effective porosity saturation methods which is applied to calculate Sw of targeted LGSP; the used equation provides comparatively easy computation and shows numerically positive results (greater than zero). Other quadratic and iterative solution models can calculate negative Sw which is uncertain. Where the petrophysical traits are the effective porosity, °ϕe, volume and resistivity log reading of 100% shale (ohm. m) (Vsh and Rsh) and water resistivity (Rw), deep resistivity log gives true resistivity (Rt) at 100% water saturation (ohm. m), cementation factor (m) and saturation exponent (n). The computed results exhibit better understanding of shaly sand reservoir (Fig. 4d),
$${S_{\text{w}}}=~{\left\{ {{R_{\text{t}}}\left[ {{{\left( {\frac{{V_{{{\text{sh}}}}^{{2 - {V_{{\text{sh}}}}}}}}{{{R_{{\text{Sh}}}}}}} \right)}^{\frac{1}{2}}}+~{{\left( {\frac{{\emptyset ~\begin{array}{*{20}{c}} m \\ e \end{array}}}{{{R_{{\text{w~}}}}}}} \right)}^{\frac{1}{2}}}} \right]} \right\}^{\frac{{ - 1}}{n}}}.$$(3)The saturation of water within the consolidated sandstone estimated with the following parameters: tortuosity factor (a = 0.81), cementation exponent (m = 2) and saturation exponent (n = 2) (Asquith et al. 2004). Hydrocarbon saturation (Shc) is a function of Sw. PZ-2 has Sw minimum 22% (Kadanweri-03) and conversely Shc 77% which is maximum (southwest of study area). Although Shc for PZ-2 is not lesser than 31.5%. The interpolated Shc demonstrates (Fig. 5c) that hydrocarbon (gas saturation) spatially varies east–west and relatively increases towards southwest of the study area. PZ-3 is characterized with minimum Shc 36.9% (Kadanwari-11) to 60.9% (Kadanwari-03), and spatially, Shc increases towards southwestern side of the study area.
-
iv.
Hydrocarbon identification
Furthermore, the delineation of the reservoir zones has been made through N–D crossover (track-2 of each well, Fig. 4a) and resistivity log analyses (track-3 of each well, Fig. 4a) and the Schlumberger cross-plots (Fig. 4b, c). In some conditions, it is claimed that there’s a shale rock formation according to high reading for gamma ray, density log and neutron log, but resistivity logs increase; during this circumstance, the sharp increase in resistivity logs is due to a diagenetic process such as compaction or cementation and there’s no water content during this condition as a result of water bearings decrease the resistivity. The separations of resistivity logs (LLD, LLS, MSFL) suggest the presence of hydrocarbon but discrimination between fluid type (oil and gas) at this stage is still quizzing. In pursuance, we have utilized N–D plot (Fig. 4b) and M–N plot (Fig. 4c) to discriminate the hydrocarbon type. The rising clusters (reservoir interval) ascertain least density reservoir pore fluid, certainly the gas accumulations of four targeted prospects.
Hydrocarbon bearing zone characterized with high resistivity values, porosity high, permeability high, saturation of water low, and less Vsh suggest clean sand.
-
v.
Permeability (K)
Permeability estimates provide the unbounded fluid flow in porous reservoir, Wyllie–Rose permeability of the selected LGSP was estimated by the following equation:
$$K={K_{\text{w}}}\frac{{{\phi ^d}}}{{S_{{\text{w}}}^{e}}}.$$We have adopted Morris–Biggs estimates with constants d = 6.0, e = 2 and \({K}_{\text{w}}\) = 6500 for gas.
Typically, porosity has to exceed 18% and permeability to be greater than 2 milliDarcy for a sand to produce gas at commercial rates in Kadanwari (Ahmad and Chaudhry 2002). The permeability findings for PZ-2 suggest that permeability ranges from ~ 0.7 Darcy to ~ 4.4 Darcy, whereas for PZ-3 ~ 0.4 Darcy to ~ 5.6 Darcy. Quadri and Quadri (1996) suggested the estimation of permeability for lower Goru may exceed 1 Darcy.
-
c.
Finally, the thickness distribution maps of PZ-2 (Fig. 5d) suggest that thickness of gas prone reservoir of LGSP increases in northeast of the study area. The interpolated thickness for PZ-3 (Fig. 5D’) increases southeast of the study area which ranges with relatively thick packages from 30 to 37 m.
-
d.
The mineral identification (MID) plots are machinated between photoelectric effect (PEF) and thorium–potassium ratio (TPRA) which provide ample clue that the reservoir has little dirtiness, encountered in each
Conclusion and recommendations
The petrophysical studies unearth hydrocarbon potential of four prospect zones (PZ-1 to PZ-4) in Cretaceous age LGF which is a productive Kadanwari field. GR index, double combo and triple combo plots ascertain sandstone lithology. The cross-plots, resistivity separation, and N–D crossover discriminate gas accumulation. The petrophysical assessment of reservoir concluded that shallower PZ-1 (11 m average thickness) and deepest PZ-4 (30 m avg. thickness), although the intermediate depth zone PZ-2 (18–21 m thick) and PZ-3 (30–37 m thick) are main prospects of this study. PZ-2 and PZ-3 hold key indicators: low GR, crossover of density porosity, separation of resistivities, low Sw, high hydrocarbon saturation and favorable permeability. PZ-2 results highlight reservoir sands characterizing Vsh from 0.49 to 0.71, \({\phi }_{\text{ND}}\) from 0.16 to 0.22, Sw from 0.22 to 0.68 and Shc 0.31–0.77. PZ-3 results exhibit good quality of reservoir sands having more thickness and characterizing Vsh 0.62–0.77, \({\phi }_{\text{ND}}\) from 0.12 to 0.23, Sw from 0.39 to 0.63 and Shc 0.36–0.6. Thus, PZ-3 is thick package of sand and shows comparatively better reservoir characteristics. The quantification of petrophysical analysis reveals that the prospect zones Lower Goru Formation have good potential and significant accumulation of hydrocarbons and this study will enhance future hydrocarbon exploration and exploitation activities in parts of lower Indus basin of Pakistan. However, results are acquired only based on petrophysical analysis. To strengthen the estimated results, we recommend geochemistry data for source rock basic information, core for absolute reservoir properties, and 3D seismic reflection datasets for the development of local play concepts and prospect/lead assessments. Based on good quality reservoir characteristics of PZ-4 (Table 2 and Fig. 4a), it is also recommended to drill all the wells down to this zone in the concession blocks and may invest on this productive zone in the future.
References
Ahmad N, Chaudhry S (2002) Kadanwari gas field, Pakistan: a disappointment turns into an attractive development opportunity. Petrol Geosci 8(4):307–316
Ahmad N, Fink P, Sturrock S, Mahmood T, Ibrahim M (2004) Sequence stratigraphy as predictive tool in Lower Goru Fairway, Lower and Middle Indus Platform, Pakistan: In: PAPG, Annual Technical Conference, p. 85–104
Ahmad N, Spadini G, Palekar A, Subhani MA (2007) Porosity prediction using 3D seismic inversion Kadanwari Gas Field, Pakistan. Pak J Hydrocarb Res 17:95–102
Asquith GB, Krygowski D, Gibson CR (2004) Basic well log analysis, American Association of Petroleum Geologists, Tulsa
Baig MO, Harris N, Ahmed H, Baig M (2016) Controls on reservoir diagenesis in the Lower Goru Sandstone Formation, Lower Indus basin, Pakistan. J Pet Geol 39(1):29–47
Dolan P (1990) Pakistan: a history of petroleum exploration and future potential. Geological Society, London, 50, pp 503–524
Hussain M, Ahmed N, Chun WY, Khalid P, Mahmood A, Ahmad SR, Rasool U (2017) Reservoir characterization of basal sand zone of lower Goru Formation by petrophysical studies of geophysical logs. J Geol Soc India 89(3):331–338
Kadri IB (1995) Petroleum geology of Pakistan, Pakistan Petroleum Limited, Karachi
Kazmi AH, Jan MQ (1997), Geology and tectonics of Pakistan. Graphic publishers, Santa Ana
Khalid P, Yasin Q, Sohail G, Kashif JM (2015) Integrating core and wireline log data to evaluate porosity of Jurassic formations of Injra-1 and Nuryal-2 wells, Western Potwar, Pakistan. J Geol Soc India 86(5):553
Munir K, Iqbal MA, Farid A, Shabih SM (2011) Mapping the productive sands of Lower Goru Formation by using seismic stratigraphy and rock physical studies in Sawan area, southern Pakistan: a case study. J Pet Explor Prod Technol 1(1):33–42
Naeem M, Jafri MK, Moustafa SS, AL-Arifi NS, Asim S, Khan F, Ahmed N (2016) Seismic and well log driven structural and petrophysical analysis of the Lower Goru Formation in the Lower Indus Basin, Pakistan. Geosci J 20(1):57–75
Poupon A, Leveaux J (1971) Evaluation of water saturation in shaly formations. In: Proceedings SPWLA 12th Annual Logging Symposium, Society of Petrophysicists and Well-Log Analysts
Quadri V-u-N, Quadri S (1996) Anatomy of success in oil and gas exploration in Pakistan, 1915–94. Oil Gas J 94:20
Shar AM, Mahesar AA, Memon KR (2017) Could shale gas meet energy deficit: its current status and future prospects. J Pet Explor Prod Technol. https://doi.org/10.1007/s13202-017-0399-y
Zaigham NA, Mallick KA (2000) Prospect of hydrocarbon associated with fossil-rift structures of the southern Indus basin, Pakistan: AAPG Bull, 84(11):1833–1848
Acknowledgements
We thank the potential reviewers for their suggestions to improve the manuscript. We also thank DGPC for providing necessary data, and acknowledge the moral support of PPL Chair in facilitation of this study in Digital Geophysical Data Lab at Bahria University Karachi Campus.
Author information
Authors and Affiliations
Corresponding author
Additional information
Publisher’s Note
Springer Nature remains neutral with regard to jurisdictional claims in published maps and institutional affiliations.
Rights and permissions
Open Access This article is distributed under the terms of the Creative Commons Attribution 4.0 International License (http://creativecommons.org/licenses/by/4.0/), which permits unrestricted use, distribution, and reproduction in any medium, provided you give appropriate credit to the original author(s) and the source, provide a link to the Creative Commons license, and indicate if changes were made.
About this article

Cite this article
Khan, M.J., Khan, H.A. Petrophysical logs contribute in appraising productive sands of Lower Goru Formation, Kadanwari concession, Pakistan. J Petrol Explor Prod Technol 8, 1089–1098 (2018). https://doi.org/10.1007/s13202-018-0472-1
Received:
Accepted:
Published:
Issue Date:
DOI: https://doi.org/10.1007/s13202-018-0472-1