
Abstract
Purpose
Despite growing evidence supporting the potential benefits of higher end-tidal carbon dioxide (ETCO2) levels in surgical patients, there is still insufficient data to formulate guidelines for ideal intraoperative ETCO2 targets. As it is unclear which intraoperative ETCO2 levels are currently used and whether these levels have changed over time, we investigated the practice pattern using the Multicenter Perioperative Outcomes Group database.
Methods
This retrospective, observational, multicentre study included 317,445 adult patients who received general anesthesia for non-cardiothoracic procedures between January 2008 and September 2016. The primary outcome was a time-weighted average area-under-the-curve (TWA-AUC) for four ETCO2 thresholds (< 28, < 35, < 45, and > 45 mmHg). Additionally, a median ETCO2 was studied. A Kruskal-Wallis test was used to analyse differences between years. Random-effect multivariable logistic regression models were constructed to study variability.
Results
Both TWA-AUC and median ETCO2 showed a minimal increase in ETCO2 over time, with a median [interquartile range] ETCO2 of 33 [31.0–35.0] mmHg in 2008 and 35 [33.0–38.0] mmHg in 2016 (P <0.001). A large inter-hospital and inter-provider variability in ETCO2 were observed after adjustment for patient characteristics, ventilation parameters, and intraoperative blood pressure (intraclass correlation coefficient 0.36; 95% confidence interval, 0.18 to 0.58).
Conclusions
Between 2008 and 2016, intraoperative ETCO2 values did not change in a clinically important manner. Interestingly, we found a large inter-hospital and inter-provider variability in ETCO2 throughout the study period, possibly indicating a broad range of tolerance for ETCO2, or a lack of evidence to support a specific targeted range. Clinical outcomes were not assessed in this study and they should be the focus of future research.
Résumé
Objectif
Malgré une accumulation de données probantes suggérant des avantages de taux plus élevés de dioxyde de carbone en fin d’expiration (ETCO2) chez les patients chirurgicaux, nous ne disposons pas encore d’assez de données pour formuler des lignes directrices sur les cibles peropératoires idéales de l’ETCO2. Comme nous ne savons effectivement pas avec certitude quels taux peropératoires d’ETCO2 sont actuellement utilisés et si ces taux ont changé au fil du temps, nous avons étudié l’évolution de la pratique en utilisant la base de données du MPOG (Multicenter Perioperative Outcomes Group).
Méthodes
Cette étude multicentrique rétrospective observationnelle a inclus 317 445 patients adultes ayant reçu une anesthésie générale pour des procédures non cardiothoraciques entre janvier 2008 et septembre 2016. Le critère d’évaluation principal était une aire sous la courbe moyenne pondérée en fonction du temps (ASC-mT) pour quatre seuils d’ETCO2 (< 28, < 35, < 45 et > 45 mmHg). De plus, une ETCO2 médiane a été étudiée. Un test de Kruskal-Wallis a permis d’analyser les différences entre les années. Des modèles de régression logistique multifactorielle à effet aléatoire ont été construits pour étudier la variabilité.
Résultats
L’ASC-mT et l’ETCO2 médiane ont montré une augmentation minime de l’ETCO2 au fil du temps, avec une valeur médiane [plage interquartile] de l’ETCO2 de 33 [31,0 à 35,0] mmHg en 2008 et 35 [33,0 à 38,0] mmHg en 2016 (P < 0,001). Une grande variabilité entre les hôpitaux et prestataires de l’ETCO2 a été observée après ajustement pour les caractéristiques des patients, les paramètres de ventilation et la pression artérielle peropératoire (coefficient de corrélation intracatégorie : 0,36; intervalle de confiance à 95 % : 0,18 à 0,58).
Conclusions
Entre 2008 et 2016, les valeurs peropératoires de l’ETCO2 n’ont pas varié d’une manière importante sur le plan clinique. Il est intéressant de noter que nous avons trouvé une grande variabilité de l’ETCO2 entre hôpitaux et prestataires tout au long de la période d’étude témoignant peut-être d’une vaste plage de tolérance de l’ETCO2 ou d’un manque de données probantes pour soutenir une valeur cible spécifique. L’évolution clinique n’a pas été analysée au cours de cette étude et elle devra être le centre d’intérêt de futures recherches.
Historically, it has been common practice to maintain hypocapnia (arterial carbon dioxide pressure (PaCO2) < 35 mmHg) during general anesthesia.1,2 Intraoperative end-tidal carbon dioxide (ETCO2) values around 30 mmHg were frequently targeted, as hypercapnia (PaCO2 > 45 mmHg) was considered to contribute to intraoperative tachycardia and hypertension, thereby increasing the oxygen demand of the myocardium.1,3 In contrast, hypocapnia reduced the need for muscle relaxants and additional anesthetics to prevent spontaneous ventilation. Nevertheless, there is no good evidence to support the benefit of hypocapnia, and some studies suggest benefits for higher ETCO2 levels.1,4,5 First, it is easier to implement low tidal volume ventilation.6,7 Second, hypercapnia increases the cardiac output, resulting in an increase in tissue oxygenation, which in turn may prevent surgical site infections.1,8,9,10 Third, studies using different lung injury models have shown that hypercapnia has protective, immune-modulating properties that decrease the inflammatory response.11,12,13 Fourth, hypercapnia may increase lung parenchymal compliance13,14,15 and can improve ventilation-perfusion matching in the lungs.1,12,16 Finally, normocapnia positively influences the neurologic outcome because of vasoactive properties of PaCO2, which is especially pronounced in already injured brains.17
Unfortunately, many studies focus on the critical care population, leaving surgical patients underrepresented.1,2,4,5,8,9,10 Therefore, there is no strong evidence of a benefit for higher CO2 tensions compared with hypocapnia in perioperative patients.
To generate evidence to formulate guidelines on ETCO2 management during general anesthesia, we first need to understand current clinical practice. To our knowledge, it is unclear which target ETCO2 levels are currently used and whether these levels have changed over time. Therefore, this study aimed to investigate the practice pattern of ETCO2 levels over time in non-cardiothoracic surgery. We did not aim to study clinical outcomes. We hypothesized that the target ETCO2 level may have increased over time in response to the existing evidence described above. To further explore the practice pattern, we aimed to investigate four subgroups separately: patients with chronic obstructive pulmonary disease (COPD; subgroup 1); patients undergoing intracranial or carotid artery surgery (subgroup 2); and patients receiving laparoscopic surgery with (subgroup 3) or without (subgroup 4) robot assistance.
Methods
For this multicentre, retrospective, observational study, we used data from the Multicentre Perioperative Outcomes Group (MPOG) database. The MPOG registry, data entry process, and validation of data have been described in detail previously.18,19 In brief, MPOG is a consortium of 47 hospitals in North America and Europe, collecting perioperative data to facilitate outcomes research. Institutional Review Board (IRB) approval for MPOG was obtained from the University of Michigan Health System, MPOG’s coordinating institution. Each participating institution has separate IRB approval to submit a limited set of perioperative data into the centralized database for future use, without any direct patient identifiers. Ethical approval for the current study was provided by the University Medical Center Utrecht, the leading institution for this project (May 2016, Number 16-282/C). The requirement for written informed consent was waived. No additional IRB approval was sought from other institutions. Additionally, the study protocol was reviewed a priori and approved by the MPOG Perioperative Clinical Research Committee (PCRC-0032, September 2016).
Patients
This study included all adult patients ≥ 18 yr who received general anesthesia between I January, 2008 and 9 January, 2016 at eight academic institutions affiliated with MPOG: University of Michigan Health System, Ann Arbor, Michigan; Oregon Health & Science University, Portland, Oregon; University of Oklahoma Health Sciences Center, Oklahoma City, OK; Washington University School of Medicine, St. Louis, MO; University of Vermont Medical Center, Burlington, VT; Vanderbilt University, Nashville, TN; University Medical Center Utrecht, Utrecht, the Netherlands; and University of Pennsylvania Health System, Philadelphia, PA, USA. Only institutions submitting data for all variables mentioned below were selected for this study. For patients who received general anesthesia more than once within 30 days, only the first case was included. Exclusion criteria are presented in Fig. 1. These criteria were based on procedure type, a poor clinical condition prior to anesthesia, and suspected intraoperative hemodynamic instability to limit the risk of artifacts and invalid ETCO2 values. Vasopressor use per hour was used as a proxy for hemodynamic instability. Additionally, we excluded patients who received one-lung ventilation and ventilation by means of a laryngeal mask airway. To ensure sufficient time for data collection, cases with < 40 min between incision and the end of the surgical procedure were excluded. Furthermore, patients with < 20 valid machine-generated ETCO2 measurements were excluded.
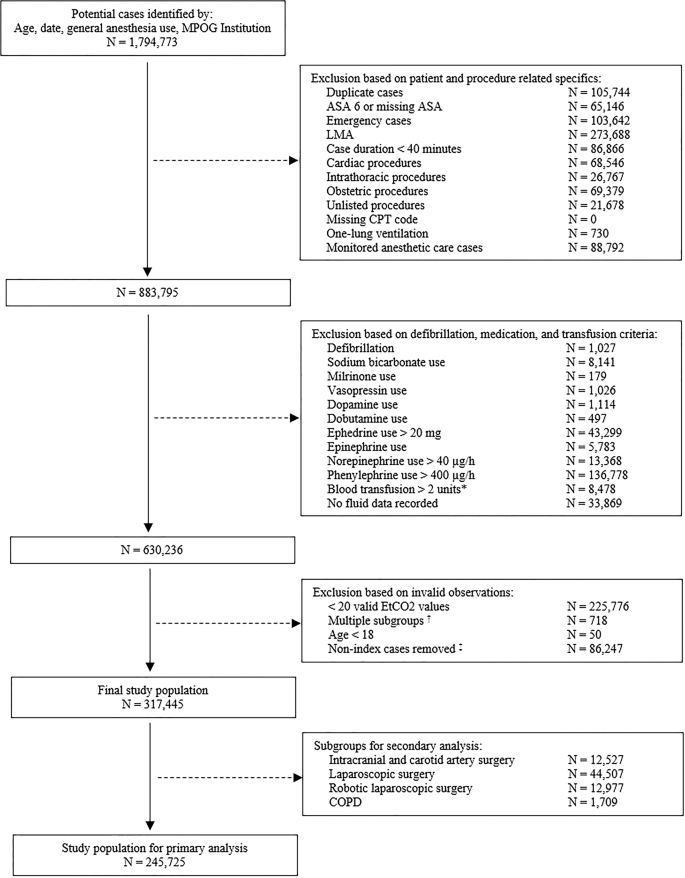
Flow chart. ASA = American Society of Anesthesiologist; CPT = current procedural terminology; ETCO2 = end-tidal carbon dioxide. LMA = laryngeal mask airway; MPOG = Multicenter Perioperative Outcomes Group. *Blood transfusion > two units was defined as: more than two units of packed cells or whole blood or more than 600 mL of cell saver blood during general anesthesia. †Patients were excluded when they met the inclusion criteria of more than one subgroup: e.g., chronic obstructive pulmonary disease (COPD) and laparoscopic surgery. ‡Only the first case within 30 days was included
A priori, we defined four subgroups of patients in whom the target ETCO2 level was considered to possibly differ from other patients: 1) patients with COPD, as their awake PaCO2 level may be increased and therefore a higher ETCO2 may be accepted20; 2) patients undergoing intracranial and carotid artery surgery, as these interventions may compromise cerebral perfusion and therefore warrant a strict control of ETCO2;1,17 and patients receiving laparoscopic surgery with or without robot assistance (subgroups 3 and 4 respectively), as insufflation with carbon dioxide can increase the PaCO2, therefore higher ETCO2 levels may need to be tolerated.21,22,23 We differentiated between laparoscopic surgery with and without robot assistance, since Trendelenburg positioning can further increase the PaCO2.22 All four subgroups were excluded from the primary analysis to avoid confounding the observed change in ETCO2 levels over time, especially because of an increasing utilization of laparoscopic over open procedures. Patients eligible for multiple groups were excluded from all analyses.
Outcome
The primary outcome was ETCO2 stratified into four groups (< 28, < 35, < 45, and > 45 mmHg) and the area-under-the-curve for each specific threshold was estimated with adjustment for the total measurement time, resulting in a time-weighted average area-under-the-curve (TWA-AUC) per threshold. Patients could be binned into multiple groups. Patients with at least one valid ETCO2 < 28 mmHg were binned into the < 28 mmHg group, but these data were also used for the < 35 mmHg and < 45 mmHg groups, respectively. If patients also had at least one valid ETCO2 value > 45 mmHg, the corresponding TWA-AUC was binned into the > 45 mmHg group.
To aid interpretation and clinical applicability, a median ETCO2 per case was obtained as a secondary outcome measure. A priori, a relative change of 10% in median ETCO2 over the entire study period was considered to be clinically relevant.
Data collection
Data collection for intraoperative variables started ten minutes after surgical incision to ignore hyper- and hypocapnia that may follow mask ventilation and intubation during induction of anesthesia, and to allow the ETCO2 to reach a set level. Data collection ended ten minutes prior to the end of the surgical dressing to ignore increased values of ETCO2 that may be accepted to establish spontaneous ventilation. When the exact incision time was not registered, data collection started 20 min after anesthesia induction. Only valid ETCO2 values were used (see Table 1S, available as Electronic Supplementary Material for the artifact filter). Data were collected for ventilation parameters (tidal volume, respiratory rate, positive-end-expiratory pressure (PEEP), respiratory minute volume (RMV)) and mean arterial blood pressure (MAP) as potential confounders. Mean arterial pressure and ventilation parameters, including ETCO2, were measured continuously during general anesthesia by automated interfaces. An average of these results was recorded every minute in the anesthesia record-keeping system and stored in the centralized MPOG database.
Preoperative data on sex, height, body mass index (BMI), age, and American Society of Anesthesiologists (ASA) physical status were collected as covariates.24 For every case, we recorded the institution and determined the primary anesthesia provider, defined as the supervising anesthesiology faculty and primary anesthesia caregiver (either nurse anesthetist or resident) that provided anesthesia for at least 75% of the time.
Statistical analysis
Descriptive statistics were computed using frequencies and percentages for categorical variables and medians with interquartile ranges [IQR] for continuous data after checking continuous variables for normality using the Kolmogorov-Smirnov test.
Differences in baseline characteristics, ventilation parameters, and mean MAP between the primary cohort and the subgroups and between the beginning and end of the study were analyzed using a Kruskal-Wallis test.
For all four thresholds, the TWA-AUC of each patient was computed from minute-level ETCO2 values using a fitted cubic spline curve (see Figure available as Electronic Supplementary Material showing the method to calculate the area-under-the-curve). For every case, a median was calculated for tidal volume, respiratory rate, PEEP, and RMV. We determined the mean MAP for every case, as a summary measure for the overall blood pressure.
Both the TWA-AUC and median ETCO2 were plotted over time and values were compared between years using a Kruskal-Wallis test. Medians and IQR were reported.
Prior to the start of this study, we surveyed all participating centres to gain insight into target ETCO2 levels and factors that might have influenced these levels during the study period. The full survey can be found in the Supplemental Material. When abrupt changes in ETCO2 were reported by at least half of all institutions, an interrupted time series (ITS) analysis was considered.
To examine variation in ETCO2, patient characteristics were compared between patients with a median ETCO2 < 5th percentile, between the 5th and 95th percentile, and > 95th percentile using a Kruskal-Wallis test. To examine variation between and within each institution, six mixed-effect multivariable logistic regression models were built. A positive TWA-AUC ETCO2 > 45 mmHg (meaning that at least one ETCO2 value per case was > 45 mmHg) was used as a binary outcome measure in all models. Before any regression models were constructed, all variables under consideration for model inclusion were checked for collinearity using the condition index. If the condition index was > 30, a Pearson’s correlation matrix was developed. Those variables deemed to be collinear (defined as a correlation of ≥ 0.70) were either combined into a single variable or removed. All non-collinear variables were entered into the models. The included fixed effects were selected based upon clinical relevance: age (binned per decade, reference group 18–30), sex, BMI (binned into < 18.5, 18.5–24.9 (reference group), 25.0–29.9, 30.0–34.9, 35.0–39.9, ≥ 40.0 kg·m−2), ASA class (I or II vs III, IV, V), median tidal volume (binned by ideal body weight into < 6, 6–8 (reference group), 8–10, > 10 mL·kg−1), median respiratory rate (binned into < 12, 12–16 (reference group), 16–20, > 20 min−1), median PEEP (binary, < 5 or ≥ 5 cmH2O), mean MAP (< 65, 65–80 (reference group), > 80 mmHg), and year of the procedure. All six mixed-effects models contained the same fixed effects with differing random effects between the models. The first model used institution as a random effect to examine the variation between institutions; the second model used primary anesthesia caregiver, and the third used supervising anesthesiology faculty as random effects to examine how much of the variation could be explained by inter-provider variability. The fourth model used supervising anesthesiology faculty nested within institution as a random effect and the fifth model used primary anesthesia caregiver nested within institution to further explore variation due to preferences of a provider within a specific institution. The final model was built with primary anesthesia caregiver nested within supervising anesthesiology faculty, which was again nested within institution, as the random effect. This model was built to explore how much of the variation could be explained by a particular anesthesia care team in a specific institution. Measures of effect size for random effects were reported as intraclass correlation coefficients (ICC) and median odds ratios (MOR) with corresponding 95% confidence intervals (CI).25
All analyses were conducted for the general cohort and the subgroups separately. A P value of 0.05 was considered statistically significant for all analyses.
The analyses were conducted using SAS v. 9.4 (SAS Institute, Cary, NC, USA) and Stata v. 13.1 (StataCorp LLC; College Station, TX, USA). The study was conducted in adherence to the STROBE statement for observational research.26
Results
One million, seven hundred and ninety-four thousand, seven hundred and seventy-three patients met the initial inclusion criteria of general anesthesia and age. After application of all a priori defined exclusion criteria and after exclusion of invalid observations, 317,445 patients were eligible. We included 245,725 patients in our primary analysis and 71,720 patients in different subgroups (Fig. 1). Patient characteristics for the primary cohort and the subgroups are described in Table 1. Additionally, differences in patient characteristics between 2008 and 2016 are shown in Table 2. Over time, patients were slightly older, had a higher BMI, and had a higher ASA class. RMV slightly decreased over time, whereas the mean MAP increased over time. The duration of both the procedure and general anesthesia decreased over time.
Change in ETCO2 over time
The mean TWA-AUC per quarter of a year was plotted for all four ETCO2 thresholds (Fig. 2, data for the general cohort) and showed that more time was spent closer to or above the threshold of 45 mmHg. There was a statistically significant decrease in TWA-AUC from 2008 to 2016 for an ETCO2 < 28 mmHg, < 35 mmHg, and < 45 mmHg, whereas a TWA-AUC ETCO2 > 45 mmHg significantly increased over time (Table 2). The median [IQR] ETCO2 was plotted over time (Fig. 3a) and showed a minimal increase from 33 [31.0–35.0] mmHg in 2008 to 35 [33.0–38.0] mmHg (P < 0.001) in 2016.

Trend in TWA-AUC ETCO2 for four different thresholds. The trend over time in mean time-weighted average area-under-the-curve (TWA-AUC) per quarter for an end-tidal carbon dioxide levels (ETCO2) of < 28 mmHg, < 35 mmHg, < 45 mmHg, and > 45 mmHg. The TWA-AUC decreased over time for an ETCO2 threshold of < 28, < 35, and < 45 mmHg, whereas the TWA-AUC ETCO2 > 45 mmHg increased over time

Trend in median ETCO2 over time. The boxplots show an increase in median end-tidal carbon dioxide (ETCO2) values between 2008 and 2016 for the general cohort (A) and the subgroups (B–E). The triangle represents the mean, the whiskers represent the spread between the 10th and 90th percentile. The median ETCO2 was lower for patients presenting for intracranial and carotid artery surgery (B) compared with the general cohort. The median ETCO2 was higher for patients in the (robotic) laparoscopic cohort (C, D) and for patients with chronic obstructive pulmonary disease (COPD) (E) compared with the general cohort (A)
Similar trends were obtained for the subgroups over time (Fig. 3 and Table 2). Nevertheless, the ETCO2 was lower for patients presenting for intracranial and carotid artery surgery and higher for patients in the (robotic) laparoscopic cohort and for patients with COPD (see also Table 2S, available as Electronic Supplementary Material, showing the median ETCO2 and TWA-AUC per threshold for the general cohort and all subgroups).
In the survey, two out of eight (25%) institutions reported a decrease in RMV between 2008 and 2016, and one institution (12.5%) reported an increase in RMV. Three institutions (37.5%) reported an increase in target ETCO2 level varying between 2 and 5 mmHg. Since a minority of institutions reported a change in time, we refrained from conducting ITS analysis. Results from the survey are summarized in Table 3S in the Electronic Supplementary Material.
Variation in ETCO2
The median ETCO2 plots showed a large spread between the 10th and 90th percentile (Fig. 3). Characteristics of patients with a median ETCO2 < 5th percentile (< 29 mmHg), between the 5th and 95th percentile (29–41 mmHg), and > 95th percentile (41 mmHg) were compared (see Table 4S available as Electronic Supplementary Material showing the baseline characteristics by percentile). Patients with a higher median ETCO2 were, on average, younger, had a higher BMI, a lower ASA class, and were more often male. The median RMV was lower for patients with a higher median ETCO2. The duration of both general anesthesia and surgery was longest for patients with an intermediate ETCO2 (between 29 and 41 mmHg).
After adjusting for patient characteristics, ventilation parameters, and mean MAP, an ICC of 0.18 (95% CI, 0.07 to 0.37) was found for a model using institution as a random effect, 0.17 (95% CI, 0.16 to 0.19) for a model with primary anesthesia caregiver as a random effect, and 0.12 (95% CI, 0.11 to 0.14) for a model with supervising anesthesiology faculty as a random effect (Table 3). An ICC of 0.36 (95% CI, 0.18 to 0.58) was found for a model with primary anesthesia caregiver nested within a specific supervising anesthesiology faculty, nested within a specific institution, as a random effect. This corresponded with a MOR of 1.98 (95% CI, 1.90 to 2.07). In this, the MOR can be interpreted as the median increase in the odds of having at least one ETCO2 value per case > 45 mmHg, when an individual moves from a one cluster to another. The subgroup consisting of patients with COPD was too small to conduct random-effect multivariable logistic regression models.
Discussion
Between 2008 and 2016, median ETCO2 levels increased minimally, but this change did not meet the a priori-defined clinically relevant threshold of 10%. A large variation in target ETCO2 levels was observed between institutions and between providers for the general cohort and all subgroups. Interestingly, only a minority of this variation could be attributed to the institution and anesthesia provider, while controlling for patient characteristics. The amount of variability that could be attributed to institution and primary anesthesia caregiver was overall slightly larger than the amount that could be attributed to the supervising anesthesiology faculty, except for intracranial and carotid artery surgery, where the preference of the supervising anesthesiology faculty seemed to be more important than the effect of institution and primary anesthesia caregiver.
Practice variation in targeted ETCO2 levels has not been studied previously. Large practice variation across regions, institutions, and physicians is reported throughout the medical field.27 Previously, a variation of 18% in tidal volume was shown to be attributable to institutional variability.24 The same amount of variation could be attributed to institutional variability in our study.
The large variation in ETCO2 found in this study may have several implications. It raises the question whether anesthesia providers care for any ETCO2 target at all, or at least it could be theorized that ETCO2 levels are not as important as maintaining, for example, adequate blood pressure levels or oxygen saturation. Likely, there is insufficient knowledge about the effects of ETCO2 levels to guide anesthesia providers in targeting specific ETCO2 levels. We believe further exploration of the effect of intraoperative ETCO2 levels on postoperative outcome is required to determine what ETCO2 level should be aimed for to improve patient outcome. This research group has initiated two new projects to study the association between intraoperative ETCO2 levels and postoperative pulmonary complications, and the association between intraoperative ETCO2 levels and neurologic outcome in the neurosurgical population.
As all retrospective analyses, this study has limitations. First, we did not differentiate between spontaneous and controlled ventilation, but we only included cases with endotracheal tubes placed. By excluding cases managed with laryngeal mask airways, the likelihood of spontaneous breathing patterns was reduced significantly. It could be argued that some of the residual spontaneous breathing might lead to a higher ETCO2 level and that this may explain the observed variation. Nevertheless, we would expect that an inacceptable ETCO2 level (either hyper- or hypocapnia) would be corrected by the anesthesia provider. Therefore, since the aim of this study was to investigate which levels are being accepted, we did not differentiate between these ventilation methods. Second, the use of certain ventilator modes might be associated with the practice pattern in ETCO2 levels, e.g., a volume-controlled ventilation mode with a specific default setting, but this was not taken into account in this study. As became apparent from the survey, the majority of institutions used a strictly controlled default ventilation mode. Third, a TWA-AUC is not easily applicable in daily practice. Nevertheless, our primary aim was to investigate the practice pattern over time for further research purposes and we believe that a median ETCO2 per case would not suffice to summarize a case adequately. Four ranges of ETCO2 and thus four different TWA-AUC values per case allowed us better to summarize a very long case compared with one overall value. The median ETCO2 was added as a secondary outcome measure to aid interpretation and clinical applicability. Fourth, the intraoperative time-frame used for data collection was chosen based upon expert consensus. We aimed to collect data during a relatively stable phase of general anesthesia. We checked timeframes in randomly selected cases and found a good correspondence with the maintenance phase of anesthesia. Finally, although we adjusted the results for a large set of potential confounders, residual confounding might be present because of the retrospective nature of this study.
Conclusion
There was no clinically relevant change in intraoperative ETCO2 levels between 2008 and 2016. Nevertheless, there was a very large practice variation, even within institutions and providers that could not be fully explained by differences in patient or procedure characteristics. Although existing literature suggests that ETCO2 levels of 40 mmHg or higher might be associated with better outcomes in mechanically-ventilated patients,4,5,9,17,28 this is not reflected in current clinical anesthesia practice. Clinical outcomes were not assessed in this study and should be the focus of future research to formulate clear guidelines.
References
Way M, Hill GE. Intraoperative end-tidal carbon dioxide concentrations: what is the target? Anesthesiol Res Pract 2011; 2011: 1-3.
Wax DB, Lin H-M, Hossain S, et al. Intraoperative carbon dioxide management and outcomes. Eur J Anaesthesiol 2010; 27: 819-23.
Mas A, Saura P, Joseph D, et al. Effect of acute moderate changes in PaCO2 on global hemodynamics and gastric perfusion. Crit Care Med 2000; 28: 360-5.
Dony P, Dramaix M, Boogaerts JG. Hypocapnia measured by end-tidal carbon dioxide tension during anesthesia is associated with increased 30-day mortality rate. J Clin Anesth 2017; 36: 123-6.
Takahashi CE, Brambrink AM, Aziz MF, et al. Association of intraprocedural blood pressure and end tidal carbon dioxide with outcome after acute stroke intervention. Neurocrit Care 2014; 20: 202-8.
Slutsky AS, Ranieri VM. Ventilator-Induced Lung Injury. N Engl J Med 2013; 22369: 2126-36.
Serpa Neto A, Hemmes SNT, Barbas CSV, et al. Association between driving pressure and development of postoperative pulmonary complications in patients undergoing mechanical ventilation for general anaesthesia: a meta-analysis of individual patient data. Lancet Respir Med 2016; 4: 272-80.
Akça O, Doufas AG, Morioka N, et al. Hypercapnia improves tissue oxygenation. Anesthesiology 2002; 97: 801-6.
Fleischmann E, Herbst F, Kugener A, et al. Mild hypercapnia increases subcutaneous and colonic oxygen tension in patients given 80% inspired oxygen during abdominal surgery. Anesthesiology 2006; 104: 944-9.
Akça O, Kurz A, Fleischmann E, et al. Hypercapnia and surgical site infection: a randomized trial. Br J Anaesth 2013; 111: 759-67.
Contreras M, Ansari B, Curley G, et al. Hypercapnic acidosis attenuates ventilation-induced lung injury by a nuclear factor-κB-dependent mechanism. Crit Care Med 2012; 40: 2622-30.
Marhong J, Fan E. Carbon dioxide in the critically ill: too much or too little of a good thing? Respir Care 2014; 59: 1597-605.
Contreras M, Masterson C, Laffey JG. Permissive hypercapnia: what to remember. Curr Opin Anaesthesiol 2015; 28: 26-37.
Lele EE, Hantos Z, Bitay M, et al. Bronchoconstriction during alveolar hypocapnia and systemic hypercapnia in dogs with a cardiopulmonary bypass. Respir Physiol Neurobiol 2011; 175: 140-5.
Emery MJ, Eveland RL, Min JH, et al. CO2 relaxation of the rat lung parenchymal strip. Respir Physiol Neurobiol 2013; 186: 33-9.
Pfeiffer B, Hachenberg T, Wendt M, et al. Mechanical ventilation with permissive hypercapnia increases intrapulmonary shunt in septic and nonseptic patients with acute respiratory distress syndrome. Crit Care Med 2002; 30: 285-9.
Curley G, Kavanagh BP, Laffey JG. Hypocapnia and the injured brain: more harm than benefit. Crit Care Med 2010; 38: 1348-59.
Freundlich RE, Kheterpal S. Perioperative effectiveness research using large databases. Best Pract Res Clin Anaesthesiol 2011; 25: 489-98.
Kheterpal S. Clinical research using an information system: The multicenter perioperative outcomes group. Anesthesiol Clin 2011; 29: 377-88.
Dempsey J, Smith C. Pathophysiology of human ventilatory control. Eur Respir J 2014; 44: 495-512.
Danic MJ, Chow M, Alexander G, et al. Anesthesia considerations for robotic-assisted laparoscopic prostatectomy: A review of 1,500 cases. J Robot Surg 2007; 1: 119-23.
Kalmar AF, Foubert L, Hendrickx JFA, et al. Influence of steep Trendelenburg position and CO2 pneumoperitoneum on cardiovascular, cerebrovascular, and respiratory homeostasis during robotic prostatectomy. Br J Anaesth 2010; 104: 433-9.
Sood J. Advancing frontiers in anaesthesiology with laparoscopy. World J Gastroenterol 2014; 20: 14308-14.
Bender SP, Paganelli WC, Gerety LP, et al. Intraoperative lung-protective ventilation trends and practice patterns. Anesth Analg 2015; 121: 1231-9.
Merlo J, Chaix B, Ohlsson H, et al. A brief conceptual tutorial of multilevel analysis in social epidemiology: using measures of clustering in multilevel logistic regression to investigate contextual phenomena. J Epidemiol Community Heal 2006; 60: 290-7.
von Elm E, Altman D, Egger M, et al. STROBE Initiative. The Strengthening the Reporting of Observational Studies in Epidemiology (STROBE) statement: guidelines for reporting observational studies. J Clin Epidemiol 2008; 61: 344-9.
Corallo AN, Croxford R, Goodman DC, et al. A systematic review of medical practice variation in OECD countries. Health Policy (New York) 2014; 114: 5-14.
Hovorka J. Carbon dioxide homeostasis and recovery after general anaesthesia. Acta Anaesthesiol Scand 1982; 26: 498-504.
Acknowledgements
The authors gratefully acknowledge the valuable contributions to protocol development and final manuscript review by the MPOG Perioperative Clinical Research Committee.
Conflict of interest
None declared.
Editorial responsibility
This submission was handled by Dr. Philip M. Jones, Associate Editor, Canadian Journal of Anesthesia.
Author contributions
Annemarie Akkermans contributed to the study design, study coordination, and writing of the manuscript. Aleda Thompson and Amy Shanks contributed to the study design, study coordination, data analysis, and writing of the manuscript. Judith A. R. van Waes, Linda M. Peelen, Michael F. Aziz, Daniel A. Biggs, William C. Paganelli, Jonathan P. Wanderer, Daniel L. Helsten, Sachin Kheterpal, Wilton A. van Klei, and Leif Saager contributed to the study design and writing of the manuscript.
Financial support and sponsorship
None.
Author information
Authors and Affiliations
Corresponding author
Electronic supplementary material
Below is the link to the electronic supplementary material.
APPENDIX
APPENDIX
Members of the committee
Mark D. Neuman, M.D. - University of Pennsylvania, Philadelphia, PA, USA
Janet Wilczak, M.D. - Beaumont Health, Dearborn, MI, USA
Joshua Berris, D.O. - Beaumont Health, Farmington Hills, MI, USA
Zachary Price, M.D. - Beaumont Health, Grosse Pointe, MI, USA
Mitchell F. Berman, M.D. - Columbia University Medical Center, New York, NY, USA
Masakatsu Nanamori, M.D. - Henry Ford Health System, Detroit, MI, USA
Bruce T. Adelman, M.D. - Henry Ford Health System, West Bloomfield, MI, USA
Christopher Wedeven, M.D. - Holland Hospital, Holland, MI, USA
John LaGorio, M.D. - Mercy Health, Muskegon, MI, USA
Traci Coffman, M.D. - St. Joseph Mercy, Ann Arbor, MI, USA
Susan Molina, M.D. - St. Mary Mercy Hospital, Livonia, MI, USA
Sean C. Mackey, M.D., Ph.D. - Perioperative and Pain Medicine, Stanford University School of Medicine, Stanford, CA, USA
Nathan L. Pace, M.D., M.Stat. - University of Utah, Salt Lake City, UT, USA
Bala J. Nair, Ph.D. - University of Washington, Seattle, WA, USA
Fabian Kooij, M.D. - Academic Medical Center, Amsterdam, The Netherlands
Roy Soto, M.D. - Beaumont Health, Royal Oak, MI, USA
Steven Lins, M.D. - Bronson Healthcare, Battle Creek, MI, USA
Peter Coles, M.D. - Bronson Healthcare, Kalamazoo, MI, USA
Kenneth C. Cummings, M.D. - Cleveland Clinic, Cleveland, OH, USA
Simon Tom, M.D. - NYU Langone Medical Center, New York, NY, USA
Terri A. Ellis II, M.D. - St. Joseph Mercy Oakland, Pontiac, MI, USA
William Peterson, M.D. - Sparrow Health System, Lansing, MI, USA
Leslie C. Jameson, M.D. - University of Colorado, Aurora, CO, USA
Patrick J. Tighe, M.D., M.S. - University of Florida College of Medicine, Gainesville, FL, USA
Robert E. Redfern, M.D. - University of Florida College of Medicine, Jacksonville, FL, USA
Robert M. Craft, M.D. - University of Tennessee Medical Center, Knoxville, TN, USA
Marcel E. Durieux, M.D., Ph.D. - University of Virginia, Charlottesville, VA, USA
Scott A. Miller, M.D. - Wake Forest Baptist Health, Winston-Salem, NC, USA
Zachary A. Turnbull, M.D. - Weill Cornell Medical College, New York, NY, USA
The authors also would like to thank the Blue Cross Blue Shield of Michigan/Blue Cross Network. Support for underlying electronic health record data collection was provided, in part, by Blue Cross and Blue Shield of Michigan and Blue Care Network as part of the BCBSM Value Partnerships program for contributing hospitals in the State of Michigan. Although Blue Cross Blue Shield of Michigan and MPOG work collaboratively, the opinions, beliefs, and viewpoints expressed by the author do not necessarily reflect the opinions, beliefs, and viewpoints of BCBSM or any of its employees.
Rights and permissions
Open Access This article is distributed under the terms of the Creative Commons Attribution-NonCommercial 4.0 International License (http://creativecommons.org/licenses/by-nc/4.0/), which permits any noncommercial use, distribution, and reproduction in any medium, provided you give appropriate credit to the original author(s) and the source, provide a link to the Creative Commons license, and indicate if changes were made.
About this article

Cite this article
Akkermans, A., van Waes, J.A.R., Thompson, A. et al. An observational study of end-tidal carbon dioxide trends in general anesthesia. Can J Anesth/J Can Anesth 66, 149–160 (2019). https://doi.org/10.1007/s12630-018-1249-1
Received:
Revised:
Accepted:
Published:
Issue Date:
DOI: https://doi.org/10.1007/s12630-018-1249-1