
Abstract
Purpose
Transthoracic examination of the heart and great vessels is an essential skill that allows the anesthesiologist to evaluate cardiac function. In this article, we describe a pragmatic technique to obtain the essential views to evaluate normal or abnormal cardiac function and to appreciate great vessel anatomy and physiology.
Principal findings
The cardiac anatomy and function can be described using standard parasternal, apical, and subcostal views. These windows can also be used to assess the aorta, pulmonary artery, and vena cavae; however, other transthoracic and abdominal windows can be used to complete the evaluation of the great vessels.
Conclusions
The integration of the echocardiographic information particularly from the heart and great vessels with the case story, physical examination, laboratory data, and other relevant clinical information should become the way of the future, and this will benefit the patients under our care.
Résumé
Objectif
L’examen transthoracique du cœur et des grands vaisseaux est une compétence essentielle qui permet à l’anesthésiologiste d’évaluer la fonction cardiaque. Dans cet article, nous décrivons une approche pragmatique pour l’obtention des vues essentielles permettant d’évaluer une fonction cardiaque normale ou anormale et d’apprécier l’anatomie et la physiologie des grands vaisseaux.
Constatations principales
L’anatomie et la fonction cardiaque peuvent être décrites au moyen des vues parasternales, apicales et sous-costales. Ces fenêtres peuvent également servir à évaluer l’aorte, l’artère pulmonaire et la veine cave; cependant, d’autres vues transthoraciques et abdominales peuvent être utilisées pour compléter l’évaluation des grands vaisseaux.
Conclusions
L’intégration de l’information échocardiographique, concernant en particulier le cœur et les grands vaisseaux, dans l’histoire clinique, l’examen physique, les données de laboratoire et autres renseignements cliniques pertinents devraient devenir une voie d’avenir qui bénéficiera aux patients dont nous prenons soin.
Introduction and key questions
Preoperative assessment of the airway and anticipation of potential difficulties has become a standard skill that every anesthesiologist performs routinely. However, in our daily practice, the prevalence of patients with a difficult airway is significantly less than that of significant cardiovascular disease and hypoxemia. Consequently, one could imagine that eventually anesthesiologists will not limit their preoperative physical examination to a focus on the airway and will also consider the examination of the heart and great vessels, using bedside ultrasound as part of their routine, to anticipate and treat potential hemodynamic instability while providing standard anesthesia care. This concept has already been nicely illustrated in a study by Zhang et al. where 90 patients with an American Society of Anesthesiology (ASA) physical status I/II/III (27/36/27) were induced with etomidate.1 Significant hypotension occurred in 46.7% of patients. The authors found that the degree of collapsibility of the inferior vena cava (IVC) measured before induction using echocardiography was superior to commonly used demographic or hemodynamic variables in predicting hypotension. This is a simple illustration of how bedside ultrasound can be used in our daily practice and shows its potential role in the anticipation of intraoperative hemodynamic instability. In our opinion, this represents a major advantage and could be used to optimize the care of our patients as previously presented in the Journal.2,3
In this article, the authors, who are experienced bedside ultrasound instructors and use this technology in their daily practice, will share their experience in learning the technique, teaching it, and using it routinely before, during, and after anesthesia. We will limit our discussion to the heart and great vessels, using two-dimensional (2D) imaging as well as basic colour Doppler, to identify various abnormalities. Advanced diastology will not be covered. Those interested in a more detailed analysis of this topic are referred to other published articles.4,5
Throughout the text several technical tips and clinical pearls from the authors will be shared with the reader. We have also used simulator technology (CAE Vimedix simulator, with permission from CAE Healthcare) to facilitate comprehension of the anatomy. Some of the pitfalls of the 2D ultrasound examination will be covered. The extra-cardiac aspects will be examined in more detail in other articles within this special issue of the Journal.6
Anatomy of the heart and great vessels
Orientations tips
Before performing an ultrasound examination of the heart and great vessels, it is essential to understand the anatomy. This requires an understanding of the relationship among the heart, great vessels, and surrounding organs. The heart itself is a very complex structure. A simple tip we use as instructors to explain anatomical relationships while scanning the heart from top to bottom or from left to the right with the ultrasound beam kept along the same orientation is the following:
The most anterior anatomical structure of the heart is the pulmonary artery and right ventricular outflow tract (RVOT) (Fig. 1). This explains why acute venous air emboli will typically accumulate in that region in a supine position.

Anterior to posterior anatomy of the heart. A, B) When the heart is analyzed from the most anterior or retrosternal to the most posterior structure close to the spine, the following elements will be seen: the pulmonary artery (PA) will be seen first 1), followed by 2) the aortic valve (AoV), then 3) the mitral valve (MV), and finally 4) the tricuspid valve (TV). Note that the coronary sinus (CS) is the most posterior structure of the heart. (With permission of CAE Healthcare, Ville St-Laurent, QC, Canada)
Further down in an anterior-posterior direction, the aortic valve will be seen. It will be followed by the mitral and the tricuspid valves. The most posterior structure of the heart is the coronary sinus. When the heart is analyzed anteriorly from the left to right side of the patient, the following simple mnemonic, the Left-Right-Left-Right-Left rule (Fig. 2), can be used. This means that as you are scanning the heart from the left to right of the patient in a sagittal plane, you will come across left- and right-sided structures, which alternate with each other. On the most left lateral position, the left atrium and ventricle can be seen. As we move medially, a right-sided structure is seen, the pulmonary artery and then a left-sided structure, the aorta. Remember that when auscultating, the pulmonary zone is on the right and the aorta is on the left. The aorta is adjacent to the pulmonary artery and the superior vena cava (SVC), which are both right-sided structures. Finally, posterior to the SVC is the left atrium and the two right pulmonary veins.

Lateral to medial anatomy of the heart. A) Anterior view of the heart. The left-right-left-right-left rule indicates that the most lateral portion of the heart will be the left atrium (LA) and the left ventricle (LV) or 1). B) Antero-lateral view of the heart. Then sagittal rotation of the beam beyond the left atrial appendage (LAA) will show the pulmonary artery (PA) or 2), which is a right-sided structure. Further rotation will reach the aorta (Ao) or 3), which is a left-sided structure. Lateral to the Ao lies the superior vena cava (SVC) or 4), which is a right-sided structure. C) Posterior view of the heart. Beyond the SVC are the right pulmonary veins or 5), which are left-sided structures. (With permission of CAE Healthcare, Ville St-Laurent, QC, Canada)
Anatomical structures
The left ventricle has a bullet-shape aspect that can be sliced longitudinally or in a transverse fashion. It is subdivided in a basal region that includes the mitral valve, a mid-papillary region (or level), and an apical region (or level). Contraction of the left ventricle has three components based on the orientation of the myocardial fibre: radial and longitudinal shortening as well as a twisting motion. Conditions such as Takotsubo cardiomyopathy (or stress cardiomyopathy) will typically be associated with preserved basal left ventricular function and progressive myocardial dysfunction with typical apical akinesia.7 Myocardial ischemia resulting from left anterior descending ischemia can also be associated with apical akinesia or with anterior mid and basal hypokinesia with preserved inferior basal motion.
The left atrium is normally smaller in dimension than the left ventricle. The left atrial appendage is typically positioned in an anterolateral position. A dilated left atrium is typical of diastolic dysfunction provided there is no severe mitral or aortic valve disease. The left atrial dimension has been called the “glycosylated hemoglobin” of diastolic dysfunction because it will remain chronically dilated regardless of filling pressure.
The right ventricle has a complex crescent-shape structure with an inflow and outflow portion. The right ventricle has three walls: inferior, lateral, and anterior. These walls end at the infundibulum, which corresponds to the outflow part. The outflow is more trabeculated at its apex than the left ventricle and has thinner walls. The “pumping action” of the right ventricle is peristaltic, or a wringing effect, generated via a piston-like action mediated mostly by longitudinal shortening. Despite looking smaller on ultrasound images, the end-diastolic volume of the right ventricle is larger than that of the left.8 The right ventricle can easily alter its volume and shape depending on its pre- and afterload status.
The right atrium dimension is typically smaller than the right ventricle. It also has an appendage located anteriorly. Being a structure with lower pressures, it is easier to compress during global or regional tamponade.
Cardiac valves
A normal aortic valve has three cusps. From an echocardiographic viewpoint, the non-coronary cusp faces the interatrial septum (IAS), the right coronary cusp is most anterior where the right coronary artery originates, and the remaining left coronary cusp is where the left main coronary artery originates. The aortic valve is part of the aortic root complex, which includes the three sinuses of Valsalva, the sinotubular junction, and the ascending aorta.
The mitral valve is a complex structure with two leaflets, anterior and posterior, attached via the chordae tendineae to the anterolateral and posterior-median papillary muscles, respectively. The posterior-median papillary muscle is more commonly ruptured than the anterolateral in myocardial ischemia because the posterior-median papillary muscle is perfused only by the right coronary artery as opposed to the anterolateral papillary muscle, which typically has a dual blood supply from the left circumflex and left anterior descending artery.9 Although it appears smaller in various echocardiographic views, the posterior leaflet of the mitral valve generally contributes to a greater extent to the mitral valve annulus and is more susceptible to left ventricular dilatation. Annular dilatation could lead to posterior leaflet tenting and mitral regurgitation.
The pulmonary valve has three cusps, the right, left, and anterior. In venous air embolism, air will typically be located under the anterior leaflet in the patient in supine position. The tricuspid valve has three leaflets attached to papillary muscles via chordae tendineae.
The interventricular septum separates both ventricles. The IAS typically has a thinner portion called the fossa ovalis. In up to 20% of adult patients,10 communication between the two atria can occur through a patent foramen ovale. In right ventricular failure, this can be problematic and may lead to chronic right ventricular volume overload, right-to-left shunting with resultant hypoxemia, and paradoxical emboli.
The heart is typically surrounded by a dense membrane called the pericardium. There usually is a small anechoic space between the pericardium and myocardium, which is filled with pericardial fluid and is easier to see in dependent areas. It is important to realize that pericardial fat may have a similar appearance; however, it tends to have a non-homogeneous aspect and be present in a non-dependent location. Although a visible space is considered normal during systole (physiologic pericardial fluid), when this phenomenon is seen in diastole, the term pericardial effusion is used.
Other intracardiac structures
Venous drainage of the heart ends in the coronary sinus, which is typically smaller than 1 cm. Chronically increased right atrial pressure of any etiology can cause dilation of the coronary sinus. A dilated coronary sinus may occur in patients with a left-sided SVC or pulmonary hypertension or with congenital malformations where anomalous venous drainage exists.11,12
This may lead to an aberrant position of the central venous catheter. Two other structures are frequently found in the right atrium including the Thebesian valve, which can be present at the entrance of the coronary sinus, as well as both the Eustachian valve and Chiari network, which originate at the junction of the IVC and right atrium.13
The ascending aorta starts at the aortic root and travels from right to left to become the aortic arch. As the arch turns in the caudal direction, the thoracic descending aorta is formed until it reaches the diaphragm where is becomes the abdominal aorta (Fig. 3). The right innominate artery gives rise to the right subclavian and common carotid artery. The left common carotid and left subclavian artery typically arise separately from the aortic arch although anatomical variations do occur. The left subclavian origin on the aorta is used as a landmark to position the intra-aortic balloon in patients with acute cardiogenic shock.

Great vessel anatomy. A) Anterior view of the heart. The main pulmonary artery (MPA) is positioned to the left of the ascending aorta (Ao). B) Postero-lateral view of the heart. The aortic arch and the descending aorta can be seen from the left. C) Posterior view of the heart. Note the intrahepatic position of the inferior vena cava (IVC) and the extra-hepatic position of the abdominal aorta. LAA = left atrial appendage; LV = left ventricle; RA = right atrial; RV = right ventricle. (With permission of CAE Healthcare, Ville St-Laurent, QC, Canada)
Blood from both axillary veins, the jugular and subclavian veins, drains into the SVC. In addition, the right azygos vein typically drains into the SVC. The IVC becomes intrahepatic before draining into the right atrium. In a rostral position, the hepatic veins draining in the IVC can be seen. The portal veins will typically be seen in a more caudal and anterior position. In some cases, however, caudal hepatic veins can also be present and the echographer must rely on the fact that portal veins have thicker walls and that blood flow is opposite to the hepatic veins. Hepatic and portal veins are among the easiest structures to image because the liver is a very echogenic structure and Doppler analysis of the blood travelling in them can easily be performed. Information derived from hepatic veins has been shown to be very useful in the stratification of patients in shock.3,14 In a similar fashion, analysis of portal veins has been used to detect portal hypertension resulting from cirrhosis or elevated right atrial pressure.15,16
Finally, the pulmonary artery divides into left and right main arteries. The right portion goes under the aortic arch and divides in further ramifications. This infra-aortic position of the right pulmonary artery explains why ascending aortic aneurysm and aortic type A dissection can be associated with right ventricular dilatation since these pathologies can result in acute or chronic compression of the right pulmonary artery, which increases right ventricular afterload.
Echocardiographic examination of the heart
Acoustic windows and acoustic opportunities
Classical cardiac views are well described in the literature and include the parasternal long axis (LAX) and short axis (SAX); the apical four chamber (A4C), five chamber (A5C), and two chamber (A2C); and the subcostal or subxyphoid. These views are obtained from anatomical acoustic windows where the heart and great vessels can be interrogated (Fig. 4). For instance, the space between the left border of the sternum and the lung serves as a window for the parasternal view. The left lobe of the liver is often used as an acoustic window to the sub-costal view. Another view that may be used depending on the clinical context is obtained via the suprasternal region by orienting the scanning beam toward the heart and great vessels, just anterior to the trachea. With this view, 2D imaging of the ascending or descending aorta may be assessed. Doppler interrogation of the ascending or descending aorta measures blood velocity, which is proportional to the cardiac output. Therefore, a 12% increase in the Doppler signal can be interpreted as fluid responsiveness during fluid challenge or a passive leg-raising maneuver.17,18,19,20

Focused cardiac ultrasound study (FOCUS) examination. The FOCUS examination includes these important transthoracic echocardiographic views. Scanning should be performed in a systematic, clockwise fashion, from three main areas or acoustic windows: A-E) parasternal long and short-axis view, F-H) apical view, and I-K) subcostal view. Ao = aorta; LA = left atrium; LV = left ventricle; RA = right atrium; RV = right ventricle. (Reproduced with permission from Denault et al.)36
It is important to realize that the same cardiac structure can be seen from different angles by using these different acoustic windows (SAX, LAX, A4C, A5C, A2C, and subxyphoid views). The heart can be thought of as a house; you can look inside the heart (the house) through windows that are in the front, on the side, or from the backyard. What you see will be different according to the point of view and there may be obstacles (walls) preventing you from seeing certain aspects. Nevertheless, it is still the same house. From a clinical point of view, the limitations of one acoustic window can usually be compensated by examining the heart and great vessels from a different perspective (a different acoustic window).
Important steps before beginning the examination
There are four rules in performing bedside ultrasound, all based on positioning. Indeed, adequate positioning of the patient, the examiner, the ultrasound machine, and the ultrasound probe is critical to image acquisition.
-
1)
Positioning the patient: the patient should be as close as possible to the anesthesiologist echocardiographer or ultrasound examiner. Operating tables are generally designed to be as narrow as possible; however, this can become an issue in a recovery room or intensive care unit bed. In such situations, it is important to place the patient as close as possible to the examiner, also raising the height of the bed to make sure that the examiner’s back is straight and that the patient is at the level of the examiner’s elbow while performing an examination. Positioning the patient can also be used to optimize a specific acoustic window. For example, in the echo laboratory, the patient will be placed in a left lateral decubitus position with the left arm oriented upward while obtaining a long or short axis parasternal view. This position usually improves the quality of imaging from the parasternal view by bringing the heart closer to the thoracic wall and by opening the intercostal space in the left parasternal region.
-
2)
Positioning the examiner: in the cardiac echo laboratory, cardiologists and technicians will typically be positioned to the left side of the patient. In the operating room and intensive care unit, the position of the examiner will be personalized and determined by the environment. In the perioperative or intensive care unit environment, there is great variability between patients and the ultrasound examiner must be flexible.
-
3)
Positioning the ultrasound machine: the machine should be positioned on the same side of the patient as the examiner. The height of the machine keyboard should be adjusted so the examiner can stand upright.
-
4)
Positioning the ultrasound probe: probe positioning varies according to the convention being used (“cardiology vs radiology convention”). In this article, the cardiology convention will be used and probe orientation will be described accordingly. This means that the marker on the probe will be oriented upward for sagittal, longitudinal, and coronal views. On the screen for these views, cephalad structures will appear on the right and caudal on the left. In the radiology convention, cephalad structures will appear on the left and caudal on the right. For the transverse or SAX view, the marker will be pointing on the patient’s left. On the screen for these views, right-sided structures will appear on the left of the screen and left-sided structures on the right of the screen. This is the same for both cardiology and radiology conventions. When performing a 2D examination, the structure being examined should be as close to the probe as possible and ideally placed at a 90° angle. This will maximize the ultrasound waves being reflected back to the probe and improve image quality.
Before recording any image, the following three elements should be adjusted: gain, width, and depth. The overall gain should be increased to the minimum that allows the examiner to see the distal portion of the triangular ultrasound image. This will usually result in the proximal portion of the triangle being too “bright”. Nevertheless, regional gain adjustment is available on most echo machines and it is now possible to reduce gain for the proximal structures and increase it for the distal ones. In some machines, width can be increased or decreased. This will allow acquisition of a larger or smaller amount of information; however, a wider image will usually decrease the image quality and frame rate. Depth of scanning should initially be set at 25-30 cm to avoid missing important information such as a pleural effusion, pericardial effusion, or the intimal flap of an aortic dissection (Fig. 5). Only then can the depth be reduced to focus on more proximal structures and optimize frame rate as well as image quality.

Optimizing depth. A) Coronal view from the lower axillary line of the inferior vena cava (IVC) at 15 cm deep. B) Nevertheless, if depth is increased at 21 cm, an intimal flap in the abdominal aorta (Ao) resulting from a type B dissection can be seen
A common mistake when obtaining images is moving the probe too quickly. When teaching point-of-care ultrasonography, we often use the metaphor that the probe should move at the same speed as a growing plant. It is very important to remember that the normal heart is the size of a closed fist and clinical information can easily be overlooked when moving too fast. Another common mistake is trying to chase an image or a specific view. While being examined, some patients are breathing heavily and this can cause the image to become black (the probe is over a bony structure such as a rib) or grey (the lung moves between the probe and the structure being examined). Sometimes the best approach is not to move and wait for the image to come back since patients have to alternate between inspiration and exhalation, which will cause the rib or the lung to stop obstructing the view. The focus should always be on the structure you are trying to examine (e.g., left heart structures) and it may be necessary to adapt your technique to the challenges that a specific patient represents.
To obtain good images, it is important to use ultrasound gel and apply appropriate pressure on the probe to maintain good contact with the chest wall of the patient. The examiner’s hand holding the probe should also rest on the patient’s chest wall to avoid moving out of the acoustic window as well as provide image stability. Finally, the probe can be slid, angulated, or tilted (e.g., right to left or up and down) and rotated clockwise or counter-clockwise to optimize imaging. A summary of the various adjustments is provided in Fig. 6. The acronym SCAR, for sliding, centring, angulating, and rotating, indicates the typical sequence to obtain the following views.

Probe motion A) clockwise rotation, B) neutral position, C) counter-clockwise, D) left tilt, E) neutral position, F) right tilting of the probe, G) left sliding, H) neutral position of the probe, and I) right sliding. Vertical tilting of the probe, J) anterior tilting, K) neutral position, and L) inferior tilting. (With permission of CAE Healthcare, Ville St-Laurent, QC, Canada)
The parasternal views
Parasternal LAX view (Fig. 7)
The parasternal LAX acoustic window can be found from the 2nd to 5th intercostal space close to the left side of the sternum. The ultrasound probe orientation is toward the right shoulder (11 o’clock orientation) because the axis of the normal heart is typically oblique. Nevertheless, in certain patients, the heart can be in a more horizontal position (e.g., obese patients) while in others it is vertical (chronic obstructive lung disease patients). Consequently, the orientation may change and should only be used as a general guide. The orientation of the axis of the heart can help the examiner in making a diagnosis. For example, an unstable hypotensive patient with a vertical axis could be have a left-sided hemothorax or pneumothorax, pushing the heart vertically and medially. The same patient with a horizontal heart could have an abdominal over-distension or compartment syndrome.

Parasternal A-D) left ventricular and E-H) right ventricular views. LA = left atrium; LV = left ventricle; RA = right atrium; RV = right ventricle. (With permission of CAE Healthcare, Ville St-Laurent, QC, Canada)
Simple steps can be used to identify the LAX view (Fig. 8). First start in the 2nd left parasternal space where an acoustic window can be found; if not, you can turn the patient on the left side to bring the heart closer to the chest wall. Find the most anterior structure, typically the pulmonary artery, and then tilt the beam to the patient’s right to find the aortic root and aortic valve. If only great vessels are visualized, slide down to the 3rd or 4th intercostal spaces. As the acoustic window is identified, and then gentle orientation and positioning of the beam will be performed to obtain the “ideal” parasternal LAX view. A mix of clockwise or counter-clockwise movements and tilt on the longitudinal axis of the probe will help to obtain the best images. The “ideal” parasternal LAX view should have the apex appearing at 9 o’clock; the left ventricular outflow tract (LVOT), aortic root and proximal ascending aorta, mitral valve, and left atrium are all to be seen. Slight tilting of the probe on its short axis may help align the apex on the 9 o’clock position.

Steps in obtaining a parasternal long-axis view. Ao = aorta; LA = left atrium; LICS = left intercostal space; LV = left ventricle; PA = pulmonary artery. (With permission of CAE Healthcare, Ville St-Laurent, QC, Canada)
Left ventricle: in this view, the anteroseptal and the inferolateral walls of the left ventricle are visualized. In some patients, it may not be possible to see the left ventricle from the base all the way to its apex. Therefore, it may be necessary to perform a gentle sliding of the probe toward the apex to visualize the entire left ventricle.
Left atrium: in this position, the left atrium will be seen in the far right of the screen. This is the typical position where its dimension is measured. Nevertheless, it should be kept in mind that a single 2D measurement is not as precise at estimating the left atrial area when compared with the 3D measurement technique, which uses two orthogonal planes (typically the A4C view).
Right ventricle: the RVOT is seen as the structure closest to the ultrasound probe. The right ventricle can also be seen by tilting the probe on is long axis, thus directing the ultrasound beam to the patient’s right (Fig. 7 E-H). Initially the interventricular septum will be seen followed by the right ventricle, tricuspid valve, and right atrium.
Right atrium: the right atrium is not seen in the LAX view unless the beam is directed to the patient’s right. By performing this maneuver, in some patients it is possible to see both the IVC and the SVC entering the right atrium as well as the right atrium appendage. It is also an excellent view for the tricuspid valve.
Valves: the LAX offers a rapid evaluation of the aortic and mitral valve. Whenever evaluating cardiac valves, it is important to proceed in sequence by starting with a 2D evaluation followed by colour flow Doppler. Colour interrogation is useful to detect pathologies such as aortic or mitral regurgitation, abnormal mitral inflow velocity, and aortic outflow velocity. Nevertheless, 2D evaluation does provide important diagnostic information and can be essential for proper clinical management of a specific situation. For example, imagine identifying mitral regurgitation and increased aortic outflow velocity in a patient who is hemodynamically unstable. Nevertheless, upon 2D examination, you identify that the patient has a LVOT obstruction due to septal hypertrophy and that the mitral regurgitation is secondary to systolic anterior motion (SAM). This is an important diagnosis because it represents an absolute contraindication to the use of inotropes. Patients with SAM require a reduced heart rate, increased afterload, and adequate filling.21 The 2D information is likely to have completely changed your management of the situation. The tricuspid valve can be assessed in this view by tilting the beam to the patient’s right side.
Pericardium: the LAX offers a unique view to differentiate pericardial from pleural effusion. In pericardial effusion, fluid will be present between the left atrium and the aorta. This region will be devoid of fluid in the pericardial effusion (Fig. 9). Confirmation can be made using lung ultrasound of the left pleural space.

Effusions. The difference in location between A, C) a pleural and B, E) a pericardial effusion is shown in these diagrams from the Vimidex simulator. D) A parasternal long-axis transthoracic image with both types of effusions is shown. Ao = aorta; LV = left ventricle; RV = right ventricle. (Reproduced with permission from Denault et al.)36
Other use of the LAX view: abnormalities such as mitral or aortic valve vegetations and left atrial tumours or thrombus can be seen from this view (arrow) (Fig. 10).

Parasternal long-axis view showing A) a right ventricular outflow tract thrombus and B) type A aortic dissection with an intimal flap (arrow). LA = left atrium; LV = left ventricle; RV = right ventricle. (Reproduced with permission from Denault et al.)36
Parasternal SAX view (Fig. 11)
This view is obtained by performing a 90° clockwise rotation. Typically, the marker on the probe, which was pointing toward the right shoulder (11 o’clock orientation), will now be pointing at the left shoulder (1 o’clock orientation). If the image was centred on the aortic valve before the rotation, the examiner should obtain an orthogonal view (short axis of the aortic valve) with its three cusps and the classic “Mercedes-Benz” sign. The leaflets of the cusps are thin and should be barely visible. In some patients, the origin of the left and right coronary artery can be seen. It is also a good location to visualize the left atrium and the left atrial appendage. The interatrial septum should be examined as its motion correlates with filling pressure.22,23 This is also an excellent view to assess the permeability of a patent foramen ovale by performing a bubble contrast study.

Transthoracic short-axis echocardiographic views using the Vimedix simulator. AoV = aortic valve; MV = mitral valve; PA = pulmonary artery; PM = papillary muscle; SAX = short-axis. (Reproduced with permission from Denault et al.)36
Moving the ultrasound beam upward, a view of the RVOT can be obtained with the origin of the pulmonary valve. To optimize the view of the pulmonary artery bifurcation, further rotation to a transverse or 3 o’clock view can be used. This view is similar to the one obtained with computed tomography. Pulmonary emboli and saddle embolism can be seen from that view.
Coming back with the probe pointing toward the left shoulder and the SAX view of the aortic valve, the probe can be tilted toward the apex of the heart to obtain an SAX view of other structures. The first structure that will be encountered is the mitral valve with its classic fish-mouth appearance. It is important to make sure that both ends of the opening are symmetrical since this is indicative of a “crooked” orientation (Fig. 12). A slight clockwise or counter-clockwise rotation will usually be sufficient to correct this situation. This view is also excellent to assess the base of the heart. Tilting further will allow the examiner to view the two papillary muscles and is called the mid-papillary view. In some patients, it may be necessary to slide toward the apex of the heart in a different intercostal space to obtain this view. The mid-papillary view provides important information regarding coronary perfusion in the three major vessels (i.e., the left coronary, right coronary, and circumflex). New wall motion anomalies are an early sign of myocardial ischemia and usually occur well before electrocardiographic changes occur. In addition, attention should be paid to the interventricular septum since it may provide valuable clues in conditions resulting in right ventricular pressure or volume overload (Fig. 13). This is called the eccentricity index and is used to determine the severity of pulmonary hypertension.24 Normally the interventricular septum should be concave on the left and convex on the right. As the right ventricular end-diastolic pressure increases, the interventricular septum changes and becomes D-shaped in diastole. If the D shape is present in both systole and diastole, a more severe form of pulmonary hypertension should be suspected. If the D shape is only present in diastole, fluid overload should be suspected.

Mitral valve view A, B) skewed or misaligned appearing as a seventh nerve palsy appearance and B) adequate with a closed normal mouth appearance. LV = left ventricle; RV = right ventricle. (With permission of CAE Healthcare, Ville St-Laurent, QC, Canada)

A, B) Using the mid-papillary short-axis view, the eccentricity index corresponds to the ratio of the vertical (V)/horizontal (H) diameter of the left ventricle (LV). C, D) In fluid overload, the H dimension is smaller than the V dimension only during systole but in pressure overload, it remains smaller in both systole and diastole. RV = right ventricle. (Reproduced with permission from Denault et al.)36
Apical views
Apical four-chamber view (Fig. 14)

Optimal four-chamber view. A, B) Coronal view of the cardiac chambers will result in alignment of the right and left pulmonary veins (PV); this will lead to C) an ideal 2D ultrasound four-chamber view. 2D = two-dimensional; LA = left atrium; LV = left ventricle; RA = right atrium; RV = right ventricle. (With permission of CAE Healthcare, Ville St-Laurent, QC, Canada)
The A4C view can be facilitated by manually palpating the apex to determine where the probe should be placed. In obese patients, the apex will often be displaced laterally since the heart usually assumes a more horizontal position. Another approach would be to project where the apex is to be expected based on the axis observed during the LAX view examination. The probe should be placed in a horizontal position with the marker pointing to the left of the patient and starting in the anterior axillary line. Follow these simple steps (Fig. 15):

Steps in obtaining an apical four-chamber view. IAS = interatrial septum; IVS = interventricular septum; LA = left atrium; LV = left ventricle; RA = right atrium; RV = right ventricle. (With permission of CAE Healthcare, Ville St-Laurent, QC, Canada)
-
1)
Bring the apex in the middle of the screen by sliding the probe laterally to medially.
-
2)
Align the apex vertically with the interventricular septum by tilting the probe on its short axis.
-
3)
Identify the optimal coronal view of the heart (Fig. 13). The optimal coronal axis of the heart is the one where the heart is cut from the middle of the apex to the middle of the left atrium close to the lower pulmonary veins. In some patients, the apical acoustic window will lead to a beam position above the true apex and in other patients it will be below. The beam may be turned too far clockwise or counter-clockwise. These inappropriate positions will lead to the inability to obtain an optimal combined apical and atrial view (Fig. 16). To ensure being in the proper coronary plane, the coronary sinus and aortic root can be used as landmarks. When the probe is tilted too anteriorly, the aortic root will appear and it signals the need to angulate downward to obtain the true coronal plane. Similarly, when the probe is tilted too posteriorly, the coronary sinus will come into view, which is a sign that the probe should be tilted upward. Clockwise or counter-clockwise rotation of the probe may be necessary to optimize visualization of the ventricles and obtain a true four-chamber view. When performing these rotation motions, the echographer should focus on the left ventricle first and then the right-sided structures.
Fig. 16 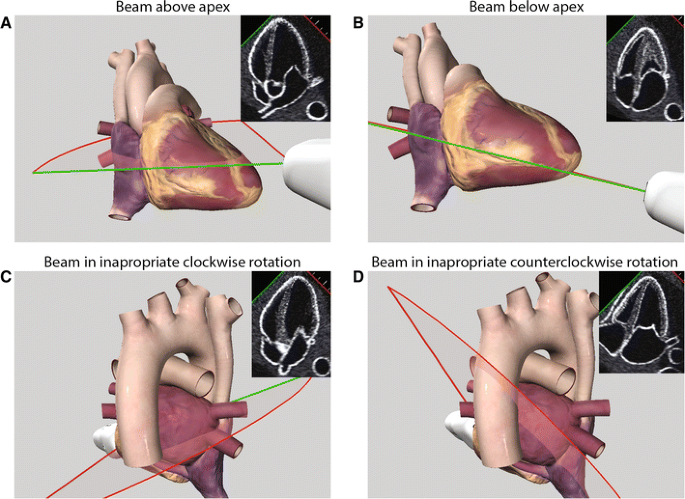
Pitfall in imaging the apical four-chamber view. (With permission of CAE Healthcare, Ville St-Laurent, QC, Canada)

By comparing the relative size of the apical portion of the right and left ventricle, it is possible to diagnose right ventricular dilatation (Fig. 17). Left ventricular septal and lateral wall motion can be evaluated from that view. Left and right atrial size can also be evaluated and compared. Both the mitral and tricuspid valves can be assessed, and with slight tilting of the ultrasound beam anteriorly, the aortic valve Doppler flow can be assessed as well. This view corresponds to the A5C view. Although a detailed discussion of quantitative analysis of the aortic valve gradient and area measurement is beyond basic examination or the scope of this article, the reader should be aware of this view and its clinical usefulness.

Right ventricular assessment. Apical four-chamber views and corresponding views from the Vimedix simulator are shown for A, B) a normal patient, C, D) a patient with moderate dilatation of the right ventricle (RV) from pulmonary hypertension, and E, F) severe RV dilatation from a ventricular septal defect. LA = left atrium; LV = left ventricle; RA = right atrium. (Reproduced with permission from Denault et al.)36
In the A4C view, the IAS can also be evaluated. The position and mobility of the IAS are very useful in hemodynamic management because they represent the relationship between the right and the left atrial pressure.22,23 A fixed position or deviation of the IAS to the left typically indicates right-sided pathology such as right ventricular failure. Deviation of the IAS to the right indicates a left-sided pathology. In a study by Haji et al.,23 septal curvature of the IAS correlated with left-sided filling pressure. Further scanning steering the beam anteriorly to the aortic valve can reveal the right ventricular inflow, RVOT, pulmonary valve, artery, and bifurcation.
Apical two-chamber view (Fig. 18)

Transthoracic two-chamber apical echocardiographic views using the Vimedix simulator. Ao = aorta; IVC = inferior vena cava; LA = left atrium; LV = left ventricle; RA = right atrium; RV = right ventricle; SVC = superior vena cava. (With permission of CAE Healthcare, Ville St-Laurent, QC, Canada)
To obtain the A2C view, rotate the probe counter-clockwise (45-80°) from the A4C view. In this view, the left ventricular anterior wall is on the right side of the screen and the LV inferior wall is on the left. The mitral valve, left atrium, and part of the ascending aorta will be seen (Fig. 18 A-D). Beam tilting to the right on its long axis can give a nice view of the LVOT (Fig. 18 E-H). Furthermore, in some patients the A2C view can provide one of the most spectacular views of the right ventricle where its “crescent” shape can easily be appreciated (Fig. 18 I-L). The inflow and outflow tracts of the right ventricle can be seen simultaneously. Further counter-clockwise to the right is the bi-caval view.
The subcostal view (Fig. 19)

Optimal subcostal view. A, B) Lateral coronal view of the cardiac chambers will result in alignment of the right and left pulmonary veins (PV); this will lead to C) an ideal 2D ultrasound four-chamber view. LA = left atrium; LV = left ventricle; RA = right atrium; RV = right ventricle. (With permission of CAE Healthcare, Ville St-Laurent, QC, Canada)
The subcostal view is another coronal view to the heart from a different angle. To obtain the subcostal view, start by manually palpating the subxyphoid cartilage or the lower border of the sternum. The probe is positioned in a horizontal position with the marker pointing to the left side of the patient. To obtain a subcostal view, the following steps should be taken (Fig. 20).

Steps in obtaining a subcostal view. IAS = interatrial septum; IVC = inferior vena cava; LA = left atrium; LV = left ventricle; RA = right atrium; RV = right ventricle. (With permission of CAE Healthcare, Ville St-Laurent, QC, Canada)
-
1)
Position the patient on their back with slight elevation of the trunk and/or flexion at the hips.
-
2)
Press firmly on the probe to push against the abdominal wall.
-
3)
Tilt the probe upward on its long axis to orient the beam posteriorly toward the liver and find the IVC.
-
4)
Follow the IVC up by tilting the probe downward on its long axis to the right atrium and align it with the left atrium and the IAS by tilting the probe on its short axis.
-
5)
Then align both atria with the ventricles to get a coronal view (Fig. 19) of the heart. This is done by gently rotating the probe counter-clockwise (most of the time) or clockwise. This view is similar to the A4C but the heart is now examined by looking through the right atrium instead of the apex. With this approach, the left lobe of the liver is used as an acoustic window.
-
6)
Bring the right atrium in the middle of the screen and then apply a counter-clockwise rotation on the probe. The IVC will be seen in a longitudinal or sagittal fashion.
The subcostal view is the most useful when examining a patient in the supine position because both cardiac function and the IVC can be evaluated from the same acoustic window. It is the closest view to the right atrium. It is also sometimes the only view you can get in an unstable patient during resuscitation or a patient in respiratory distress who cannot be turned on the left side.
This view has the same advantage as the A4C. Similarly, directing the beam anteriorly will bring the aortic valve, right ventricular inflow, right ventricular outflow tract, and the pulmonary valve, artery, and bifurcation (Fig. 21). A counter-clockwise 90° rotation can sometimes be used to obtain an SAX view of the heart (specially in a patient with a horizontal heart). Conditions such as tamponade and right atrial or ventricular dilatation can be diagnosed with this view (Fig. 22).2,3

Transthoracic subcostal echocardiographic views using the Vimedix simulator. Ao = aorta; IVC = inferior vena cava; LA = left atrium; LV = left ventricle; MPA = main pulmonary artery; RA = right atrium; RV = right ventricle; SVC = superior vena cava. (With permission of CAE Healthcare, Ville St-Laurent, QC, Canada)

Subcostal views showing A, B) cardiac tamponade occurring in a 53-yr-old female treated for pericarditis. The transthoracic subcostal view shows right atrial collapse from the pericardial effusion (PE). C, D) A 67-yr-old male presented to the emergency room with hemodynamic instability. The subcostal view examination revealed dilatation of the right atrium (RA) and the right ventricle (RV). The left ventricle (LV) was compressed by the RV. LA = left atrium. (Reproduced with permission from Denault et al.)36
Echocardiographic examinations of the great vessels
Aorta (Fig. 23)

Aortic views using left parasternal, A-D) medial, and (E-H) lateral views at 90°. Ao = aorta; LA = left atrium; RV = right ventricle. (With permission of CAE Healthcare, Ville St-Laurent, QC, Canada)
The ascending aorta is the closest to the ultrasound probe from the LAX view. Moving up the parasternal acoustic windows can allow a larger portion of the ascending and descending aorta to be seen as long as the beam orientation is at 12 o’clock (Fig. 23). The suprasternal view can also allow visualization of the ascending and descending portion in some patients (Fig. 24). Pulsed-wave Doppler aiming at the ascending or descending aorta can be used in non-intubated patients to evaluate fluid responsiveness following a leg-raising maneuver.17,18,19,20 Branches such as the carotid are more easily seen in the neck using a linear probe. The descending thoracic aorta can be seen using the heart as an acoustic window through the parasternal windows. Orientation of the beam to 90° can reveal a longitudinal view in some cases. In patients with left-sided pleural effusions, the descending aorta can be easily seen. The descending aorta can be seen through the spleen; however, the subcostal view is the easiest through the liver. Once the IVC is identified, tilting the beam to the patient’s left can reveal the descending aorta and its branches, which include the celiac trunk and mesenteric arteries. Dissection of the aorta can be diagnosed using bedside ultrasound. Dissection of the aorta is known as the “great imitator” because its clinical presentation can vary greatly depending on the location as well as the extent of the dissection; acute pericardial effusion, myocardial dysfunction/ischemia, right ventricular dysfunction with acute compression of the right pulmonary artery, stroke, pleural effusion, and chest or abdominal pain are a few of the possible clinical presentations.

Aortic views using a suprasternal A-D) anterior for the ascending aorta (Ao) and E-H) posterior for the descending Ao. This view is ideal to measure a Doppler signal and estimate cardiac output. (With permission of CAE Healthcare, Ville St-Laurent Canada)
Venae cavae (Fig. 25)

Bi-caval examination using a left parasternal view at 90°. Ao = aorta; IVC = inferior vena cava; RA = right atrium; SVC = superior vena cava. (With permission of CAE Healthcare, Ville St-Laurent, QC, Canada)
The SVC can be seen through a parasternal window. Using the LAX view at a 12 o’clock position, the origin of the SVC, right atrium, and, in some patients, IVC can be seen as in Fig. 26. The A2C can also be used. From the left internal jugular vein, one can see the origin of the SVC. Pulsed-wave or colour Doppler using a linear probe is a very simple technique to evaluate fluid responsiveness in an intubated patient. As shown using transesophageal echocardiography,25 in hypovolemic patients positive-pressure inspiration will result in a collapse of the SVC. In such a case, the venous flow from the SVC will be reversed as opposed to being continuous during positive inspiration (Fig. 26). The IVC can be seen from a subcostal view as it enters into the right atrium. Nevertheless, any transhepatic view (Fig. 27) can be used to image the IVC. The respiratory variation of the IVC can be used as a sign of fluid responsiveness in spontaneously breathing patients (Fig. 27).

Respiratory variation of the superior vena cava (SVC). A 76-yr-old male in the intensive care unit is dialyzed for 1.8 L fluid removal. A transesophageal, mid-esophageal ascending aorta (Ao) short-axis view with M-mode of the SVC shows significant respiratory variation of the SVC diameter. A, B) With a linear probe positioned in the right cervical region over the distal internal jugular, the phasic respiratory changes in Doppler signals with reversal can be appreciated in a much less invasive fashion. (Reproduced with permission from Denault et al.)36

Inferior vena cava (IVC) diameter. Subcostal longitudinal views of the IVC with respiratory variation are shown with A) two-dimensional and B) M-mode. C) The IVC diameter is measured within 1.5 cm of the IVC-right atrial junction just before the hepatic vein (HV). (Reproduced with permission from Denault et al.)36
Pulmonary artery
The main pulmonary artery and its bifurcation are most easily seen in the SAX view in a transverse view (Fig. 11). Similar to the aorta, suprasternal views can also be used to visualize the pulmonary artery which is to the patient’s left of (i.e., medial to) the aorta. From an SAX view, positioning the probe in a 0° orientation permits the identification of both the right and left pulmonary artery. In several patients, however, the medial portion of the lung will prevent adequate visualization of those structures. Apical and subcostal views can sometimes reveal the proximal portion of the pulmonary artery.
Qualitative vs quantitative evaluation
As a novice in bedside point-of-care ultrasound, one will mostly rely on qualitative evaluation of function and structure. In terms of cardiac function in the presence of hemodynamic instability, an anesthesiologist must decide if inotropes will be used. They are considered in severe left or right ventricular dysfunction. In mild to moderate dysfunction they can also be used; however in hyperdynamic hearts or in the presence of LVOT or RVOT obstruction inotropes are contraindicated. Such decisions are based mostly on pattern recognition rather than precise measurements. Nevertheless, as experience increases, a more quantitative approach can be used. This will be particularly useful in determining for example if a cavity is normal or dilated (i.e., ventricular or atrial). The reader is referred to guidelines for cardiac chamber quantification.26 Quantification of the severity of aortic stenosis is beyond the scope of the point-of-care evaluation. Nevertheless, recognition or suspicion of a valvular pathology, either stenosis or regurgitation, should prompt consultation for confirmation and assessment of severity by an expert colleague or an echocardiographist. Guidelines for the evaluation of valvular heart disease and prosthesis have been recently updated.27,28,29
Special applications of the examination of the heart and great vessels
In 2010, Labovitz published guidelines for the use of focused cardiac ultrasound in the emergent setting.30 The five indications for these guidelines are assessment of pericardial effusion, assessment of global cardiac function, indication of marked right and left ventricular assessment, intravascular volume assessment, and confirmation of transvenous pacing wire placement. In the operating room room, those conditions will present as hemodynamic instability, hypoxemia, or the combination of both. The approach to hemodynamic instability was described previously as a two-part series in the Journal in 2014.2,3 In terms of hypoxemia, the vast majority will be related to pulmonary pathologies, which will be discussed in the section on the lung and pleura. We previously proposed a simple approach to hypoxemia.31 Nevertheless, cardiac examination should always be performed in the presence of hypoxemia to rule out for instance myocardial dysfunction associated with pulmonary edema or because of septic shock with pneumonia. Myocardial dysfunction can occur in up to 50% of patients with septic shock,32 particularly right ventricular dysfunction.33 In the presence of normal lung examination, intracardiac shunt or massive pulmonary embolism should be ruled out.
Pitfalls of the 2D examination
There are several pitfalls of the 2D examination. Some of them have been highlighted with the use of 3D echocardiography in terms of misalignment in the measurement of cardiac structures or valvular evaluation. Other pitfalls are related to operator experience. For instance, hyperdynamic cardiac function associated with pulmonary edema can be the result of severe mitral regurgitation particularly in patients with SAM, as mentioned previously, which could be missed if colour Doppler evaluation is not performed. We often observe a strong focus on left ventricular function in novice users of ultrasound. For example, we have found that the hypertrophied left ventricle is often misinterpreted as a sign of hypovolemia and that the right ventricle is often neglected, resulting in excessive fluid administration followed by complications of fluid overload34 including right heart failure. It is therefore important not to treat an image but a patient while integrating all the clinical and imaging information, including assessment of both ventricles.
Among pitfalls of 2D examination are the recognition of 2D artefacts. Detailed description of those are beyond the scope of this manuscript but are important to acknowledge in using bedside 2D ultrasound.35 Finally, pitfalls could be generated by poor quality of images and lack or mistaken integration of the echographic findings with the clinical situation.
In summary, 2D echographic examination of the heart and great vessels is a clinical skill likely to be mastered by every anesthesiologist in the 21st century. These skills will be integrated into routine practice in the pre-, intra-, and postoperative period. Imaging the heart and great vessel structures will enhance the clinical examination of the patient by direct visualization. Nevertheless, clinical decisions should not be based on 2D images alone. The integration of the echocardiographic information with the case story, physical examination, laboratory data, and other relevant clinical information should become the way of the future and this will benefit the patients under our care.
References
Zhang J, Critchley LA. Inferior vena cava ultrasonography before general anesthesia can predict hypotension after induction. Anesthesiology 2016; 124: 580-9.
Denault A, Vegas A, Royse C. Bedside clinical and ultrasound-based approaches to the management of hemodynamic instability–part I: focus on the clinical approach: continuing professional development. Can J Anesth 2014; 61: 843-64.
Vegas A, Denault A, Royse C. A bedside clinical and ultrasound-based approach to hemodynamic instability - part II: bedside ultrasound in hemodynamic shock: continuing professional development. Can J Anesth 2014; 61: 1008-27.
Denault AY, Couture P. Practical diastology. World J Anesthesiol 2014; 3: 96-104.
Nagueh SF, Smiseth OA, Appleton CP, et al. Recommendations for the evaluation of left ventricular diastolic function by echocardiography: an update from the American Society of Echocardiography and the European Association of Cardiovascular Imaging. J Am Soc Echocardiogr 2016; 29: 277-314.
Bryson GL, Grocott HP. Point-of-care ultrasound: a protean opportunity for perioperative care. Can J Anesth 2018; 65. DOI: https://doi.org/10.1007/s12630-018-1069-3.
Hessel EA 2nd. Takotsubo cardiomyopathy and its relevance to anesthesiology: a narrative review. Can J Anesth 2016; 63: 1059-74.
Haddad F, Hunt SA, Rosenthal DN, Murphy DJ. Right ventricular function in cardiovascular disease, part I: anatomy, physiology, aging, and functional assessment of the right ventricle. Circulation 2008; 117: 1436-48.
Voci P, Bilotta F, Caretta Q, Mercanti C, Marino B. Papillary muscle perfusion pattern. A hypothesis for ischemic papillary muscle dysfunction. Circulation 1995; 91: 1714-8.
Sukernik MR, Mets B, Bennett-Guerrero E. Patent foramen ovale and its significance in the perioperative period. Anesth Analg 2001; 93: 1137-46.
Mahmud E, Raisinghani A, Keramati S, Auger W, Blanchard DG, DeMaria AN. Dilation of the coronary sinus on echocardiogram: prevalence and significance in patients with chronic pulmonary hypertension. J Am Soc Echocardiogr 2001; 14: 44-9.
Ucar O, Pasaoglu L, Cicekcioglu H, Vural M, Kocaoglu I, Aydogdu S. Persistent left superior vena cava with absent right superior vena cava: a case report and review of the literature. Cardiovasc J Afr 2010; 21: 164-6.
Moral S, Ballesteros E, Huguet M, Panaro A, Palet J, Evangelista A. Differential diagnosis and clinical implications of remnants of the right valve of the sinus venosus. J Am Soc Echocardiogr 2016; 29: 183-94.
Hulin J, Aslanian P, Desjardins G, Belaidi M, Denault A. The critical importance of hepatic venous blood flow Doppler assessment for patients in shock. A A Case Rep 2016; 6: 114-20.
Tang WH, Kitai T. Intrarenal venous flow: a window into the congestive kidney failure phenotype of heart failure? JACC Heart Fail 2016; 4: 683-6.
Denault AY, Beaubien-Souligny W, Elmi-Sarabi M, et al. Clinical significance of portal hypertension diagnosed with bedside ultrasound after cardiac surgery. Anesth Analg 2017; 124: 1109-15.
Lamia B, Ochagavia A, Monnet X, Chemla D, Richard C, Teboul JL. Echocardiographic prediction of volume responsiveness in critically ill patients with spontaneously breathing activity. Intensive Care Med 2007; 33: 1125-32.
Monnet X, Teboul JL. Volume responsiveness. Curr Opin Crit Care 2007; 13: 549-53.
Monnet X, Teboul JL. Passive leg raising. Intensive Care Med 2008; 34: 659-63.
Narasimhan M, Koenig SJ, Mayo PH. Advanced echocardiography for the critical care physician: part 2. Chest 2014; 145: 135-42.
Rochon AG, L’Allier PL, Denault AY. Always consider left ventricular outflow tract obstruction in hemodynamically unstable patients. Can J Anesth 2009; 56: 962-8.
Kusumoto FM, Muhiudeen IA, Kuecherer HF, Cahalan MK, Schiller NB. Response of the interatrial septum to transatrial pressure gradients and its potential for predicting pulmonary capillary wedge pressure: an intraoperative study using transesophageal echocardiography in patients during mechanical ventilation. J Am Coll Cardiol 1993; 21: 721-8.
Haji DL, Ali MM, Royse A, Canty DJ, Clarke S, Royse CF. Interatrial septum motion but not Doppler assessment predicts elevated pulmonary capillary wedge pressure in patients undergoing cardiac surgery. Anesthesiology 2014; 121: 719-29.
Haddad F, Guihaire J, Skhiri M, et al. Septal curvature is marker of hemodynamic, anatomical, and electromechanical ventricular interdependence in patients with pulmonary arterial hypertension. Echocardiography 2014; 31: 699-707.
Vieillard-Baron A, Chergui K, Rabiller A, et al. Superior vena caval collapsibility as a gauge of volume status in ventilated septic patients. Intensive Care Med 2004; 30: 1734-9.
Lang RM, Badano LP, Mor-Avi V, et al. Recommendations for cardiac chamber quantification by echocardiography in adults: an update from the American Society of Echocardiography and the European Association of Cardiovascular Imaging. J Am Soc Echocardiogr 2015; 28(1–39): e14.
Zoghbi WA, Chambers JB, Dumesnil JG, et al. Recommendations for evaluation of prosthetic valves with echocardiography and Doppler ultrasound: a report from the American Society of Echocardiography’s Guidelines and Standards Committee and the Task Force on Prosthetic Valves, developed in conjunction with the American College of Cardiology Cardiovascular Imaging Committee, Cardiac Imaging Committee of the American Heart Association, the European Association of Echocardiography, a registered branch of the European Society of Cardiology, the Japanese Society of Echocardiography and the Canadian Society of Echocardiography, endorsed by the American College of Cardiology Foundation, American Heart Association, European Association of Echocardiography, a registered branch of the European Society of Cardiology, the Japanese Society of Echocardiography, and Canadian Society of Echocardiography. J Am Soc Echocardiogr 2009; 22: 975-1014.
Baumgartner H, Hung J, Bermejo J, et al. Echocardiographic assessment of valve stenosis: EAE/ASE recommendations for clinical practice. J Am Soc Echocardiogr 2009; 22: 1-23.
Zoghbi WA, Adams D, Bonow RO, et al. Recommendations for noninvasive evaluation of native valvular regurgitation: a report from the American Society of Echocardiography developed in collaboration with the Society for Cardiovascular Magnetic Resonance. J Am Soc Echocardiogr 2017; 30: 303-71.
Labovitz AJ, Noble VE, Bierig M, et al. Focused cardiac ultrasound in the emergent setting: a consensus statement of the American Society of Echocardiography and American College of Emergency Physicians. J Am Soc Echocardiogr 2010; 23: 1225-30.
Piette E, Daoust R, Denault A. Basic concepts in the use of thoracic and lung ultrasound. Curr Opin Anaesthesiol 2013; 26: 20-30.
Jardin F, Fourme T, Page B, et al. Persistent preload defect in severe sepsis despite fluid loading: a longitudinal echocardiographic study in patients with septic shock. Chest 1999; 116: 1354-9.
Mitsuo T, Shimazaki S, Matsuda H. Right ventricular dysfunction in septic patients. Crit Care Med 1992; 20: 630-4.
Beaubien-Souligny W, Bouchard J, Desjardins G, et al. Extracardiac signs of fluid overload in the critically ill cardiac patient: a focused evaluation using bedside ultrasound. Can J Cardiol 2017; 33: 88-100.
Blanco P, Volpicelli G. Common pitfalls in point-of-care ultrasound: a practical guide for emergency and critical care physicians. Crit Ultrasound J 2016; 8: 15.
Denault AY, Vegas A, Lamarche Y, Tardif JC, Couture P. Basic Transesophageal and Critical Care Ultrasonography. London: CRC Press; 2017 .
Conflicts of interest
A.Y. Denault is an instructor for CAE Healthcare and on the Speakers Bureau for Edwards, Medtronic and Masimo; A.Y. Denault, S. Langevin, M.R. Lessard, J.F. Courval, and G. Desjardins give courses on ultrasound using CAE Healthcare simulators.
Editorial responsibility
This submission was handled by Dr. Gregory L. Bryson, Deputy Editor-in-Chief, Canadian Journal of Anesthesia.
Funding
Supported by the Richard I. Kaufman Endowment Fund in Anesthesia and Critical Care.
Author information
Authors and Affiliations
Corresponding author
Rights and permissions
About this article

Cite this article
Denault, A.Y., Langevin, S., Lessard, M.R. et al. Transthoracic echocardiographic evaluation of the heart and great vessels. Can J Anesth/J Can Anesth 65, 449–472 (2018). https://doi.org/10.1007/s12630-018-1068-4
Received:
Revised:
Accepted:
Published:
Issue Date:
DOI: https://doi.org/10.1007/s12630-018-1068-4