
Abstract
The present study aims to explore connectivity and networking in Late Bronze Age (LBA)/Early Iron Age (EIA) Greece and the Balkans using morphological biodistance analysis and test the potentiality of newly introduced statistical tests, which were designed for challenging datasets, in this particular cultural area. Cranial non-metric traits were recorded in ten skeletal collections, spanning from East Crete to Romania. We followed an experimental statistical approach encompassing two different measures of divergence, the conventional and well-tested mean measure of divergence (MMD) and the newly introduced untransformed measure of divergence (UMD). Though different, results based on these two measures are mutually supporting and show that biodistances in our regional case studies mainly follow the isolation by distance model. This cautiously confirms our main hypothesis that during the LBA and EIA periods in Greece and the Balkans, personal mobility was a slow process characterized by integration, rather than displacement or transformation. The current study is the first one to infer biological affinities using cranial non-metric analysis combined with artifactual evidence, in LBA/EIA Greece and the Balkans. Building a larger dataset through future non-metric analyses will better enable exploring networking and mobility to further complement ongoing bioarchaeological, genetic, and material culture studies.
Introduction
Mobility and migration are themes of regular interest in European and Mediterranean prehistory. The later Bronze Age (1700–1000 BC) is a common focus, when globalizing connections linked groups far and near in unprecedented ways. This study aims to better understand interactions between communities of the western and Southern Balkan peninsula and the Aegean islands. Building on long-standing material culture markers for mobility, through the proxy of human remains, we explore differences between communities during the Bronze Age-Iron Age transition. Connections with the eastern Mediterranean have a long research history, and more recent work has drawn attention to material markers of mobility linking groups in Europe (Borgna 2009; Borgna and Càssola Guida 2009; Bulatović et al. 2021; Iacono 2019; Iacono et al. 2021; Jung and Mehofer 2013; Molloy 2016; Ruppenstein 2020). This is particularly important as the focus of this paper is on communities connected by land or short stretches of water where personal mobility of various modes may be predicted (Anthony 1997).
We studied a sample of human remains in a transect of culturally diverse groups from the Carpathian Basin to Crete. To document how closely cemetery communities were related using human remains, we looked at markers of biodistance. By “cemetery community” we refer to an ancient community represented by their corresponding cemeteries (as an association with settlement remains may not always be possible). The method employed is non-metric trait analysis, which documents morphological variants of the human skeleton (e.g., Buikstra and Ubelaker 1994; Hefner and Linde 2018; Tyrrell 2000). This method provides a point of contact between biomolecular and macroscopic bioarchaeological research (e.g., Herrera et al. 2014; Hubbard et al. 2015; Ricaut et al. 2010). The study is partly exploratory due to the often poor preservation of the human remains we studied, a factor that also impacts detrimentally on genetic datasets also used to evaluate themes of connectedness and biodistance. The human remains studied most commonly date between 1400 and 1100 BC.
In our study area, societal crises around 1200 BC culminated in the collapse of social systems in the Aegean and Carpathian Basin (Molloy 2023). Changes in terrestial and maritime mobility leading up to and following this collapse have been used to model the causes and impacts of this transition in the twelfth to tenth centuries BC (Cline 2021; Emanuel 2017; Hitchcock and Maeir 2014; Jung 2009; Knapp 2021; Knapp and Manning 2016; Knodell 2021; Middleton 2010, 2017, 2020; Molloy 2023; Wallace 2018). Population mobility of various degrees must have been a commonplace phenomenon in the Late Bronze Age Mediterranean world, yet stability and a long-term sense of space and community are also fundamental concepts for the study of this time period (Leppard et al. 2020).
Cultural expression—particularly Mycenaean identity—supported stability and belonging at a political level without implying ethnic or genetic unity. “Mycenaean” is an archeological shorthand for distinct population groups that used and exchanged to varying degrees similar material culture, mortuary practices, language, and architecture. There remained a degree of diversity in the hinterlands of societies centered on palaces, and looking progressively farther north, groups selectively used elements of Mycenaean cultural materials alongside non-Mycenaean style objects and practices. We therefore recognize plurality and choice in degrees of “being Mycenaean” within Greece (Barrett and Boyd 2019; Boyd 2016a, b; Feuer 2011). While this cautionary note may be redundant for prehistorians, it is raised due to the conflation of this culture-history term and populations in recent archaeogenetics publications (Lazaridis et al. 2017, 2022; Clemente et al. 2021). If being Mycenaean is not implicitly meaningful, in order to understand how different groups within the territory of Greece and the surrounding areas are interrelated, we must evaluate separate communities—through their cemeteries—as building blocks of societies. By focusing on human remains, our intent is to engage with critiques of a mismatch between archaeogenetic and archeological research in studies of personal mobility and culture change (see Gori and Abar 2023 for a recent overview).
The Aegean and South Balkans
In our study, we focus on Late Bronze Age/Early Iron Age Greece and the Balkans. We include a broad cross-section of case studies representing different forms of social organization. Achaea, represented here by the sites of KallitheaFootnote 1 and Voudeni, was connected with Italy and parts of non-Mycenaean areas of Greece (Arena 2015; Giannopoulos 2009; Iacono 2019; Jung and Mehofer 2013; Moschos 2009; Tartaron 2014). Although a fortified central structure occurs at Teichos Dymaion, Achaea lacks palatial buildings, and there is as yet no known palatial center (see, however, Paschalidis 2018, 14–15). The community of Kamini Varis in Attika was set within the heartland of the palatial world, bordered by clusters of palaces in Boeotia, Peloponnese, and probably Athens (Osborne 2020). This community occupied the Aegean coast, linking it to the islands, including Crete. East Crete is represented by Halasmenos, Vasiliki-Kamaraki, Istron Kalo Chorio, and Azoria. The Cretan assemblages include remains dating to the LH IIIC to Protogeometric periods and represent the inhabitants of small upland villages or defensible settlements that also participated in long-distance networks (Coulson and Tsipopoulou 1994; Tsipopoulou et al. 2003; Wallace 2018). Monumental tholoi and chamber tombs housing collective burials were dominant burial architecture types during the Mycenaean period in Central and Southern Greece (e.g., Cavanagh and Mee 1998; Boyd 2002, 49–66). Tholoi as well as chamber tombs accommodated collective inhumation burials interred during different funerary episodes (singular and/or multiple, primary and/or secondary burials) (e.g., Moutafi 2021, 30). Similar burial rituals and tomb architecture were used at the Achaean sites, Kamini Varis, and the East Crete group included in this paper.
Other groups farther afield in Epirus and Macedonia in Greece selectively used Mycenaean and Southern Balkan artifacts of material culture as well as a mix of local styles (Bulatović et al. 2021; Eder 2009; Gori and De Angelis 2017; Krapf 2021, 2017; Tartaron 2004). These communities occupied a variety of site types, including tells such as Assiros, Toumba, or Kastanas, and enclosed sites, such as Ephyra (Andreou et al. 1996). The community at Achlada was well networked to the north and south (Michael et al. 2021; Ziota 2019). Single inhumations placed in cist/pit graves being the norm in Northern Greece/Southern Balkans contrast with the collective burials common to Central and Southern Greece (e.g., Tartaron 2004). The same pattern of single inhumations placed in individual grave cuts was also found in Achlada (Michael et al. 2021, 26; Ziota 2019). The picture is of a region connected selectively and where material culture use was often highly instrumentalized. Social ties and movement between polities would have followed a range of recognized pathways.
Central Balkans to Carpathian Basin
Looking north to the Central Balkans and the Carpathian Basin, material culture (and pottery in particular) was more extensively used to express social similarity and difference between communities and regions. In seeking to make order of this, the use of culture-history groups has a long tradition. We do not critique this here but rather draw attention to how objects were instrumentalized to express similarity and difference more visibly than in the Aegean area. The southern Carpathian Basin was home to a complex and dense settlement network (Molloy et al. 2020).
A Middle Bronze Age system centered on tell sites gave way between 1600 and 1500 BC to a new social order centered on large open settlements that thrived until ca. 1200 BC (Kienlin 2020; Molloy 2023; Nicodemus and O’Shea 2019). Mortuary practices were initially bi-ritual, including both inhumation and cremation, with a bias toward the latter, but this shifted to exclusively cremation in formally organized cemeteries by ca. 1400 BC. Given the rarity of inhumations, we treated this area as a unit with individuals coming from multiple sites (Budžak Livade; Pecica site 14; Gakovo-Vasin Do, Rastina, and Mali Akač cemeteries; and the settlement at Turija) (East Pannonian group; see Fig. 1). There was a return to inhumation as a mortuary rite in various forms (articulated and disarticulated) after 1000 BC, including burials at Gomolava and Klisa considered herein.
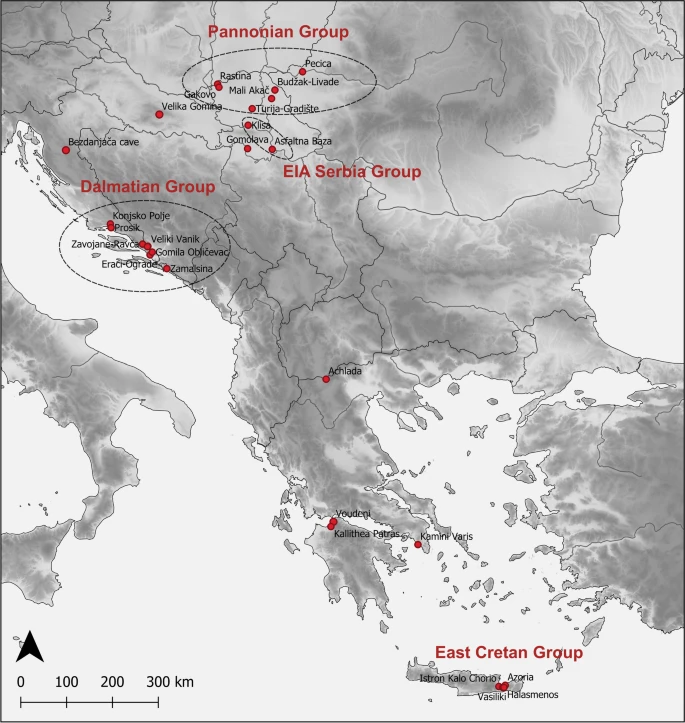
Sites of modern Greece and the Balkans that have been included in this study
Along the Adriatic coast of the Balkan region, enclosed forts built of stone are common. Burial in stone tumuli was typical, and remains from Eraci-Ograde, Matkovići, Veliki Vanik, Zavojane-Ravča, Konjsko Polje, Prosik, Zamaslina and Gomila Obličevac (Novak et al. 2011; Lightfoot et al. 2015) are included in this analysis (Dalmatian group, see Fig. 1). In the Balkan interior, tumuli were also the most common mode of burial, and these cover both inhumations and cremations (Dmitrović 2016). While tumuli dominate and cremation extends across the northern parts of this region from the fourteenth century BC, there are some exceptions; these include burials in caves, particularly along the Dalmatian coast and the Lika region, where the Bezdanjača Cave studied herein is located (Martinoia et al. 2021).
LBA/EIA connectivity between the Aegean and the Balkans
Overall, we have a regionally fragmented Bronze Age in Greece, with different communities sustaining connections of variable intensities with each other, parts of Italy, and/or the Balkans and Carpathian Basin for centuries alongside systematic links with communities of the East Mediterranean (Knodell 2021). Exercising choice at a local level was important and so variability in regional identities existed. It is plausible that different regions of Greece had relatively stable populations in which low-level inter-community mobility existed, but directional migration was not a defining element. Leppard et al.’s (2020) macro-scale study of published strontium isotope values for Greece and surrounding areas suggests that communities regularly experienced inward migration of as much as 5.84%. People who had spent parts of their childhood in locations beyond where they were interred would have been present in many nuclear families. Cemetery populations do not correspond in a straightforward manner to living communities in terms of their makeup, but the data suggest regular small-scale mobility covering long periods of residency. Unfortunately due to overlaps in strontium baseline data, it is not possible to say with certainty if this mobility took place within or between Greece, Italy, the Balkans, or the Carpathian Basin (Cavazzuti et al. 2019; Frank et al. 2021; Giblin 2020). An important new resource supporting mobility studies using strontium isotopes is the recently open-access and open-source strontium database SrIsoMed (Nikita et al. 2022), covering countries that have Mediterranean coastlines.
Long-recognized material culture patterns from Southeastern Europe indicate mobility across cultural boundaries, even if we lack precision on the distances, temporality, or scale of such movements (Leppard et al. 2020). Despite a pendulum swing in archaeology back to migration-led narratives, we would argue that this needs to be carefully balanced with a corresponding focus on stability and continuity within communities. Since we struggle to identify instances of rapid or wholesale change in the settlement, mortuary, and material culture evidence, we make use of the consistency of communities in medium-term trends to explore regional population dynamics.
Bioarchaeology to the rescue?
An ideal approach for identifying such medium-scale trends lies in the toolkit of bioarchaeological research, since human skeletal remains constitute the most direct source of information on past populations moving through space and time (Knapp 2021:46). In recent work, radiogenic isotope and ancient genome analyses have more commonly and extensively been used to explore mobility patterns (e.g., Leppard et al. 2020; Marcus et al. 2020; Mathieson et al. 2018; Nafplioti 2008, 2011; Panagiotopoulou et al. 2018). Even though both methods are powerful paleomobility tools, certain limitations can undermine the validity and representativity of aDNA and/or isotope results. Ethical approaches in the bioarchaeological and biomolecular analysis of human remains are of utmost importance, and destructive sampling in particular requires careful consideration as it is poor practice to sample extensively without preserving relevant remains for future work. This is especially true if we consider the methodological progress over the past 10 years alone, which shows that biomolecular methods are is evolving rapidly and improving to deal with the difficult preservation conditions usually characterizing the south-east Europe and Aegean skeletal assemblages. These conditions pose an additional limitation, namely, the fact that throughout the eastern Mediterranean Bronze Age, the preservation of human skeletal evidence can be uneven or occasionally very poor, and there are still too few palaeogenetic sample sets published to consider regional-scale dynamics. Furthermore, earlier studies on the Mediterranean used mitochondrial DNA (mtDNA) (e.g., Fernández et al. 2014; Hervella et al. 2015) which is neither as robust nor as informative as whole genome analysis, potentially creating sample bias in terms of representativeness (Knapp 2021:48). Nevertheless, aDNA techniques such as whole genome sequencing (Carpenter et al. 2013) and single strand capture (Kapp et al. 2021) have produced promising results. Another limitation of isotopic and aDNA analyses lies in budget capacity, which may result in small sample sizes and consequently in methodological shortcomings (Hakenbeck 2019: 522), such as compromised statistical validity and therefore less meaningful interpretations. A parallel problem is the large spatial scale of certain aDNA projects which may problematically articulate with local-scale studies (Gori and Abar 2023). In this context the analysis of over 30 individuals from Bezdanjača Cave using the capture technique and exhibiting very good DNA preservation is relevant (Lazaridis et al., 2022). The epistemological gap that often exists between archeology and archaeogenetics is also relevant, which is mostly the result of the lack of proper contextualization of genomic data (Ion 2019: 29–30). Finally, other issues that may arise include access to representative samples due to recovery and/or curation conditions.
Macroscopic biodistance analysis on the other hand (e.g., cranial and dental metric and non-metric traits) is less dependent on budgetary challenges as well as access to (and equal collaboration with) laboratory resources and is unaffected by content preservation (aDNA or/and collagen yield). It is also a fully non-destructive approach that returns immediate results. Non-metric traits represent variants of the normal skeletal anatomy that cannot be measured, they are not pathological, and their presence causes no symptoms (Tyrrell 2000). The occurrence of non-metric traits on the human skeleton is commonly documented in bioarchaeology, as over 400 such traits have been identified and they exhibit substantial heterogeneity (Mays 2010). Modeling of non-metric traits has the potential to offer important information on affinities and biological distances between past populations based on the assumption that phenotypic variability expresses phylogenetic variation (e.g., Relethford 2016; Scott 2008). Twin and family studies, as well as studies on laboratory animals, have demonstrated that the majority of these traits are under strong genetic control (Saunders and Popovich 1978; Cheverud and Buikstra 1981a, b, 1982; Carson 2006). Environmental factors also have some influence on their expression (e.g. Grüneberg 1952; Scott and Turner 1997), as supported by the model of quasi-continuous variation (Grüneberg 1952), which became the prevailing explanation for the nature and heritability of morphological traits (Scott 2008). According to this model, the expression of the underlying variation in trait occurrence (genetically and environmentally mediated) is controlled by a threshold; above this threshold, the trait is present and variable in expression, while below it, the character is absent. Under this model, the inheritance of non-metric traits is controlled by multiple genes that interact in order to produce the final phenotype (Nikita 2017, 182). According to Scott and Turner (1997) though, while environmental factors affect non-metric expression, they do not seem to significantly influence the frequency in which the traits occur in a population. What is of interest to our study is that non-metric traits are therefore a combination of inherited and developed features, meaning that they are both genetic and social in their origin. Recent research has demonstrated a correspondence between biodistance results derived from both morphological and genetic data (e.g., Evteen and Movsesian 2016; Irish et al. 2020; Hubbard et al. 2015; Ricaut et al. 2010). Biodistance studies have long been used effectively to differentiate among populations on a global scale (e.g., Hanihara 2013; Hawkey 2004; Irish 1993, 2013; Turner 1986, 1990; Scott et al. 2013), as well as on a regional one to address issues such as human mobility and trading networks (e.g., Hubbard 2012; Guatelli-Steinberg et al. 2001; Nikita et al. 2018; Ullinger et al. 2005).
Nevertheless, the aforementioned methodology has limitations. Researchers might face significant difficulties in collecting such traits in a consistent manner, due to preservation issues mentioned above, as well as the funerary practices of the period. Simply put, fragmented remains and incomplete preservation/collection of elements all impact on which traits can be documented. To date, no large-scale non-metric investigation has been conducted in LBA Greece and the Balkans, and a key reason may be due to poor preservation in many assemblages. Mortuary practices are also relevant because the commingling of burials occurred frequently in the LBA Aegean, whereas cremation was the dominant practice in the LBA Balkan-Carpathian area. The comparatively small size of prehistoric cemeteries, the limited number of individuals (minimum number of individuals (MNI)) preserved, and the very large number of missing values in our study area (due to the commonly occurring incompleteness of the skeletal elements) limit the potential of this approach. These traits are also not documented routinely, and even when they are, there is the possibility that different researchers identify or record features in a slightly different manner (inter-observer error). Furthermore, even though the list of cranial non-metric traits proposed by Berry and Berry (1967) is commonly used, it is not as consistently followed as the ASUDAS list of the 21 dental traits proposed by Irish and Guatelli‐Steinberg (2003). Therefore, this lack of consistency in terms of cranial traits results in different researchers looking at different traits. We therefore propose the currently used cranial trait selection (see the “Materials and methods” section) as the one that could be more routinely implemented in the specific wider context as a core dataset to build up a larger comparative regional approach. The specific cranial selection offers a large spectrum of alternative possibilities for recording as it includes traits observed on the entire surface of the human skull (e.g., vault, base, maxilla-mandible). This can be most beneficial in cases of assemblages being partially or poorly reserved. It should also be noted that post-cranial non-metric traits were excluded from the current analysis due to the limitations posed by commingling, which very often render the attribution of post-cranial elements to specific individuals impossible. In addition, even though dental traits were recorded, their statistical processing resulted in significant interpretive issues, most likely due to serious limitations (e.g., very small number of dental observations per assemblage; also see the “Discussion” section). Therefore, dental non-metric results will not be presented in the current research paper.
Due to the partial and fragmented nature of most of the skeletons of this context, a large number of cranial non-metric traits could not be consistently recorded. The main objective of the present study is to explore connectivity and networking in LBA/EIA Greece and the Balkans using cranial non-metric analysis and test the potentiality of newly introduced statistical tests, which were designed for challenging datasets, in this particular cultural area. While the dataset is smaller than desirable, the cranial non-metric traits included were documented in a macro-regional study, and therefore, we present analyses of collections sampled across a geographic scale not commonly applied within bioarchaeological research in this region. We acknowledge that aDNA may reveal exceptional cases, such as migrants from unrelated communities which we can predict were present, and genetic research will provide higher resolution on intra-community relations, but we are concerned here with the broader background of communities at a more general level.
Taking the state of the art in material culture research as our starting point along with the concept of phenetic distances mainly following the isolation by distance model (Slatkin 1993), two research hypotheses emerge: (1) If immigration into a given community was a gradual process, not fundamentally transformative in the LBA/EIA Greece and the Balkans, the pace of population change would mirror the rate of cultural change, as processes such as integration, accommodation, and adoption—rather than displacement—would characterize human communities. This in turn would allow us to identify distinctive differences between groups of people from the wider region, following the model of low population turnover through inward migration in our period of interest 1400–1100 BC. It would result in biodistances following the isolation by distance model, according to which genetic, and by extension phenetic, distances increase exponentially as geographical distances increase (i.e., positive correlation); (2) in addition, we hypothesize that aside from geographical affinities, communities participating in common cultural routes, based on material culture evidence, would most likely present smaller phenetic distances between them in comparison to culturally more distant or distinct groups.
Materials and methods
This research is part of the European Research Council funded project “The Fall of 1200 B.C.,” which investigates migration and conflict at the end of the Bronze Age (ca. 1300–1000 BC) and their relevance for understanding collapse in distinct Bronze Age societies of southeast Europe (http://www.thefall1200.eu/index.html). For the purpose of this particular study, ten (10) assemblages were selected, mostly based on preservation criteria. Cranial non-metric traits were recorded by the first two authors (D.E.M. and L.F.). An inter-observer error investigation would be useful; however, due to COVID-19 restrictions and accompanying very strict regulations in associated museums, this was not possible in this study. Nevertheless, D.E.M and L.F. practiced together on this task (i.e., the recording of non-metric traits) at the University of Edinburgh at the beginning of 2019. Human skulls from the university’s reference collection were used to perform this joint training activity, to ensure consistency in practice. Therefore, we believe that possible inter-observer errors are not significantly affecting the results of this study.
The sites that have been included in the current analysis are presented in Table 1 and Fig. 1. Contextual data along with predicted affinities for the ten populations under study are presented in Table 2. Overall, cranial non-metric traits were recorded in 378 individuals from inhumation burials, from 26 sites/assemblages which form ten population groups. Groups were formed under the concept that assemblages that are in very close proximity to each other, contemporaneous in use, and characterized by very similar material culture can be treated as one sample population (e.g., Dalmatian group, East Pannonian group, EIA Serbia group, and East LMIIIC-PG group). A maximum of thirty cranial non-metric traits were recorded for each individual, though in reality, fewer traits were preserved and/or observable in order to be recorded in most cases. The cranial traits were selected on the basis of their successful use by other researchers performing biodistance analyses (e.g., Prowse and Lovell 1996; Hanihara et al. 2003; Sutter and Mertz 2004; Velasco 2018), and the complete criteria for their scoring and dichotomization are summarized in Table 3. Each trait was scored as present/absent, and its frequency was calculated based on the "individual count" method, that is, ignoring potential bilateral presence and only indicating whether the individual presents the trait (Sutter and Mertz 2004). The side with the highest degree of expression was used (Hauser and De Stefano 1989; Scott and Turner 1997). Biological sex was not included in the current analysis, as it would only lead to an additional “fragmentation” of our dataset; therefore, males and females were pooled in the biodistance analysis. Nevertheless, sexual dimorphism was tested as some non-metric traits exhibit different frequencies in each sex (Nikita 2017, 188). All age categories (from juveniles to mature adults) were also pooled together, and age dimorphism was explored, as several traits’ frequency and degree of expression, such as hyperostotic ones, may increase with age because they involve progressive ossification (Buikstra 1972). Hyperostotic traits are those that are marked by excess bone growth (e.g., tori and bridges) (Saunders and Rainey 2008). Sex and age dimorphisms in trait expression were explored with chi-square analysis (SPSS, version 21).
In order to assess inter-population distances, the mean measure of divergence (MMD) was calculated using the AnthropMMD R package (Santos 2017). Given the fact that in the current analysis, the untransformed measure of divergence (UMD) managed to produce more meaningful results compared to the MMD (see below), all associated information and results on the MMD will be presented in the Supplementary Information. The main difference between the MMD and the UMD lies in the fact that the former is based on a variance-stabilizing transformation formula, contrary to the latter (see Nikita and Nikitas 2021, 39). Due to the mathematical principles underlying its definition (Sjøvold 1977), the UMD measure is an unbiased estimator of population divergence and does not exhibit application problems at very low or very high frequencies (e.g., frequencies less than 0.1 or greater than 0.9), contrary to the MMD (Nikita and Nikitas 2021). Therefore, the standard editing procedure, usually followed in biodistance studies (briefly described in the Supplementary Information), is not necessary when implementing the UMD. The only trait editing strategy consisted of the exclusion of those variables that exhibited only missing values in one or more groups under study. This procedure can be particularly beneficial in challenging datasets, i.e., those with a large number of missing values and a limited number of observations, where most traits would have to be excluded in order to produce an unbiased MMD.
A recent study by Nikita and Nikitas (2021) also showed that the UMD and MMD provided largely the same outcomes and that the UMD generated archeologically meaningful biodistances, in a specific dataset. Nonetheless, this untransformed measure has not been widely tested on large and diverse archeological assemblages and should be treated with caution. In the current study, both measures, i.e., the MMD and the UMD, are used as means of estimating distances and significance, via an experimental step-by-step statistical approach.
Primarily, the biasbinMDs function was used to examine the bias of the calculated UMD measure (for scripts see Nikita and Nikitas 2021). For the stated commands, the MultiOrd, PoisBinNonNor, popbio, and Matrix packages were primarily installed in R. For the estimation of the UMD and its significance the perbinMDs function in R was applied. Through this method, the accuracy of the p values was estimated. Two statistical tests were used: the S statistic that follows the chi-squared distribution and the T statistic that follows the standard normal distribution (Nikita and Nikitas 2021; Sjøvold 1977; Souza and Houghton 1977). The p values obtained from the stated two statistics were compared to the p values estimated from the permutation method. The permutation method involves the following steps: (1) calculation of the UMD value and the values S and T of the test statistics using the original dataset, (2) random redistribution of all cases into new groups with sizes equal to the original ones, (3) calculation of UMDi and the values Si and Ti of the test statistics based on the new groups, (4) repetition of steps 2 and 3 at least M = 1000 times, and (5) estimation of the p values for the S and T statistics with and without permutations (see Nikita and Nikitas 2021 for more details).
The correlations between the MMD and UMD distance matrices were calculated using the Mantel test (Mantel 1967). Mantel tests have been demonstrated to be robust (Séré et al. 2017), are easy to interpret, and remain widely used to facilitate between-study comparisons (Irish et al. 2020). The same test was used to examine correlations between biodistance and spatial matrices. The latter were based on linear distances. For this measurement, the Mantel function in the Vegan R package was followed, following the script by Nikita (2020, 148).
Phenetic affinities were graphically represented via hierarchical cluster analysis (HCA) and multidimensional scaling (MDS). Regarding the former, dendrograms were used to visualize the relationship between groups and the presence of clusters in the dataset. We also measured the uncertainty in the clustering process, which enables the estimation of the probability of formation of the various clusters and, therefore, their stability (Nikita and Nikitas 2022, 2). The assessment of uncertainty in HCA requires the creation of simulated distances. In order to estimate uncertainty in the dendrograms of HCA, the following steps are followed: first, all pairwise distances among the original samples are estimated, and then, a large dataset of simulated distances is generated; subsequently, the dendrograms of both the original and simulated distances are measured, and the number that each pattern in the original dendrogram appears in the simulated distances is counted. The uncertainty in a pattern is estimated from the percentage of the appearance of this pattern in the simulated dataset, which in turn gives the simulated probability of the formation of this pattern (Nikita and Nikitas 2022, 2). To generate simulated distances, the distance distribution method (DD) was followed as described by Nikita and Nikitas 2021. The Monte Carlo (MC) and bootstrap (B) simulation methods were also implemented to compare with the DD results. All R-scripts and functions are provided in Nikita and Nikitas 2021, while the PearsonDS, mvtnorm, Matrix, and e1071 packages were primarily installed.
Results
Dimorphisms and trait editing
Significant differences were found, for certain variables, between the sexes and between the age categories in trait frequency (Tables 4 and 5). Nonetheless, none of the traits differed consistently in frequency between males and females and between the different age categories in all groups. On the contrary, most of them exhibit significant differences only in one or two out of the ten samples under examination (with the exception of asterionic bone which exhibits significant age differences in three groups). As our dataset already presents certain challenges (limited number of individuals along with a high number of missing values), we decided to primarily conduct the statistical analysis without excluding those traits which show statistically significant sex and age differences, to prevent inflicting further limitations on the biodistance investigation. Nonetheless, MMD analyses were also performed with the exclusion of those traits for comparative reasons. Associated results will be presented in the Supplementary Information.
Regarding pairwise comparison between traits, the statistical analysis showed that only coronal ossicles exhibited a statistically significant inter-correlation. MMD analyses were performed with and without the inclusion of the specific trait, and no differences were observed (MMD values and dendrograms remained the same).
Exploring distances between better-preserved assemblages
As it is obvious from Table 1, most collections of the current study consist of a limited number of individuals, while at the same time, a significant number of missing values are observed in most groups. It should be clarified that the number of individuals stated in Table 1 is the number of individuals where cranial non-metric traits could be recorded based on preservation state and not the overall number of individuals of each site. Bezdanjača Cave, Gomolava, Achlada, Kallithea, Voudeni, and Kamini are the six groups with the highest number of observations (Table 1).
UMD values
When implementing the alternative approach for the estimation of the UMD, which does not require an extensive editing process, 29 traits were selected, with the exclusion of the condylar canal, as it was the only variable that exhibited only missing values in one or more groups under study. The UMD values and significant distances are presented in Table 6. Plots depicting the UMD values are presented in Figs. 2 and 3. As already mentioned, the biasbinMDs function in R was used to assess biases in the estimation of UMD divergence. To test whether a given measure of divergence acts as an unbiased population estimator, the populations from which the dataset originates are simulated. Therefore, the original dataset is used to simulate the respective populations and calculate all pairwise population distances using the UMD (Nikita and Nikitas 2021). Populations of 50,000 individuals in size were created using the φ values, i.e., proportions of the individuals in the samples possessing the trait under examination, as marginal probabilities of the original samples. Then, 1000 samples were randomly drawn from the populations, and their distances were calculated and averaged. The hypothesis was that if a measure of divergence is an unbiased estimator, the averaged sample distances would coincide with the distances between the original samples and between the simulated populations; otherwise, the averaged sample distances would deviate from the corresponding original and population distances (Nikita and Nikitas 2021). For this specific case, the measured UMD is a rather unbiased measure of divergence as observed in Fig. 4.

Ward’s dendrogram depicting the UMD values also including the uncertainty probabilities (in blue font); (the same dendrogram was produced following the perbinMDs function as described in Nikita and Nikitas 2021)

MDS graph based on UMD values for the six better-preserved groups (produced with SPSS, version 21)

UMD values (following Nikita and Nikitas 2021) between the averaged sample distances (mean), the distances between the original samples (sample), and those between the simulated populations (pop), for the six better-preserved groups. The averaged sample distances coincide with the distances between the original samples and between the simulated populations
Both MMD matrices (Tables S2 and S3) (with minimum 10 and 22 observations respectively) present positive and significant relations with the UMD matrix (Table 6) (1st case of MMD with UMD: Pearson’s correlation = 0.8319, pvalue = 0.0013, permutations = 9999; 2nd case of MMD with UMD: Pearson’s correlation = 0.7544, pvalue = 0.0013, permutations = 9999). Regarding the correlations between the biodistance matrices and the spatial one, positive correlations were found in all three cases (two MMD matrices and one UMD matrix). However, only the UMD presents a statistically significant correlation with the spatial matrix (Pearson’s correlation = 0.4812, pvalue = 0.044, permutations = 9999). Between the two MMD matrices, the one that was calculated based on more traits and less observations per group (case 1—Table S2) has a higher correlation coefficient with the spatial matrix compared to the MMD of the 2nd case—Table S3 (Pearson’s correlation = 0.447, pvalue = 0.062, permutations = 9999 vs. Pearson’s correlation = 0.264, pvalue = 0.186, permutations = 9999). In terms of networking, both the MMD and the UMD values produced “meaningful” results. In all cases, Kallithea and Voudeni were grouped together, which was expected, based on their proximity in Achaea, Peloponnese. At the same time, the two Achaean groups, which face the Ionian Sea (western axis), present a clear distance and relation with the Kamini group (eastern axis—faces into the Aegean Sea). Gomolava and the Bezdanjača Cave are grouped together in all cases, which again were expected. Achlada in Northern Greece seems to be the “non-stable” element of these comparisons, as it is grouped both with the “Balkan” and Southern “Greek” collections, based on the MMD and UMD values respectively. Interestingly, based on the UMD distances Achlada seems to be “closer” to the Western Achaean sites, compared to the Kamini Aegean site, pointing cautiously to a western axis networking.
Exploring distances between all ten populations
UMD values
UMD values were based on 12 traits (metopic suture, supraorbital foramen, supraorbital notch, auditory torus, marginal tubercle, parietal foramina, Inca bone, coronal ossicles, sagittal ossicles, lambdoid ossicles, apical bone, and tympanic dehiscence), as variables that exhibited only missing values in one or more groups under study were excluded. Additional traits with extremely low frequencies were also excluded to produce an unbiased UMD estimator. The UMD values and their significance are presented in Table 7. The graphical representations of the UMD values are depicted in Figs. 5, 6, and 7. Again, it is obvious that the UMD is an unbiased estimator, as depicted in Fig. 8.

Ward’s dendrogram of the UMD values for the 10 groups under study (following Nikita and Nikitas 2021). Key: (1) Kallithea, (2) Voudeni, (3) East Crete, (4) Achlada, (5) Gomolava, (6) Kamini, (7) Bezdanjača Cave, (8) EIA Serbia, (9) Dalmatian, and (10) East Pannonian

MDS graph of the UMD values for the ten groups under study (produced with SPSS, version 21)

Ward’s dendrogram for 10 groups based on the distance distribution method following Nikita and Nikitas 2022 and including the uncertainty probabilities (in blue font)

UMD values between the averaged sample distances (mean), the distances between the original samples (sample), and those between the simulated populations (pop) for the 10 groups. The averaged sample distances coincide with the distances between the original samples and between the simulated populations
The MMD and UMD matrices were positively correlated and statistically significant both when using the Spearman rank coefficient and the Pearson test (Pearson’s correlation: 0.7365, pvalue: 3e − 0.4, permutations = 9999; Spearman’s correlation: 0.6102, pvalue: 0.001, permutations = 9999). Each of the two biodistance matrices presents positive correlations with the spatial matrix, and the results were statistically significant in both cases (MMD and spatial: Pearson’s correlation: 0.4474, pvalue: 0.0087, permutations = 9999; UMD and spatial: Pearson’s correlation: 0. 6768, pvalue = 3e − 0.4, permutations = 9999). In terms of meaningful results, the UMD dendrogram as depicted in Fig. 5 better fits the expected geographical and archeological pattern, compared to the one presented with the uncertainty probabilities (Fig. 7). Both dendrograms employ the same assemblages and depict UMD values; therefore, theoretically, they should have been identical. Nevertheless, they are produced by different R commands and scripts, leading to different clustering. This could be considered a sign of “unstable” groupings.
The four Southern Greek collections were grouped separately from the Northern Greek collections, with Kallithea and Voudeni being grouped together and Kamini being broadly clustered with East Crete (Fig. 5). The latter grouping is quite interesting as both those sites face the Aegean Sea. Furthermore, EIA Serbia is logically grouped with the EIA collection of Gomolava. The two latter collections are broadly clustered with LBA Achlada and the MBA Dalmatian group (Fig. 6) (see Fig. 1). LBA East Pannonian and Bezdanjača Cave groups were broadly grouped with the remaining northern sites (Fig. 5), even though they seem to form distinct groups (Fig. 6). Compared to the MMD groupings, there are some broad and even more specific similarities (e.g., the grouping of Kamini with East Crete); however, it is clear that the extensive although necessary elimination of traits has resulted in the significant loss of clusters and thus information (Fig. S6).
In conclusion, choosing to experiment with the alternative UMD method which does not require an extensive editing process produces more meaningful results compared to the classical MMD approach, especially when including the more challenging collections. It should be noted that the alternative non-editing strategy was also attempted for the MMD; however, the presentation of the relevant results is excluded from this paper since a very large number of traits had to be eliminated to produce an unbiased MMD estimator, as was the case with the AnthropMMD package.
Discussion
According to our original hypotheses, we would expect communities presenting closer geographical proximities and/or participating in common cultural practices to demonstrate smaller phenetic distances between them in comparison to geographically or/and culturally more distant or distinct groups. The isolation by distance model (Slatkin 1993) was tested through the Mantel test (Mantel 1967). According to Konigsberg (1990), if there is isolation by geographic distance, the correlation between genetic and spatial distances should be positive. In all cases (see the “Results” section), the abovementioned correlations between the MMD/UMD and spatial matrices were positive. Moreover, in most cases, results were also statistically significant. Our results overall do confirm an isolation by distance model, confirming our main argument—i.e., that processes such as integration, accommodation, and adoption—rather than displacement—would characterize community interaction during the LBA/EIA transition in the Aegean and Balkan areas. This allows us to identify distinctive differences between groups of people from the wider region, under the concept of low population turnover in relation to migration. It also shows that blanket terms—such as Mycenaean—used in some genetic studies are problematic, as people using similar material culture were differentiated not only by a number of inherited traits, but by a combination of those traits with a set of specific local cultural routines. For example, Kamini Varis and Achaea, which would both be characterized as Mycenaean, displayed differences in our dataset, reflecting subtle differentiations in their phenotypic variation, also corresponding to variation in their funerary practices (e.g., larger collective burials in Achaea vs. smaller ones in Kamini). This impacts on how we effectively use terminology in an unbiased manner (Eisenmann et al. 2018). Simply put, if our original hypotheses were wrong, the model itself would not work. If there had been high population turnover—for example, even exchanges between those Mycenaean groups in Achaea and Attika—then patterns of biodistance would not correlate with social and/or Euclidian distance. The fact that in few instances, biodistance-spatial correlations were positive but not statistically significant could be interpreted in multiple ways; spatial distances between groups may not be equivalent, with regard to natural barriers (e.g., mountainous areas versus plains); furthermore, gene flow occurred between the communities under study and other populations that were not included in the current analysis. Moreover, the fact that not all populations studied are precisely contemporary could also affect the biodistance-spatial results, although exploring connectivity and networking during the LBA/EIA transition lies at the core of our research, and we have been cognisant of material markers for culture change in defining our datasets. Ultimately, this exploratory dataset demonstrates meaningful patterns, but a larger dataset in future non-metric analyses, building on or independent of this one, will better enable the analyses of networking and mobility to complement ongoing genetic, bioarchaeological, and material culture studies.
Focusing on our methodology, following a step-by-step “experimental” statistical approach in order to estimate the biodistance measures of divergence (MMD and UMD), MDS and cluster diagrams were produced to visualize phenetic affinities and distances. The potential problem with the latter kind of analysis is that it “forces” samples into clusters; therefore, looking at the MDS “neighborhood” approach might seem more informative. This becomes even more obvious if we consider the quite low simulated probabilities depicted on some of the dendrograms. Nevertheless, we took all information into account when discussing biodistance results. When only the better-preserved six populations are included, the MMD results, in both the examined cases (varying number of traits and observations), agree with the predicted affinities, which are based on geographical location and cultural factors (Table 2). Combining information from both kinds of diagrams, our data modeling suggests that LBA Kamini (Attika) forms a separate group on its own; EIA Gomolava (Serbia) and LBA Bezdanjača Cave (Croatia) form another distinct group or cluster; at the same time, Achlada in Northern Greece lies between the sites of Voudeni and Kallithea in Achaea and between Gomolava and Bezdanjača Cave. When looking at the UMD results, the picture is rather similar with the exception of Achlada that seems to be more clearly grouped with Voudeni and Kallithea. Therefore, it seems that Achlada is the most “fluid” group in terms of biodistances, compared with the other five. Moreover, the UMD uncertainty probabilities for the six better-preserved populations (Fig. 6) are higher compared to those produced for the MMD affinities, possibly suggesting that the UMD is able to produce more stable and potentially more reliable clusters for this specific dataset. Overall, the models are consistent with both cultural contexts and geographic proximity (Table 2).
When including all ten studied collections, the MMD results (when based on only two traits) tenuously produce one broad group including Kamini and the LMIIIC-PG group (East Crete), a broader cluster comprised by the Bezdanjača Cave group (Croatia) and the East Pannonian one (Romanian and Serbian sites) and one tight group with the six remaining assemblages. Therefore, it seems that when datasets are quite challenging, the MMD produces results that are much less informative and reliable. Nonetheless, even in this case, results seem to agree with our predictions (Table 2). In this particular case (ten studied collections), the UMD provided more detailed relationships (Figs. 5 and 6), which are in total agreement with affinities predicted on the basis of material culture analysis. Kamini is grouped with the East Cretan cemeteries, Kallithea is grouped with Voudeni (both sites being in Achaea), and the Bezdanjača Cave site and the East Pannonian group seem to form two separate clusters on their own (however broadly grouped with the other Balkan sites), while four sites, namely, Achlada, EIA Serbia, Gomolava, and the Dalmatian group, form one bigger cluster. The latter is the most interesting and important finding as it could potentially suggest a rather significant phenetic and by extension genetic continuity of communities inhabiting those mountainous Northern Greek/Balkan sites from the MBA to the EIA periods. Nonetheless, bold assumptions should be avoided, and this result—which will be further tested by our team through genetic analyses in the future—should be treated as merely indicative at this stage. When looking at the UMD and MMD dendrograms with the uncertainty probabilities (Fig. 7 and Fig. S8 respectively), it is obvious that the former seems to be much more consistent with the archeological and geographical context. Nonetheless, its inability to closely cluster EIA Serbia with Gomolava (predicted affinities; Table 2) makes it less meaningful in terms of archeological context compared to the UMD dendrogram presented in Fig. 5. Overall, based on the simulated probabilities depicted in the UMD dendrogram (Fig. 7), it seems that the model is more suitable to distinguish, with much higher stability and reliability, between the locally distanced assemblages, rather than between the more distant ones.
A case that stands out is that of the Achlada cemetery in Northern Greece. As already mentioned, based on different statistical approaches, Achlada lies between the Balkan collections, such as the Dalmatian one, and the two Achaean assemblages in Southern Western Greece. It is tempting to link Achlada’s biodistance placement with its geographical location and cultural background. The cemetery of Achlada (near the modern town of Florina) lies south of the historic region of the Pelagonia Valley—an opportune location to trade both north and south, and its location close to the Morava-Vardar-Axios valley is surely relevant (Michael et al. 2021: 22, 26). Combining different kinds of data from its mortuary environment (e.g., artifacts, types of tombs, placement of the dead, adult: non-adult ratio), it can be concluded that features from different traditions were combined in the cemetery (see Michael et al. 2021 for more details). The material culture shares elements with finds from cemeteries in Ulanci, Central Macedonia, and Albania as well as objects reflecting local traditions (Michael et al. 2021; Ziota 2019). Molloy (2016, 369) argues that the material evidence for land-based interactions in the LBA Southern Balkans points to combinations of regular and sustained links with neighboring groups and eclectic or irregular encounters with more distant groups. The former may have included marriage exchanges, for example, whereas the latter may have included both circular (return-to-home) and chain migration, to use Anthony’s (1997) terminology.
A potentially east–west axis of influence may be evident between the Aegean-Ionian Seas, as suggested by the current analyses. Kamini in Attika is clustered (in a broad sense) with East Crete, and this pairing seems consistent in most dendrograms. The Attika assemblage is located on the Aegean coast, linking this community with the islands, including Crete. Kallithea is placed closer to some assemblages to the north and northwest (such as Achlada or the Dalmatian group) than to Kamini Varis in Attika (e.g., Fig. 6; Tables 6 and 7). A similar pattern to that seen for Kallithea is observed for Voudeni, also in Achaea, but only in the UMD values (see Table 7). Achaea was connected with Italy and non-Mycenaean areas of Greece to the north (e.g., Iacono 2020). Therefore, it seems archeologically reasonable that when compared with the specific groups of our research, the Achaean sites cluster closer to western than eastern datasets. Nonetheless, larger and broader assemblages should be included in future non-metric analyses to form a clearer picture regarding interactions between LBA Greece, the Balkans, and potentially Italy.
Recent genetic work on LBA individuals from Southern Greece and Crete has identified spatially relevant internal variation, and work in Crete has defined temporally relevant changes in population genetics (Clemente et al. 2021; Lazaridis et al. 2017, 2022; Skourtanioti et al. 2023). Furthermore, Lazaridis et al. (2022) argue that several individuals from Bulgaria had “the Mycenaean genetic profile, which suggests that Mycenaeans were genetically similar to” some contemporary people there. Though Lazaridis et al. unhelpfully speak of “Mycenaean Greeks” as a meaningful entity without defining spatial boundaries, it is clear that variation must increase as one moves north since LBA Carpathian populations are shown to have a defined genetic distance. However, there is a bias in sampling creating a dislocation between groups studied in the south and the north. LBA samples come from the far south of Greece and from the central to north Carpathian Basin, with virtually no samples included from parts of the Balkans lying in between. Despite this bias, Lazaridis et al. (2017, 2022) emphasize genetic difference by capitalizing on this knowledge gap to support a narrative that takes insufficient account of archeological literature and has been robustly critiqued (Frieman and Hofmann 2019; Gori and Abar 2023; Hakenbeck 2019; Hamilakis 2017). Given the predictable diversity of groups across this tract of Southeastern Europe, this ill-defined disjuncture limits our view of long-distance interactions, mobility, and relationships. More specifically, it restricts analysis of the relative role of these two centers of cultural significance—the Aegean and the Carpathian Basin—on each other and on the lands in between. The current study is a step toward exploring the breaks in this chain and will be followed up by further genetic analyses in preparation by the authors and collaborators at the Globe Institute, Copenhagen.
Our results support a model of integration of migrants rather than rapid transformation or displacement, which aligns well with recent discussions on mobility and migration in archeological studies (Heyd 2017; Iacono 2019; Knappett and Kiriatzi 2017). This picture also fits well with Leppard et al.’s (2020) isotope analysis paper, estimating 5.84% of non-local presence in the ancient Mediterranean between the MBA and EIA (2000–800 BC). Leppard and colleagues, reflecting on the arguments of Iacono (2019) and Legarra Herrero (2016), concluded that if the whole idea of a connected Mediterranean was indeed a reality, it was limited to those of the higher social strata, whereas for the average person, long-distance or frequent mobility, and certainly migration, was exceptional (Leppard et al. 2020, 231). Looking at our contextual data (Table 2), of our individuals stand out as striking, which may suggest that we are looking at typical rather than exceptional members of a community. On the other hand, certain limitations in the strontium analysis methodology should not be overlooked (e.g., overlapping strontium values between regional zones; the possibility that the founding generation of migrants is not being well represented; underrepresentation of datasets in specific areas; see Leppard et al. 2020, 227–230). Should we accept the 5.84% mean non-local persons model that Leppard et al. (2020) propose, this translates roughly to one out of every 20 individuals in each community being a migrant. Even if we assume that these communities were primarily composed of small family units of four people (two adults and two children), one individual in every five families may be a migrant, allowing for larger family units, that are more likely to be one in every two or three families, which could support the concept of small-scale mobility on a regular basis.
In sum, cranial non-metric analysis was able to provide insights on networking and mobility in this cultural area. The current study has limitations, including a restricted number of observations and a large number of missing values, mostly due to preservation conditions. Such limitations are particularly evident in specific dendrograms, which present very low simulated probabilities (e.g., Fig. S8). Nonetheless, even in such cases, the model is able to produce archeological meaningful pairs (e.g., Kallithea and Voudeni). Dataset limitations also led to the inability of incorporating the factor of biological sex or even age into the research design. Statistically significant sex and age differences in trait frequency were found; however, none of the traits differed consistently in frequency between males and females and between the different age categories in all groups. Even though excluding such traits from the analysis led to further challenges (see the “Results” section) in certain cases, results were identical to the ones produced without eliminating those traits, possibly demonstrating a certain level of stability. It is evident, however, that apart from securing a minimum of 10 observations per group (Irish 2016), incorporating as many traits as possible into the non-metric analysis produces more trustworthy and archeologically meaningful results.
The current research used both the well-tested MMD as well as the newly introduced UMD to infer biological affinities and distances. Both approaches managed to produce archeologically meaningful results; however, the UMD approach led to more detailed evidence of relationships between the ten groups under study as well as higher simulated probabilities, possibly suggesting more stable clusters. Even though the UMD succeeded in producing meaningful results in both our study and the one of Nikita and Nikitas (2021), it has not been tested independently by other researchers with expertise in statistics, and more importantly, it has not been employed in larger and more diverse assemblages which form known biodistance clusters (Nikita and Nikitas 2021, 40). It should also be noted that when we tried to explore biodistance through dental non-metric traits, it was not possible to produce archeologically meaningful results with either of the two employed strategies (MMD and UMD). This was possibly due to the inclusion of even more problematic datasets (for example limitations of associating mandibles with maxillae in commingled deposits) and the recording of fewer traits compared to the number of cranial ones recorded for this research (21 dental traits vs. 30 cranial). Therefore, even though the current study primarily supports the alternative strategy as outlined in Nikita and Nikitas (2021), it also stresses the importance of investigating each dataset carefully and recognizing its unique characteristics. Our future goals include integrating non-metric biodistance data into isotope (both stable and radiogenic) and paleogenomic analyses, to form a holistic picture of connectivity in LBA/EIA Greece and the Balkans. Regarding the latter type of analyses, current conclusions will be tested through genetic investigation of the same cemetery collections undertaken by Hannes Schroeder and Miren Iraeta at the Globe Institute in Copenhagen.
Conclusions
Biomolecular research will continue to become more affordable and grow as a powerful field for exploring biodistance. Yet its destructive nature has much potential to pit it against ethical and sustainable research values and codes developed over decades of bioarchaeological research. Taking a different but complementary approach to biodistance, this study is the first to infer biological affinities using cranial non-metric analysis, combined and compared against studies of artifactual evidence, in LBA/EIA Greece and the Balkans. Using 10 skeletal assemblages, spanning from East Crete to Romania, this study provides provisional insights on networking and mobility on a local and regional scale while properly acknowledging inherent limitations. We followed an experimental statistical approach encompassing two different measures of divergence, the conventional and well-tested MMD and the newly introduced UMD. Uncertainty probabilities in HCA dendrograms were also estimated. This study supports the UMD approach in biodistance studies and stresses the importance of further exploring this alternative measure of divergence in larger datasets with known affinity clusters. Though different, results based on these two measures of divergence are mutually supporting in the manner argued above. These show that biodistances in our regional case study mainly follow the isolation by distance model, which in turn cautiously confirms our initial hypothesis that during the LBA and EIA periods in Greece and the Balkans, the contribution of mobility to changes within a community was a gradual process characterized by integration, than displacement or transformation. This is in alignment with archeological evidence but also with insights into mobility patterns revealed by strontium isotope studies in the wider area as well as recent genetic work. Building a larger dataset through future non-metric analyses will better enable the exploration of networking and mobility to further complement ongoing bioarchaeological, genetic, and material culture studies.
Notes
Kallithea is represented here primarily by samples from the site of Kallithea-Rampantania but also from the site of Kallithea-Laganidia. The two neighboring cemeteries are treated here as one assemblage as they are in very close proximity to each other, contemporaneous in use, and very similar in terms of their material culture.
References
Anđjelić D (2017) Artefacts from the Early Iron Age in the vicinity of Novi Sad. ГPAЂAƋ XXX, 32–47
Andreica L (2014) Musculoskeletal markers as evidence of physical activity and social differentiation in the Lower Mureş Valley during the Late Bronze Age. ZIRIDAVA STUDIA ARCHAEOLOGICA 28:77–86
Andreou S, Fotiadis M, Kotsakis K (1996) Review of Aegean Prehistory V: the Neolithic and Bronze Age of Northern Greece. Am J Archaeol 100:537. https://doi.org/10.2307/507028
Anthony D (1997) Prehistoric migration as social process. In: Chapman J, Hamerow H (eds) Migrations and Invasions in Archaeological Explanation. British Archaeological Reports, Oxford, pp 21–32
Arena E (2015) Mycenaean peripheries during the Palatial Age: the case of Achaia. Hesperia 84:1–46. https://doi.org/10.2972/hesperia.84.1.0001
Barrett JC, Boyd MJ (2019) From Stonehenge to Mycenae: the challenges of archaeological interpretation. Bloomsbury Publishing, London
Berry AC, Berry RJ (1967) Epigenetic variation in the human cranium. J Anat 101:361–379
Bertsatos A, Chovalopoulou ME (2016) Technical note: a GNU Octave function for Smith’s mean measure of divergence. Bioarchaeol Near East 10:69–73
Borgna E (2009) Patterns of bronze circulation and deposition in the northern Adriatic at the close of the Late Bronze Age. In: Borgna E, Cassola Guida P (eds) From the Aegean to the Adriatic: social organisations, modes of exchange and interaction in Postpalatial times (12th - 11th BC). Quasar, Roma, pp 289–310
Borgna E, Càssola Guida P (eds) (2009) Dall’Egeo all’Adriatico organizzazioni sociali, modi di scambio e interazione in età postpalaziale (XII-XI sec. a.C.) = From the Aegean to the Adriatic: social organizations, modes of exchange and interaction in Postpalatial times (12th-11th B.C.) : atti del seminario internazionale, Udine, 1–2 dicembre 2006. Quasar, Rome
Boyd M (2016a) Distributed practice and cultural identities in the ‘Mycenaean’ period. In: Molloy BPC (ed) Of Odysseys and oddities: scales and modes of interaction in the prehistoric Aegean, Sheffield studies in Aegean archaeology. Oxbow Books, Oxford, pp 385–410
Boyd MJ (2016b) Becoming Mycenaean? The living, the dead, and the ancestors in the transformation of society in second millennium BC Southern Greece. In: Renfrew C, Morley I (eds) Death rituals, social order and the archaeology of immortality in the ancient world. Cambridge University Press, Cambridge, pp 200–220
Boyd MJ (2022) Middle Helladic and Early Mycenaean mortuary practices in the Southern and Western Peloponnese. British Archaeological Report, Oxford, p S1009
Buikstra JE (1972) Techniques for coping with the age-regressive nature of nonmetric traits. Am J Phys Anthropol 37:431–432
Buikstra JE, Ubelaker DH (1994) Standards for data collection from human skeletal remains. Fayetteville: Arkansas Archeological Survey Research Series No. 44
Bulatović A, Molloy B, Filipović V (2021) The Balkan-Aegean migrations revisited: changes in material culture and settlement patterns in the Late Bronze age Central Balkans in light of new data. Starinar 71:61–105
Carpenter ML, Buenrostro JD, Valdiosera C, Schroeder H, Allentoft ME, Sikora R, Gravel S, Guille S, Nekhrizov G, Leshtakov K, Dimitrova D, Theodossiev N, Pettene D, Luiselli DK, Moreno-Estrada A, Li Y, Wang J, Gilbert MTP, Willerslev E, Greenleaf WJ, Bustamante CD (2013) Pulling out the 1%: whole-genome capture for the targeted enrichment of ancient DNA sequencing libraries. Am J Hum Genet 93(5):852–864. https://doi.org/10.1016/j.ajhg.2013.10.002
Carson A (2006) Maximum-likelihood variance components analysis of heritabilities of cranial nonmetric traits. Hum Biol 78:383–402
Cavanagh WG, Mee C (1998) A private place: death in prehistoric Greece. Jonsered, Studies in Mediterranean Archaeology, CXXV
Cavazzuti C, Skeates R, Millard AR, Nowell G, Peterkin J, Brea MB, Cardarelli A, Salzani L (2019) Flows of people in villages and large centres in Bronze Age Italy through strontium and oxygen isotopes. PLOS ONE 14. https://doi.org/10.1371/journal.pone.0209693
Cheverud JM, Buikstra JE (1981a) Quantitative genetics of skeletal nonmetric traits in the rhesus macaques on Cayo Santiago. I. Single trait heritabilities. Am J Phys Anthropol 54:43–49
Cheverud JM, Buikstra JE (1981b) Quantitative genetics of skeletal nonmetric traits in the rhesus macaques on Cayo Santiago. II. Phenotypic, genetic, and environmental correlations between traits. Am J Phys Anthropol 54:51–58
Cheverud JM, Buikstra JE (1982) Quantitative genetics of skeletal nonmetric traits in the rhesus macaques of Cayo Santiago. III. Relative heritability of skeletal nonmetric and metric traits. Am J Phys Anthropol 59:151–155
Clemente F, Unterländer M, Dolgova O, Amorim CEG, Coroado-Santos F, Neuenschwander S, Ganiatsou E, Cruz Dávalos DI, Anchieri L, Michaud F, Winkelbach L, Blöcher J, Arizmendi Cárdenas YO, Sousa da Mota B, Kalliga E, Souleles A, Kontopoulos I, Karamitrou-Mentessidi G, Philaniotou O, Sampson A, Theodorou D, Tsipopoulou M, Akamatis I, Halstead P, Kotsakis K, Urem-Kotsou D, Panagiotopoulos D, Ziota C, Triantaphyllou S, Delaneau O, Jensen JD, Moreno-Mayar JV, Burger J, Sousa VC, Lao O, Malaspinas A-S, Papageorgopoulou C (2021) The genomic history of the Aegean palatial civilizations. Cell 184:2565–2586. https://doi.org/10.1016/j.cell.2021.03.039
Cline EH (2021) 1177 B.C.: the year civilization collapsed: revised and updated, 2nd edn. Princeton University Press, Princeton
Coulson WDE, Tsipopoulou M (1994) Preliminary investigations at Halasmenos, Crete, 1992–93. Aegean Archaeol I:65–97
Dmitrović K (2016) Bronze Age necropolises in the Čačak Region. National Museum of ČAČAK
Dodo Y (1974) Nonmetrical cranial traits in the Hokkaido Ainu and the northern Japanese of recent times. J Anthropol Soc Nippon 82:31–51
Eder B (2009) The northern boundary of the Mycenaean world. In: Doulgeri-Intzesiloglou A, Mazarakis Ainian A (eds) Αρχαιολογικό Έργο Θεσσαλίας Και Στερεάς Ελλάδας, /Πρακτικά Επιστημονικής Συνάντησης, Βόλος. Department of Archaeology, University of Thessaly and Ministry of Culture, Athens, pp 113–31
Eisenmann S, Bánffy E, van Dommelen P, Hofmann KP, Maran J, Lazaridis I, Mittnik A, McCormick M, Krause J, Reich D, Stockhammer PW (2018) Reconciling material cultures in archaeology with genetic data: the nomenclature of clusters emerging from archaeogenomic analysis. Sci Rep 8:13003. https://doi.org/10.1038/s41598-018-31123-z
Emanuel JP (2017) Black ships and sea raiders: the Late Bronze and Early Iron Age context of Odysseus’ second Cretan Lie. Lexington Books, London
Evteen A, Movsesian AA (2016) Brief communication: testing the association between human mid-facial morphology and climate using autosomal, mitochondrial, Y chromosomal polymorphisms and cranial non-metrics. Am J Phys Anthropol 159:517–522. https://doi.org/10.1002/ajpa.22894
Fernández E, Pérez-Pérez A, Gamba C, Prats E, Cuesta P, Anfruns J, Molist M, Arroyo-Pardo E, Turbón D (2014) Ancient DNA analysis of 8000 B.C. near eastern farmers supports an Early Neolithic pioneer maritime colonization of mainland Europe through Cyprus and the Aegean islands. PLOS Genet 10(6):e1004401. https://doi.org/10.1371/journal.pgen.1004401
Feuer B (2011) Being Mycenaean: a view from the periphery. Am J Archaeol 115:507–536. https://doi.org/10.3764/aja.115.4.0507
Frank AB, Frei R, Moutafi I, Voutsaki S, Orgeolet R, Kristiansen K, Frei KM (2021) The geographic distribution of bioavailable strontium isotopes in Greece - a base for provenance studies in archaeology. Sci Total Environ 791:148156. https://doi.org/10.1016/j.scitotenv.2021.148156
Frieman CJ, Hofmann D (2019) Present pasts in the archaeology of genetics, identity, and migration in Europe: a critical essay. World Archaeol 51:528–545. https://doi.org/10.1080/00438243.2019.1627907
Giannopoulos T (2009) “One ring to bind them”. The chamber tomb I of Monodendri in Achaea and the missing piece of an interesting puzzle. In: Borgna E, Cassola Guida P (eds) From the Aegean to the Adriatic: social organisations, modes of exchange and interaction in Postpalatial times (12th - 11th BC). Quasar, Roma, pp 115–128
Giblin J (2020) Isotope analysis on the Great Hungarian Plain: an exploration of mobility and subsistence strategies from the Neolithic to the Copper Age. Archaeolingua, Budapest
Gori M, Abar A (2023) Comparing apples and oranges? Confronting social science and natural science approaches to migration in archaeology. In: Fernandez Gotz M, Stockhammer P (eds) Where are you going? Reconsidering migrations in the metal ages. Oxford University Press, Oxford
Gori M, De Angelis S (2017) The wheel and the sun: ‘Glocal’ symbologies of wheel-pendants across Europe. In: Bergerbrant S, Wessman A (eds) New perspectives on the Bronze Age: Proceedings of the 13th Nordic Bronze Age Symposium Held in Gothenburg 9th to 13th June 2015, pp 355–366
Graff E (2011) Mycenaean occupants of ancient Kallithea: understanding a population‘s health, culture, and lifestyle through bioarchaeological analysis. Master Thesis. University of Waterloo
Green RF, Suchey JM (1976) The use of inverse sine transformations in the analysis of non-metric cranial data. Am J Phys Anthropol 45:61–68
Grüneberg H (1952) Genetical studies on the skeleton of the mouse IV. Quasi-continuous variations. J Genet 51:95–114
Guatelli-Steinberg D, Irish JD, Lukacs JR (2001) Canary islands-north African population affinities: measures of divergence based on dental morphology. Homo 52:173–188
Hakenbeck S (2019) Genetics, archaeology and the far right: an unholy Trinity. World Archaeol 51:517–527
Hamilakis Y (2017) Yannis Hamilakis | Who are you calling Mycenaean? [WWW Document]. LRB Blog (London Review of Books). URL https://www.lrb.co.uk/blog/2017/august/who-are-you-calling-mycenaean. Accessed 6.22.22
Hanihara T (2013) Geographic structure of dental variation in the major human populations of the world. In: Scott GR, Irish JD (eds) Anthropological perspectives on tooth morphology: genetics, evolution, variation. Cambridge University Press, Cambridge, pp 479–509
Hanihara T, Ishida H, Dodo Y (2003) Characterization of biological diversity through analysis of discrete cranial traits. Am J Phys Anthropol 121:241–251
Harris HF, Sjøvold T (2004) Calculation of Smith’s mean measure of divergence for intergroup comparisons using nonmetric data. Dent Anthropol 17:83–93
Hauser G, De Stefano GF (1989) Epigenetic variants of the human skull. Schweizerbart, Stuttgart
Hawkey DE (2004) The peopling of South Asia: evidence for affinities and microevolution of prehistoric populations of India and Sri Lanka. National Museums of Colombo, Sri Lanka
Hefner JT, Linde KC (2018) Atlas of human cranial macromorphoscopic traits. Academic Press, UK
Herrera B, Hanihara T, Godde K (2014) Comparability of multiple data types from the Bering Strait region: cranial and dentalmetrics and nonmetrics, mtDNA, and Y-chromosome DNA. Am J Phys Anthropol 154:334–348
Hervella M, Rotea M, Izagirre N, Constantinescu M, Alonso S, Ioana M, Lazăr C, Ridiche F, Soficaru AD, Netea MG (2015) Ancient DNA from South-East Europe reveals different events during Early and Middle Neolithic influencing the European genetic heritage. PLoS ONE. https://doi.org/10.1371/journal.pone.0128810
Heyd V (2017) Kossinna’s smile. Antiquity 91:348–359. https://doi.org/10.15184/aqy.2017.21
Hitchcock L, Maeir A (2014) Yo-ho, yo-ho, a seren’s life for me! World Archaeol. https://doi.org/10.1080/00438243.2014.928602
Hubbard AR (2012) An examination of population history, population structure, and biological distance among regional populations of the Kenyan coast using genetic and dental data. The Ohio State University, Columbus
Hubbard AR, Guatelli-Steinberg D, Irish JD (2015) Do nuclear DNA and dental nonmetric data produce similar reconstructions of regional population history? An example from modern coastal Kenya. Am J Phys Anthropol 157:295–304
Iacono F (2019) the archaeology of Late Bronze Age interaction and mobility at the gates of Europe: people, things and networks around the Southern Adriatic Sea. Bloomsbury Publishing, London
Iacono F (2020) The archaeology of Late Bronze Age interaction and mobility at the gates of Europe. People, things and networks around the Southern Adriatic Sea. Bloomsbury Publishing, UK
Iacono F, Borgna E, Cattani M, Cavazzuti C, Dawson H, Galanakis Y, Gori M, Iaia C, Ialongo N, Lachenal T, Lorrio A, Micó R, Molloy BPC, Nafplioti A, Peche-Quilichini K, Herrada CR, Risch R (2021) Establishing the Middle Sea: the Late Bronze Age of Mediterranean Europe (1700–900 BC). J Archaeol Res. https://doi.org/10.1007/s10814-021-09165-1
Ion A (2019) Who are we as historical being? Shaping identities in light of the archaeogenetics ‘revolution.’ Curr Swedish Archaeol 27:11–36. https://doi.org/10.37718/CSA.2019.01
Irish JD (1993) Biological affinities of Late Pleistocene through modern African aboriginal populations: the dental evidence. Arizona State University, Tempe
Irish JD (2010) The mean measure of divergence: its utility in model free and model-bound analyses relative to the Mahalanobis D2 distance for nonmetric traits. Am J Hum Biol 22:378–395
Irish JD (2013) Afridonty: the “Sub-Saharan African dental complex” revisited. In: Scott GR, Irish JD (eds) Anthropological perspectives on tooth morphology: genetics, evolution, variation. Cambridge University Press, Cambridge, pp 278–295
Irish JD (2016) Who were they really? Model-free and model-bound dental nonmetric analyses to affirm documented population affiliations of seven South African “Bantu” samples. Am J Phys Anthropol 159:655–670
Irish JD, Guatelli-Steinberg D (2003) Ancient teeth and modernhuman origins: an expanded comparison of African Plio-Pleistocene and recent world dental samples. J Hum Evol 45:113–144
Irish JD, Morez A, Girdland Flink L, Phillips ELW, Scott RG (2020) Do dental nonmetric traits actually work as proxies for neutral genomic data? Some answers from continental- and global-level analyses. Am J Phys Anthropol 1–29. https://doi.org/10.1002/ajpa.24052
Jung R (2009) Pirates of the Aegean: Italy - the East Aegean - Cyprus at the end of the second millennium BC. In: Karagheorgis V, Kouka (eds) Cyprus and the East Aegean intercultural contacts from 3000 to 500 BC: an international archaeological symposium held at Pythagoreio, Samos, October 17th-18th 2008. A. G. Leventis Foundation, Nicosia, pp 72–93
Jung R, Mehofer M (2013) Mycenaean Greece and Bronze Age Italy: cooperation, trade or war? Archäologisches Korrespondenzblatt 43:175–192
Kapp JD, Green RE, Shapiro B (2021) A fast and efficient single-stranded genomic library preparation method optimized for ancient DNA. J Hered 112(3):241–249. https://doi.org/10.1093/jhered/esab012
Kasimi-Soutou M (2006) Archaeologikon Deltion, Β΄1, p. 228
Katsimicha M (2018) Kallithea Rampantania: investigating differential social and (biological) sex status in a Late Bronze Age cemetery in Achaea, Peloponnese, Greece; through the prism of alternative approaches in the study of paleaopathology in assemblages of fragmentary and commingled remains. MSc Dissertation, Durham University
Katsimicha M, Moutafi I, Jakob T (2022) Investigating the ‘peripheral’ Mycenaean community: preliminary results of the bioarchaeological study of the Late Helladic III Kallithea-Rampantania cemetery, Achaea, Peloponnese, Greece. In: Aulsebrook S, Żebrowska K, Ulanowska A, Lewartowski K (eds) Sympozjum Egejskie. Papers in Aegean archaeology: 3. Turnhout: Brepols, 167–183
Kienlin T (2020) Social life on Bronze Age tells. Outline of a Practice-oriented Approach. In: Blanco-González A, Kienlin T (eds) Current approaches to tells in the prehistoric old world. Oxbow Books, Oxford, pp 173–188
Knapp AB (2021) Migration myths and the end of the Bronze Age in the eastern Mediterranean. In: Fernández-Götz M, Arnold B (eds) Elements in the Archaeology of Europe. Cambridge University Press, UK. https://doi.org/10.1017/9781108990363
Knapp B, Manning S (2016) Crisis in context: the end of the Late Bronze Age in the eastern Mediterranean. Am J Archaeol 120:99–149
Knappett C, Kiriatzi E (2017) Technological mobilities: perspectives from the eastern Mediterranean - an introduction. In: Kiriatzi E, Knappett C (eds) Human mobility and technological transfer in the prehistoric mediterranean, British School at Athens Studies in Greek Antiquity, pp.1–17
Knodell AR (2021) Societies in transition in Early Greece: an archaeological history, 1st edn. University of California Press, Los Angeles
Kolonas L (1998) Βούντενη, ένα σημαντικό Μυκηναϊκό κέντρο της Αχαΐας. Unpublished Ph.D. thesis, University of Crete
Kolonas L (2021) Βούντενη, ένα σημαντικό Μυκηναϊκό κέντρο της Αχαΐας. Archaeological Receipts Fund Publications, Athens
Konigsberg LW (1990) Analysis of prehistoric biological variation under a model of isolation by geographic and temporal distance. Hum Biol 62:49–70
Kovačević N, Mucić K (2009) Veliki Vanik, Tumul (AN 64). In: Mesić J (ed) Hrvatski arheološki godišnjak 6/2009. Ministarstvo kulture Republike Hrvatske, Zagreb, pp 688–689
Krapf T (2017) From Central Greece to the North and then Westwards? Tracing influences in matt painted pottery styles from MBA to EIA. In: Fotiadis M, Laffineur R, Lolos Y, Vlachopoulos A (eds), Hesperos, The Aegean seen from the West, Aegaeum. Aegaeum, Liège, p 349–360
Krapf T (2021) Contact networks north of the Mycenaean sphere: new insights from Sovjan and Maliq (SE Albania). In: Karantzali E (ed) The periphery of the Mycenaean world: recent discoveries and research results. Hellenic Ministry of Culture and Sports, Lamia, pp 659–669
Lazaridis I, Mittnik A, Patterson N, Mallick S, Rohland N, Pfrengle S, Furtwängler A, Peltzer A, Posth C, Vasilakis A, McGeorge PJP, Konsolaki-Yannopoulou E, Korres G, Martlew H, Michalodimitrakis M, Özsait M, Özsait N, Papathanasiou A, Richards M, Roodenberg SA, Tzedakis Y, Arnott R, Fernandes DM, Hughey JR, Lotakis DM, Navas PA, Maniatis Y, Stamatoyannopoulos JA, Stewardson K, Stockhammer P, Pinhasi R, Reich D, Krause J, Stamatoyannopoulos G (2017) Genetic origins of the Minoans and Mycenaeans. Nature 548:214
Lazaridis I, Alpaslan-Roodenberg S, Acar A, Açıkkol A, Agelarakis A, Aghikyan L, Akyüz U, Andreeva D, Andrijašević G, Antonović D, Armit I, Atmaca A, Avetisyan P, Aytek Aİ, Bacvarov K, Badalyan R, Bakardzhiev S, Balen J, Bejko L, Bernardos R, Bertsatos A, Biber H, Bilir A, Bodružić M, Bonogofsky M, Bonsall C, Borić D, Borovinić N, Bravo Morante G, Buttinger K, Callan K, Candilio F, Carić M, Cheronet O, Chohadzhiev S, Chovalopoulou M-E, Chryssoulaki S, Ciobanu I, Čondić N, Constantinescu M, Cristiani E, Culleton BJ, Curtis E, Davis J, Davtyan R, Demcenco TI, Dergachev V, Derin Z, Deskaj S, Devejyan S, Djordjević V, Duffett Carlson KS, Eccles LR, Elenski N, Engin A, Erdoğan N, Erir-Pazarcı S, Fernandes DM, Ferry M, Freilich S, Frînculeasa A, Galaty ML, Gamarra B, Gasparyan B, Gaydarska B, Genç E, Gültekin T, Gündüz S, Hajdu T, Heyd V, Hobosyan S, Hovhannisyan N, Iliev I, Iliev L, Iliev S, İvgin İ, Janković I, Jovanova L, Karkanas P, Kavaz-Kındığılı B, Kaya EH, Keating D, Kennett DJ, Deniz Kesici S, Khudaverdyan A, Kiss K, Kılıç S, Klostermann P, Kostak Boca Negra Valdes S, Kovačević S, Krenz-Niedbała M, Krznarić Škrivanko M, Kurti R, Kuzman P, Lawson AM, Lazar C, Leshtakov K, Levy TE, Liritzis I, Lorentz KO, Łukasik S, Mah M, Mallick S, Mandl K, Martirosyan-Olshansky K, Matthews R, Matthews W, McSweeney K, Melikyan V, Micco A, Michel M, Milašinović L, Mittnik A, Monge JM, Nekhrizov G, Nicholls R, Nikitin AG, Nikolov V, Novak M, Olalde I, Oppenheimer J, Osterholtz A, Özdemir C, Özdoğan KT, Öztürk N, Papadimitriou N, Papakonstantinou N, Papathanasiou A, Paraman L, Paskary EG, Patterson N, Petrakiev I, Petrosyan L, Petrova V, Philippa-Touchais A, Piliposyan A, Pocuca Kuzman N, Potrebica H, Preda-Bălănică B, Premužić Z, Price TD, Qiu L, Radović S, Raeuf Aziz K, Rajić Šikanjić P, Rasheed Raheem K, Razumov S, Richardson A, Roodenberg J, Ruka R, Russeva V, Şahin M, Şarbak A, Savaş E, Schattke C, Schepartz L, Selçuk T, Sevim-Erol A, Shamoon-Pour M, Shephard HM, Sideris A, Simalcsik A, Simonyan H, Sinika V, Sirak K, Sirbu G, Šlaus M, Soficaru A, Söğüt B, Sołtysiak A, Sönmez-Sözer Ç, Stathi M, Steskal M, Stewardson K, Stocker S, Suata-Alpaslan F, Suvorov A, Szécsényi-Nagy A, Szeniczey T, Telnov N, Temov S, Todorova N, Tota U, Touchais G, Triantaphyllou S, Türker A, Ugarković M, Valchev T, Veljanovska F, Videvski Z, Virag C, Wagner A, Walsh S, Włodarczak P, Workman JN, Yardumian A, Yarovoy E, Yavuz AY, Yılmaz H, Zalzala F, Zettl A, Zhang Z, Çavuşoğlu R, Rohland N, Pinhasi R, Reich D (2022) A genetic probe into the ancient and medieval history of Southern Europe and West Asia. Science 377:940–951. https://doi.org/10.1126/science.abq0755
Legarra Herrero B (2016) An elite-infested sea: interaction and change in Mediterranean paradigms. In: Molloy BPC (ed) Of Odysseys and oddities: scales and modes of interaction in the prehistoric Aegean, Sheffield studies in Aegean archaeology. Oxbow Books, Oxford, pp 25–52
Leppard TP, Esposito C, Esposito M (2020) The bioarchaeology of migration in the ancient Mediterranean: meta-analysis of radiogenic (87Sr/86Sr) isotope ratios. J Mediterr Archaeol 33:211–241. https://doi.org/10.1558/jma.18784
Lightfoot E, Šlaus M, Šikanjić PR, O’ Connell TC (2015) Metals and millets: bronze and Iron Age diet in inland and coastal Croatia seen through stable isotope analysis. Archaeol Anthropol Sci 7:375–386. https://doi.org/10.1007/s12520-014-0194-3
Malez M, Nikolić V (1975) Patološka pojava na prethistorijskoj čovječjoj lubanji iz pećine Bezdanjače u Lici. Rad Jugoslavenske Akademije Znanosti i Umjetnosti 371:171–179
Mantel NA (1967) The detection of disease clustering and a generalized regression approach. Can Res 27:209–220
Marcus JH, Posth C, Ringbauer H … Krause J, Novembre J (2020) Population history from the Neolithic to present on the Mediterranean island of Sardinia: an ancient DNA perspective. Nat Commun 11: 939. https://doi.org/10.1101/583104
Marović I (1991) Istraživanja kamenih gomila Cetinske kulture u srednjoj Dalmaciji. Vijesnik Za Arheologiju i Historiju Dalmatinsku 84:15–214
Martinoia V, Benazzi S, Carić M, Radović S (2021) Reconstructing the childhood diet of the individuals from the Middle/Late Bronze Age Bezdanjača Cave, Croatia (ca. 1430–1290 BCE) using stable C and N isotope analysis of dentin collagen. J Bioanthropol 1:42–56
Mathieson I, Alpaslan-Roodenberg S, Posth C … Pinhasi R, Reich D (2018) The genomic history of Southeastern Europe. Nature 555: 197–203
Mays S (2010) The archaeology of human bones, 2nd edn. Routledge, London
Michael DE, Fibiger L, Ziota C, Gkelou L, Molloy B (2021) Exploring the efficacy of comparative bioarchaeological approaches in providing answers on marginality and networking: the example of Late Bronze Age Achlada in Florina, Northern Greece. Bioarchaeol Int. https://doi.org/10.5744/bi.2021.1005
Middleton G (2010) The collapse of palatial society in LBA Greece and the postpalatial period. British Archaeological Reports, Oxford (England)
Middleton G (2017) Understanding collapse : ancient history and modern myths. Cambridge University Press, Cambridge
Middleton G (2020) Mycenaean collapse(s) c. 1200 BC. In: Middleton G (ed) Collapse and transformation: the Late Bronze Age to Early Iron Age in the Aegean. Oxbow Books, Oxford, pp 9–22
Molloy BPC (2016) Nought may endure but mutability: intercultural encounters and material transformations in the thirteenth to eleventh century BC Southeast Europe. In: Molloy BPC (ed) Of Odysseys and oddities: scales and modes of interaction in the prehistoric Aegean, Sheffield studies in Aegean archaeology. Oxbow Books, Oxford, pp 343–384
Molloy B (2023) Was there a 3.2 ka crisis in Europe? A critical comparison of climatic, environmental, and archaeological evidence for radical change during the Bronze Age-Iron Age transition. J Archaeol Res 31:331–394. https://doi.org/10.1007/s10814-022-09176-6
Molloy BPC, Jovanović D, Bruyère C, Marić M, Bulatović J, Mertl P, Horn C, Milašinović L, Mirković-Marić N (2020) A new Bronze Age mega-fort in Southeastern Europe: recent archaeological investigations at Gradište Iđoš and their regional significance. J Field Archaeol 45:293–314. https://doi.org/10.1080/00934690.2020.1734899
Moschos I (2009) Western Achaea during the succeeding LH III C late period - the final Mycenaean phase and the Submycenaean period. In: Deger-Jalkotzy S, Bächle E (eds) LH III C Chronology and Synchronisms III : LH III C Late and the Transition to the Early Iron Age. Verlag der Österreichischen Akademie der Wissenschaften, Wien, pp 235–288
Moutafi I (2021) Towards a social bioarchaeology of the Mycenaean period, a biocultural analysis of human remains from the Voudeni cemetery, Achaea, Greece. Oxbow Books, Oxford
Nafplioti A (2008) ‘Mycenaean’ political domination on Knossos following the Late Minoan IB destructions on Crete: negative evidence from strontium isotope analysis (87Sr/86Sr). J Archaeol Sci 35:2307–2317. https://doi.org/10.1016/j.jas.2008.03.006
Nafplioti A (2011) Tracing population mobility in the Aegean using isotope geochemistry: a first map of local biologically available 87Sr/86Sr signatures. J Archeol Sci 38:1560–70. https://doi.org/10.1016/j.jas.2011.02.021
Nicodemus A, O’Shea J (2019) “. the nearest run thing …” The Genesis and collapse of a Bronze Age polity in the Maros Valley of Southeastern Europe. In: Gyucha A (ed) Comparative approaches to population aggregation and early urbanization, the institute for European and Mediterranean archaeology distinguished monograph series. SUNY Series, New York, pp 61–80
Nikita E (2015) A critical review of the mean measure of divergence and Mahalanobis distances using artificial data and new approaches to the estimation of biodistances employing nonmetric traits. Am J Phys Anthropol 157:284–294
Nikita E (2017) Osteoarchaeology: a guide to the macroscopic study of human skeletal remains. Academic Press, San Diego
Nikita E, Nikitas P (2021) Measures of divergence for binary data used in biodistance studies. Archaeol Anthropol Sci 13:40
Nikita E, Nikitas P (2022) Simulation methods for squared Euclidean and Mahalanobis type distances for multivariate data and their application in assessing the uncertainty in hierarchical clustering. J Stat Comput Simul. https://doi.org/10.1080/00949655.2022.2030338
Nikita E (2020) Introduction to statistics using R. The Cyprus Institute, Science and Technology in Archaeology and Culture Research Center (STARC), Nicosia, Cyprus
Nikita E, Schrock C, Sabetai V, Vlachogianni E (2018) Bioarchaeological perspectives to diachronic life quality and mobility in ancient Boeotia, central Greece: preliminary insights from Akraiphia. Int J Osteoarchaeol 29:26–35. https://doi.org/10.1002/oa.2710
Nikita E, Mardini M, Mardini M, Degryse P (2022) SrIsoMed: an open access strontium isotopes database for the Mediterranean. J Archaeol Sci: Reports 45. https://doi.org/10.1016/j.jasrep.2022.103606
Novak M, Vyrouba V, Bedić Ž (2011) Palaeodemographic and palaeopathological characteristics of individuals buried in three Bronze Age sites from southern Croatia. Bull Int Assoc Paleodontol 5:15–27
Osborne R (2020) Collapse and transformation in Athens and Attica. In: Middleton G (ed) Collapse and transformation: the Late Bronze Age to Early Iron Age in the Aegean. Oxbow Books, Oxford, pp 137–144
Panagiotopoulou E, Montgomery J, Nowell G, Peterkin J, Doulgeri-Intzesiloglou A, Arachoviti P, Katakouta S, Tsiouka F (2018) Detecting mobility in early Iron Age Thessaly by strontium isotope analysis. Eur J Archaeol 21:590–611. https://doi.org/10.1017/eaa.2017.88
Papadopoulos AJ (1978) Ανασκαφή ΥΕ νεκροταφείου Καλλιθέας Πατρών, Πρακτικά της εν Αθήναις Αρχαιολογικής Εταιρείας (Praktika tēs en Athēnais Archaiologikēs Hetairias) 1976Α, pp 196–199
Papadopoulos AJ (1980a) ΑνασκαφήΥΕ νεκροταφείου Καλλιθέας Πατρών, Πρακτικά της εν Αθήναις Αρχαιολογικής Εταιρείας (Praktika tēs en Athēnais Archaiologikēs Hetairias) 1977, pp 184-186
Papadopoulos TJ (1980b) ΑνασκαφήΚαλλιθέας Πατρών, Πρακτικά της εν Αθήναις Αρχαιολογικής Εταιρείας (Praktika tēs en Athēnais Archaiologikēs Hetairias) 1978, pp 122-124
Papadopoulos TJ (1982) Ανασκαφή Καλλιθέας Πατρών, Πρακτικά της εν Αθήναις Αρχαιολογικής Εταιρείας (Praktika tēs en Athēnais Archaiologikēs Hetairias) 1980, pp 106-110
Papadopoulos T (1999) Ανασκαφή Μυκηναϊκού Νεκροταφείου Καλλιθέας Πατρών. Πρακτικά της εν Αθήναις Αρχαιολογικής Εταιρείας (Praktika tēs en Athēnais Archaiologikēs Hetairias)1997, 121–126
PapadopoulosT (2000) Ανασκαφή Μυκηναϊκού Νεκροταφείου Καλλιθέας Πατρών. Πρακτικά της εν Αθήναις Αρχαιολογικής Εταιρείας (Praktika tēs en Athēnais Archaiologikēs Hetairias) 1998, 83-87
PapadopoulosT (2005) Ανασκαφή Καλλιθέας Πατρών, Πρακτικά της εν Αθήναις Αρχαιολογικής Εταιρείας (Praktika tēs en Athēnais Archaiologikēs Hetairias) 2002, 61-63
Papadopoulou-Chrysikopoulou E (2015) Το Μυκηναϊκό νεκροταφείο Καλλιθέας-Λαγανιδιάς. Συμβολή στη μελέτη της Υστερομυκηναϊκής Εποχής στην Αχαΐα και στις γειτονικές της περιοχές. Unpublished PhD thesis. University of Ioannina.
Paschalidis C (2018) The Mycenaean cemetery at Achaia Clauss near Patras. People, material remains and culture in context. Archaeopress, Oxford
Periša D (2009) Zavojane/Ravča. In: Mesić J (ed) Hrvatski arheološki godišnjak 6/2009. Ministarstvo kulture Republike Hrvatske, Zagreb, pp 686–688
Petrović B (1991) Skeletni grobovistarijeg gvozdenog doba sa lokaliteta “Asfaltna baza” u Zemunu. Godišnjakgrada Beograda 38:5–15
Prowse TL, Lovell NC (1996) Concordance of cranial and dental morphological traits and evidence for endogamy in ancient Egypt. Am J Phys Anthropol 101:237–246
Relethford JH (2016) Biological distances and population genetics in bioarchaeology. In: Hefner JT (ed) PilloudMA. Biological distance analysis: forensic and bioarchaeological perspectives. Academic Press, San Diego, pp 23–34
Ricaut F, Auriol V, von Cramon-Taubadel N, Keyser C, Murail P, Ludes B, Crubézy E (2010) Comparison between morphological and genetic data to estimate biological relationship: the case of the Egyin Gol necropolis (Mongolia). Am J Phys Anthropol 143:355–364
Ruppenstein F (2020) Migration events in Greece at the end of the second millennium BC and their possible Balkanic background. In: Maran J, Băjenaru R, Ailincăi S-C, Popescu A-D, Hansen S (eds) Objects, ideas and travelers: contacts between the Balkans, the Aegean and Western Anatolia during the Bronze and Early Iron Age : volume to the memory of Alexandru Vulpe : Proceedings of the Conference in Tulcea, 10-13 November, 2017. Verlag Dr. Rudolf Habelt GmbH, Bonn, 107–122
Santos F (2017) AnthropMMD: An R package with a graphical user interface for the mean measure of divergence. Am J Phys Anthropol 165:200–205. https://doi.org/10.1002/ajpa.23336
Saunders SR, Popovich F (1978) A family study of two skeletal variants: atlas bridging and clinoid bridging. Am J Phys Anthropol 49:193–204
Saunders SR, Rainey DL (2008) Nonmetric trait varation in the skeleton: abnormalities, anomalies and atavisms. In: Katzenberg MA, Saunders SR (eds) Biological anthropology of the human skeleton, 2nd edn. Wiley, New Jersey, pp 533–560
Sava V, Ignat A (2016) The beginning of the Late Bronze Age in the Lower Mureş Basin. An Overview. In: Gogâltan F, Cordoș C (eds) Prehistoric settlements: social, economic and cultural aspects. EDITURA MEGA, Cluj-Napoca, pp 191–199
Scott GR (2008) Dental morphology. In: Katzenberg MA, Saunders SR (eds) Biological anthropology of the human skeleton, 2nd edn. Wiley-Liss, New York, pp 265–298
Scott GR, Turner CG (1997) The anthropology of modern teeth: dental morphology and its variation in recent human populations. Cambridge University Press, Cambridge
Scott GR, Anta A, de la Rua C, Schomberg R (2013) Basque dental morphology and the “Eurodont” dental pattern. In: Scott GR, Irish JD (eds) Anthropological perspectives on tooth morphology: genetics, evolution, variation. Cambridge University Press, Cambridge, pp 296–318
Séré M, Thévenon S, Belem A, De Meeûs T (2017) Comparison of different genetic distances to test isolation by distance between populations. Heredity 119:55–63
Sjøvold T (1973) Occurrence of minor non-metrical variants in the skeleton and their quantitative treatment for population comparisons. Homo 24:204–233
Sjøvold T (1977) Non-metrical divergence between skeletal populations. Ossa 4:1977
Skourtanioti E, Ringbauer H, Ruscone GAG, Bianco RA, Burri M, Freund C, Furtwängler A, Martins NFG, Knolle F, Neumann GU, Tiliakou A, Agelarakis A, Andreadaki-Vlazaki M, Betancourt P, Hallager BP, Jones OA, Kakavogianni O, Kanta A, Karkanas P, Kataki E, Kissas K, Koehl R, Kvapil L, Maran J, McGeorge PJP, Papadimitriou A, Papathanasiou A, Papazoglou-Manioudaki L, Paschalidis K, Polychronakou-Sgouritsa N, Preve S, Prevedorou EA, Price G, Protopapadaki E, Schmidt-Schultz T, Schultz M, Shelton K, Wiener MH, Krause J, Jeong C, Stockhammer PW (2023) Ancient DNA reveals admixture history and endogamy in the prehistoric Aegean. Nat Ecol Evol 7:290–303. https://doi.org/10.1038/s41559-022-01952-3
Slatkin M (1993) Isolation by distance in equilibrium and non-equilibrium populations. Evolution 47(1):264–279
Sołtysiak A (2011) Technical note: an R script for Smith’s mean measure of divergence. Bioarchaeol Near East 5:41–44
Souza P, Houghton P (1977) The mean measure of divergence and the use of non-metric data in the estimation of biological distances. J Archaeol Sci 4:163–169. https://doi.org/10.1016/0305-4403(77)90063-2
Sutter RC, Mertz L (2004) Nonmetric cranial trait variation and bprehistoric biocultural change in the Azapa Valley, Chile. Am J Phys Anthropol 123:130–145
Tartaron T (2004) Bronze Age landscape and society in Southern Epirus, Greece. British Archaeological Reports, Oxford
Tartaron TF (2014) Maritime networks in the Mycenaean world. Cambridge University Press, New York
Tasic N (1972) “An Early Iron Age collective tomb at Gomolava”. Archaeologia Iugoslavica XIII, 27–37
Tomasović M (2011) Kasnosrednjovjekovno groblje u tumulu 1 na Ogradi (Dražice) u Eracima (Istočna Plina). In: Tomasović M (ed) Arheološka istraživanja na trasi autoceste u Zabiokovlju i Plini. Makarska, pp 285–314
Tsipopoulou M, Vagnetti L, Liston M (2003) New evidence for the Dark Ages in Eastern Crete an unplundered tholos tomb at Vasiliki. Studi Micenei Ed Egeo-Anatolici 45(1):85–124
Turner CG (1986) Debtochronological separation estimates for Pacific rim populations. Science 232:1140–1142
Turner CG (1990) Major features of Sundadonty and Sinodonty, including suggestions about East Asian microevolution, population history, and Late Pleistocene relationships with Australian aboriginals. Am J Phys Anthropol 82:285–317
Tyrrell A (2000) Skeletal non-metric traits and the assessment of inter-and intra-population diversity: past problems and future potential. In: Cox M, Mays S (eds) Human osteology in archaeology and forensic science. Greenwich Medical Media, London, pp 289–306
Ullinger JM, Sheridan SG, Hawkey DE, Turner CG, Cooley R (2005) Bioarchaeological analysis of cultural transition in the Southern Levant using dental nonmetric traits. Am J Phys Anthropol 128:466–476
Velasco MC (2018) Open sepulchers and closed boundaries? Biodistance analysis of cemetery structure and postmarital residence in the late prehispanic Andes. Am J Phys Anthropol 166:906–920. https://doi.org/10.1002/ajpa.23594
Wallace S (2018) Travellers in time: imagining movement in the Ancient Aegean World, 1st edn. Routledge, Abingdon
Wilczak CA, Jones EB (eds) (2011) Osteoware software manual: volume II pathology module. Smithsonian Institution, Washington, D.C.
Ziota C (2019) Ύστερη Εποχή του Χαλκού: Terra incognita στον αρχαιολογικό χάρτη της Φλώρινας. Podium paper presented at Stellar Ventures from the shores of Crete to the plains of Macedonia. International Conference in honour of Professor Stelios Andreou for his contribution to Aegean Archaeology, Thessaloniki, 12–15 December 2019
Acknowledgements
We would like to thank all our collaborators of the Archaeological Agencies in Greece, Serbia, Croatia, and Romania. We would especially like to thank Professor Joel Irish for his advice and constructive remarks during the preparation of this paper. We would also like to warmly thank Associate Professor Efthymia Nikita for her advice regarding the statistical processing of our paper, as well as Ms. Caroline Bruyere for providing the associated map. We finally thank the associate editor and anonymous reviewers for their constructive comments.
Funding
Open access funding provided by HEAL-Link Greece. This research has been funded as part of the European Research Grant project “The Fall of 1200 BC” (Grant number 772753).
Author information
Authors and Affiliations
Contributions
Conceptualization: Dimitra Ermioni Michael, Linda Fibiger and Barry Molloy; Methodology: Dimitra Ermioni Michael and Linda Fibiger; Data acquisition: Dimitra Ermoni Michael and Linda Fibiger; Statistical Analysis: Dimitra Ermioni Michael; Writing—original draft preparation: Dimitra Ermioni Michael and Barry Molloy; Writing—review and editing: Dimitra Ermioni Michael, Linda Fibiger, Ioanna Moutafi, Mario Slaus, Maria Katsimicha, Mario Novak and Barry Molloy; Funding acquisition: Barry Molloy; Resources: Mario Slaus, Ioanna Moutafi, Mario Novak and Maria Katsimicha. All authors read and approved the final manuscript
Corresponding authors
Ethics declarations
Competing interests
The authors declare no competing interests.
Additional information
Publisher's Note
Springer Nature remains neutral with regard to jurisdictional claims in published maps and institutional affiliations.
Supplementary Information
Below is the link to the electronic supplementary material.
Rights and permissions
Open Access This article is licensed under a Creative Commons Attribution 4.0 International License, which permits use, sharing, adaptation, distribution and reproduction in any medium or format, as long as you give appropriate credit to the original author(s) and the source, provide a link to the Creative Commons licence, and indicate if changes were made. The images or other third party material in this article are included in the article's Creative Commons licence, unless indicated otherwise in a credit line to the material. If material is not included in the article's Creative Commons licence and your intended use is not permitted by statutory regulation or exceeds the permitted use, you will need to obtain permission directly from the copyright holder. To view a copy of this licence, visit http://creativecommons.org/licenses/by/4.0/.
About this article

Cite this article
Michael, D.E., Fibiger, L., Moutafi, I. et al. Exploring connectivity in Late Bronze Age/Early Iron Age Greece and the Balkans using cranial non-metric analysis. Archaeol Anthropol Sci 15, 165 (2023). https://doi.org/10.1007/s12520-023-01862-w
Received:
Accepted:
Published:
DOI: https://doi.org/10.1007/s12520-023-01862-w