Abstract
Based on the study of the relationship between structure and feedback of China’s natural gas demand system, this paper establishes a system dynamics model. In order to simulate the total demand and consumption structure of natural gas in China, we set up seven scenarios by changing some of the parameters of the model. The results showed that the total demand of natural gas would increase steadily year by year and reach in the range from 3600 to 4500 billion cubic meters in 2035. Furthermore, in terms of consumption structure, urban gas consumption would still be the largest term, followed by the gas consumption as industrial fuel, gas power generation and natural gas chemical industry. In addition, compared with the population growth, economic development still plays a dominant role in the natural gas demand growth, the impact of urbanization on urban gas consumption is significant, and the promotion of natural gas utilization technology can effectively reduce the total consumption of natural gas.
1 Introduction
Given the background of Chinese overall deployment of ecologically sustainable development, the transition trend to cleaner and lower-carbon energy structures is almost irreversible. In recent years, due to the pressure of carbon emissions reduction, China has been searching for more effective energy to support sustainable economic development. For fossil energy, natural gas is undoubtedly the best choice. The current natural gas consumption share in China is far lower than the world average, which indicates that there is great potential for development for China’s natural gas market. It is expected that natural gas will be the fastest growing fossil energy by 2035, as pointed out in “BP Energy Outlook (2017).” Higher requirements were proposed in “the natural gas development plan in the 13th Five-Year Plan” about development of natural gas by the National Energy Administration of China. Since the second half of 2017, domestic natural gas prices have risen continuously, especially from late November; over 100% of the rise was completed in only 1 month. One of the reasons for natural gas prices boom is the failure to accurately predict the demand for natural gas, which results in the demand increased sharply while the supply was not duly supplemented. Thus, the sufficient supply of natural gas has a significant impact on energy security, economic growth and people’s lives. It is very important for China to forecast natural gas consumption scientifically in future. In addition, analyzing the influencing factors of natural gas consumption is extremely beneficial for China’s government to formulate energy development policies for future periods.
In previous literature (Qin and Guo 2006), one of the most usual methods to forecast natural gas consumption was that firstly inferring the relationship between energy consumption and economic development (also is called energy consumption intensity) to estimate the total energy consumption of the whole society, and then through the proportion of natural gas consumption in the energy consumption structure to calculate the natural gas consumption. In recent years, due to the rise of computer technology, applying artificial intelligence models to forecast natural gas demand has been developing rapidly (Yin and Liu 2004). In addition, more and more researchers tried to integrate various forecasting methods into one new model, and they believe that integrated models could overcome the shortcomings of single models and improve the prediction accuracy. For example, Xu and Wang (2010) integrated a polynomial curve model and moving average model to establish the PCMACP mixed model. Yin and Liu (2004) integrated a linear regression model, artificial neural network model and gray system prediction model to establish an optimal combination model and adopted an adaptive recursive algorithm to improve this model, obtaining a more exact prediction of natural gas demand. The above research has resulted in many important conclusions, but there were still some shortcomings, either lacking in comprehensive consideration, or too much dependence on complete and accurate data. Moreover, distribution curve models and econometric models obtained from historical data failed to reflect the complex influence of various interactive factors on the total natural gas consumption in the social economy system. Consequently, we consider adopting a bottom-up approach to construct a system model that can describe the natural gas demand system in more detail.
Natural gas demand is a complex dynamic system, which interacts close with the economy, society, ecology and environment. System dynamics has unique advantages in describing such systems, in which each element interacts with each other internally and as a whole contact with the external environment. System dynamics is a systematic approach founded by Professor Forrest of Massachusetts Institute of Technology in 1956, based on a system feedback mechanism. The causality and flow relations of the whole system are balanced by the input and output of the system and the positive and negative feedback between multiple circulatory systems, so as to simulate the changes of different scenarios (Wang 1994). Domestic researchers have made considerable progress in applying the basic principles and methods of system dynamics to predicting energy supply and demand (Li and Yang 2010; Lv et al. 2015; Tang et al. 2010; Chen 2010; Yang et al. 2005; Tan 2009). In the study of natural gas, Shi and Zhou (2012) established the prediction model of natural gas supply and demand in China by means of system dynamics from the perspective of future natural gas supply and demand security. Li et al. (2010) divided the natural gas consumption sectors by industry, took into account the related factors of natural gas consumption in various industries and established a system dynamic model to forecast the future natural gas consumption. Sun et al. (2010) established a supply and demand system dynamics model of China’s natural gas industry, to predict the future supply and demand relationship of China’s natural gas and to analyze the influence of related factors on supply and demand, and concluded that in comparison with the enrichment degree of natural gas resources and investment level of natural gas development, the energy structure has more obvious influence on China’s natural gas supply and demand. The research methods in this paper are partly derived from the above studies. But this paper tends to dissect the structure of natural gas system more microscopically and pays more attention to the trends of future natural gas supply and demand and the dynamic changes of the natural gas consumption structure.
2 Boundary determination and structure analysis of China’s natural gas demand system
The natural gas system is an important component of the overall energy system. Primary energy in nature goes through the process of being exploited, transported, refined, stored and distributed, and finally being consumed by the end users. In this process, energy flows from the production side to the consumer side, which also be regarded as a complete energy system. The energy system can be divided into the global energy system, national energy system and urban energy system according to its scope, and can be divided into the petroleum, coal, natural gas and renewable energy systems according to the types of energy. According to systematic theory, all systems in reality are open and constantly exchange material, energy and information with the external environment, which ensure the systems work stably (Zhao et al. 2001). As a subsystem of the global energy system, China’s natural gas supply and demand system is bound to be closely related to other energy systems of different energy types or ranges. International natural gas trade is achieved only by pipeline or shipping, but the huge costs of constructing pipelines and liquefying natural gas restrict the trade in natural gas between different regions, so the natural gas systems among different regions are relatively isolated. Currently, there are three main natural gas markets worldwide. These are the North American market, the European market and the Asia Pacific market according to the development level, and even in the Asia Pacific market China’s natural gas development lags behind Japan and South Korea; therefore, in this paper China’s natural gas system will be separated from the global energy system to be analyzed separately. In addition, because of the low degree of competition in China’s natural gas market and the leading role of the Chinese government in the price of natural gas, the impact of price on natural gas supply and demand is relatively low; thus, the price factor is not taken into account in this paper.
The structure of the natural gas demand system in China is shown in Fig. 1, and the main influencing factors and mechanisms of natural gas consumption are as follows:

The structure of China’s natural gas demand system
-
(1)
Economic development Transport and distribution are important links in the natural gas industry from the production end to the consumer end. The construction of gas transmission pipelines and gas distribution networks requires huge amounts of capital input, and the return on investment cycle is relatively long, which needs continuous development of economic support. With the continuous economic growth, the need of people for clean and efficient energy has been evolving, which causes the increase in natural gas consumption. The experiential data show that natural gas consumption is positively correlated with GDP per capita.
-
(2)
Energy policy The effect of policy on the development of the natural gas industry is immediate as well as obvious. Currently, in consideration of protecting the environment and reducing carbon emissions, the Chinese government has been committed to changing energy structure and encouraging the use of natural gas. Some coal power plants were forcibly shut down, and the policies of “coal to gas” in the industrial sector and “oil to gas” in the transportation sector were steadily implemented, which extends the range of natural gas consumption.
-
(3)
Population Population size affects not only the total consumption of natural gas but also the utilizing mode. Especially, the proportion of urban population plays an important role in natural gas consumption. The relatively low cost of per capita investment of natural gas infrastructure in densely populated areas makes the popularization of natural gas come true more easily than in rural areas.
-
(4)
Industrial structure Differences exist inevitably in natural gas consumption patterns and consumption intensity of different industries; for example, in the chemical industry natural gas is usually consumed as a raw material, while in the industrial sector it is directly burned to provide energy for industrial processes. Therefore, a change of industrial structure will have some impact on the consumption of natural gas.
3 Modeling and parameter estimation of the natural gas demand system
3.1 System dynamics modeling
Based on the above boundary definition and structure analysis on China’s natural gas supply and demand system, we establish a system dynamics model to predict the future demand for China’s natural gas and then conduct scenario simulation through changing some parameters so as to explore the sensitivity of the results to different factors. Figure 2 shows the flow diagram of China’s natural gas supply and demand system. The flow diagram evolves from a causal loop diagram that depicts causal relationships among variables. The more excellent performance of a flow diagram than a causal loop diagram is dividing the variables into stock and flow according to the variables’ characteristics, so that the dynamic cumulative effects of the system can be clearly described. These cumulative effects are described jointly by level variables and rate variables. The level variables in the model include natural gas inventory at the end of year, GDP, and the national population. The rate variables include natural gas supply, natural gas consumption, GDP change and annual population change.

The flow diagram of China’s natural gas supply–demand system
3.2 Forecasting natural gas production
3.2.1 Logistic model
A logistic model is one of the common types of model to forecast natural gas production in current academic circles. This model was first proposed by Verhulst when he tried to simulate the law of continuous growth of biotic populations, and then was extended gradually to the topic of population growth and spread of infectious diseases in subsequent research. Hubbert (1949) proposed the peak oil theory on basis of a logistic model to forecast crude oil production and recoverable oil reserves in the USA. Chen et al. (1996) deduced the model from differential equations and used the linear trial error method of determining the parameter. Since then, the logistic model was paid much attention and was applied effectively in the China’s oil and gas field exploitation circles. Recently, researchers have extended the prediction range of this model from single oil and gas fields to the whole country. Höök and Aleklett (2009) applied a logistic model to predict coal production in the USA. Li et al. (2009) analyzed the prediction capability of a logistic model based on the data of American oil production. Reynolds and Kolodziej (2009) and Wang et al. (2013) established a multi-cycle logistic model to predict the demand and supply of natural gas in China. Lin and Wang (2012) and Wang et al. (2012) applied this model to predict China’s natural gas production. They compared the prediction performance of the logistic model and Gaussian model and concluded that the prediction results of the two models were quite similar (Lin and Wang 2012; Wang et al. 2012). Thus, it can be indicated that logistic model still has been applied extensively, but actually the prediction results were often not satisfactory. In the literature (Wang et al. 2012), the peak of China’s natural gas production was expected to appear in 2018, the peak value would be 103.14 billion cubic meters, but in fact China’s natural gas production in year of 2014 had exceeded 130 billion cubic meters and the peak of production is far from coming. Consequently, in this paper some new improvements have been made in the process of solving the logistic model. The logistic model can be expressed as follows.
where \(N_{\text{P}}\) is the cumulative production of natural gas, \(N_{\text{UR}}\) is the final recoverable reserves of natural gas, t is the year of prediction, \(t_{\hbox{max} }\) is the year when the production reaches peak value, and w is a model coefficient.
A conventional method to solve the model was the linear trial error method (Chen et al. 1996). According to the mathematical relation that annual natural gas production is the first-order derivative of cumulative production, they first got the function of production \(Q = \frac{{abN_{\text{UR}} {\text{e}}^{ - bt} }}{{(1 + a{\text e}^{ - bt} )^{2} }}\), and then they found out the ratio relationship between production and cumulative production: \(\frac{Q}{{{{N}}_{\text{P}} }} = \frac{{{{N}}_{\text{P}} ab{\text{e}}^{ - bt} }}{{{{N}}_{\text{UR}} }}\). Two new parameters were introduced to order \(\alpha = b\) and \(\beta = \frac{b}{{N_{\text{UR}} }}\), and finally, the function was obtained:
Then, according to the historical data of production and cumulative production, the value of the parameters and the final recoverable reserves can be obtained; thus, natural gas production and cumulative production in the future can also be calculated.
Our improvement is based on the derivation of the \(N_{\text{P}}\), then to find out the ratio relationship between production and the squares of cumulative production instead of cumulative production, \(\frac{Q}{{N_{\text{P}}^{2} }} = \frac{{ab{\text e}^{ - bt} }}{{N_{\text{UR}} }}\), further take the logarithm of 10 on the left and right sides and obtain the function \(\lg \frac{Q}{{N_{\text{P}}^{2} }} = \lg \frac{ab}{{N_{\text{UR}} }} - \frac{bt}{\ln 10}\). Order the parameters A to substitute \(\lg \frac{ab}{{N_{\text{UR}} }}\) and the parameters B to substitute \(\frac{b}{{{ \ln }10}}\), and finally obtain the linear relationship between \(\lg \frac{Q}{{N_{\text{P}}^{2} }}\) and t:
Compared with the conventional method to solve this model, our method has the following advantages: the average order of magnitude difference between \(\frac{Q}{{N_{\text{P}} }}\) and \(N_{\text{P}}\) is 105, while the average order of magnitude difference between \(\lg \frac{Q}{{N_{\text{P}}^{2} }}\) and \(t\) is only 101; consequently, adopting our method for fitting and simulation can obtain higher accuracy and reduce the systematic error simultaneously.
3.2.2 The data
The cumulative production is derived from the natural gas production data in China over the years from 1949, and the production data are from the China Energy Statistical Yearbook (DES 2015). In order to make the results convincing and reduce the accidental error caused by special data, we selected, respectively, 1949–2015, 1966–2015, 1982–2015 of China’s natural gas and natural gas cumulative production data to fit and compare.
3.2.3 The forecast results of natural gas production
The fitting results show that the R-square of the period from 1949 to 2015 is 0.85, the R-square of the period from 1966 to 2015 is 0.89, and the R-square of the period from 1982 to 2015 is 0.95; meanwhile, the value of the standard error of the estimate (SEE) is only 0.128. Obviously, the fitting is good.
Regression results show that A = − 4.134, B = 0.03334, b = 0.07678 and a = 140.1, and the algebraic relation between Np and NUR is obtained:
Correspondingly, the production of China’s natural gas can be calculated. Ultimately, the simulated production and simulated cumulative production of natural gas in China are presented in Fig. 3.

The forecast results of cumulative natural gas production and annual production in China
It can be observed from Fig. 3b that China’s natural gas production is in a period of rapid growth, the trend of which will continue until about 2020. Then, the growth slows down gradually, but the production of natural gas continues to increase until the peak production arrives about 2040. Subsequently, the production starts to decline. The peak production is expected to reach 2800 billion cubic meters according to our model. From Fig. 3a, we can see that the cumulative production of natural gas (\(N_{\text{P}}\)) finally reaches a stable value, and the stable value is the final recoverable reserves of natural gas (\(N_{\text{UR}}\)); from this, we simultaneously prove the quantitative relationship between NUR and NP:
In order to verify the validity of our model in respect of forecasting natural gas production, we compare the model forecast result of the period of 2006–2015 with the historical real data of the same period. As shown in Fig. 4, the model forecast result nearly presents the fully synchronous trend with the historical real data, and after 2009, the difference between simulated data and historical data reduced smaller and fluctuated in a very small range. By further calculating, the amplitude of relative error ratio is less than 10% within the observation time interval, which shows that the forecast effect of our model is fine.

The comparison of simulated values and historical values of natural gas production in China during 2006–2015
3.3 Model initialization and parameter determination
The forecast time interval of our system dynamic model is from 2016 to 2035, and the step time is 1 year. The initial GDP value was set as the GDP of 2016, and the initial population value was set as the population of 2016. The determination of other parameters, such as the contribution rate of chemical industry to GDP, the ratio of natural gas chemical products in GDP, the natural gas consumption intensity of chemical products, the proportion of natural gas power generation, the efficiency of natural gas power generation, the contribution rate of industrial products to GDP, the gas consumption intensity of industrial products, and the carbon emission coefficient of natural gas, mainly refer to industry reports and methods and data provided in the related literature. In addition, the determination of those parameters ought to adhere to the optimization direction of the natural gas consumption structure stipulated in Natural Gas Utilization Policy, which is ensuring urban gas, developing industrial fuel, encouraging natural gas power generation, and restricting the use of natural gas in the chemical industry. Finally, aiming at the determination of some parameters with functional relationships such as between per capita natural gas consumption and per capita GDP, between urban population ratio and per capita GDP and between total electricity generation and GDP, we use polynomial regression to obtain their functional expressions and coefficients. The detailed measurement process and results are as follows:
-
(1)
The positive correlation of per capita GDP with the proportion of urban population has been proven to be significant. In our study, we use the historical statistics data of China’s urbanization and the data of China’s per capita GDP from World Urbanization Prospects (DESA, the UN 2017) of 2014 to perform regression analysis. The regression results are shown in Fig. 5a. The additional explanation is that the urban population refers to the population living in the cities in the middle of the year, rather than the population on the urban household register.
Fig. 5 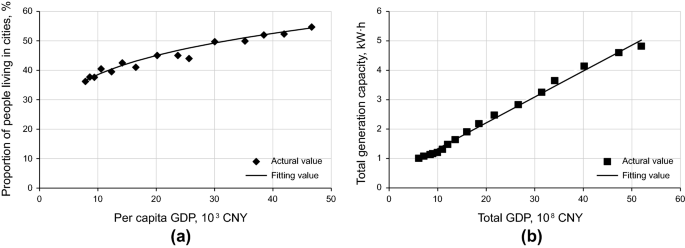
Fitting results of some of the parameters
-
(2)
A long-term, balanced and stable relationship exists between electricity consumption and economic growth (Lin 2003). The consumption and supply of electricity at the national level is a dynamic and balanced process; therefore, such relationship also exists between generating capacity and GDP. Based on the historical GDP data of the period of 2000–2015 and generating capacity, we perform linear regression and then forecast national generating capacity in the future. The regression results are shown in Fig. 5b. The efficiency of natural gas power generation is determined jointly by the calorific value of natural gas and the energy conversion efficiency of natural gas generators. In this study, the net calorific value of natural gas is determined as 38,931 kJ/m3, and power generation efficiency of a gas–steam combined cycle generator set in 2016 is determined as 52% (Yang et al. 2013). According to the speed of increasing one percentage point every 5 years thereafter, the power generation efficiency of natural gas will reach over 6 kW h/m3 before 2035.
-
(3)
General industrial products and chemical products are characterized by a wide variety, much difference in yield and specifications. Estimating the total natural gas consumption of industrial products and chemical products by accumulating the natural gas consumption of a unit product was not only intricate but also very likely to have a large error. Thus, in this study we estimate natural gas consumption of chemical industry and industrial fuel according to the natural gas consumption of per unit GDP. The concrete operation is that calculating natural gas consumption intensity of industrial fuels by the ratio of the calendar year production of general industrial products to the corresponding natural gas consumption, and calculating natural gas consumption intensity of chemical products by the ratio of the calendar year production of chemical products to the corresponding natural gas consumption.

At the end of this section, we made a table (Table 1) to summarize the initial values or calculation formulas of some important parameters and their data sources.
3.4 Scenario construction
Some variables influenced greatly by the policy with uncertainty are suitable for being set according to different scenarios, by which means we can counteract the uncertainty and provide references for policy makers. Such variables are also commonly called scenario variables in the previous literature. The scenario variables in this study include population growth rate, GDP growth rate and urbanization rate.
3.4.1 Population growth rate
According to relevant estimation and calculation, about 400 million populations were less born during the last 30 years since China implemented its harsh yet effective family planning policy; meanwhile, the natural population growth rate had dropped to below 0.5%, while this value remained 1.0% in the year 2000. In 2012, China implemented a two-child fertility policy as a new population policy after the Third Plenary Session of the 18th Central Committee, but because of China’s big population base, family planning will still be the basic national policy in the future. In this study, we referenced to the scenario prediction results of China’s future population development from existing research reports, which include World Population Outlook 2015 published by the United Nations and National Population Development Strategy Research Report published by National Population and Family Planning Commission (2007), and the trend analysis of China’s future population development from the literature by Cai and Zhang (2015) and Li (2015) to set three scenario schemes, shown in Table 2.
3.4.2 GDP growth rate
The GDP growth rate is greatly influenced by policy, while it usually exceeded the range of policy influences because of various and complicated factors. China’s economic growth has slowed down twice since the 11th Five-Year Plan. The first economic growth rate decline was steep, from 14% to 9%, and occurred in 2008, due to the effects of the global subprime mortgage crisis, and the second economic growth rate decline, from 9% to 7%, occurred in 2012. Ordinarily, the GDP growth rate will inevitably decline when the economy achieves a considerably huge scale. For the analysis and prospect of China’s future economic growth, we referenced to the China 2030 completed jointly by DRC and the World Bank (2013), China Energy Medium and Long Term Development Strategy Research Comprehensive Volume (2030, 2050) compiled by China Energy Medium and Long Term Development Strategy Research Group, and some other literature published by Tong et al. (2015) and Cooper and Xu (2015). Three scenario schemes for economic growth rate are shown in Table 3.
3.4.3 Integrated scenario schemes
Based on the above analysis to various variables and parameters, seven integrated scenario schemes were constructed to verify the impacts of different scenario schemes on natural gas consumption in China and then further explore the major contributors to natural gas consumption in China. The necessary assumptions and explanations about concrete values of each variable in different scenario schemes are shown in Table 4.
4 Simulation results and analysis
We input the above variables and parameters and simulate with the VENSIM system dynamics software, to obtain the forecast values of total natural gas consumption, natural gas imports, dependence on foreign natural gas and the consumption structure of natural gas. In the simulation, we change corresponding parameters value with different scenarios, to ultimately obtain the different forecast results.
4.1 The total natural gas consumption
Based on this study’s natural gas consumption scenario forecasting results, Fig. 6 suggests that the China’s natural gas consumption presents an obviously rising trend and the total consumption is expected to reach 3700–4500 billion cubic meters by 2035. The rising trend shows an approximately linear growth rather than exponential growth with time, which indicates that the average annual growth of natural gas is maintained at a certain level and the growth rate of natural gas consumption is declining. This growth pattern is based on the assumption that the consumption intensity of natural gas is declining. Under the guidance of the natural gas utilization policy, the intensity of natural gas consumption will inevitably continue to decline with the development of the natural gas industry. The lowest forecast value occurs in scenario 4, where the natural gas consumption will reach 361 billion cubic meters by 2035. Compared with scenario 1, the GDP growth rate in scenario 4 is at a low level, while the scenario 1 remains a relatively high growth rate, resulting in about 80 billion cubic meters decrease in forecast natural gas consumption. Similarly, the population growth rate of scenario 5 is in a lower level than scenario 1, but the forecast natural gas consumption decreases merely slightly, which is presented in Fig. 6 that the trend forecast curve of scenario 1 and scenario 5 is almost coincident. From the above comparison, it is not difficult to conclude that natural gas consumption is far more affected by the economic development level than population growth. The one reason is that economic development is closely and directly related to the all major consumer sectors of natural gas, while population growth only contributes to urban gas. Moreover, China’s current economic growth rate is slightly slower than 7%, which remains a huge development potential in future, even with the most pessimistic forecasts, economic growth rate is scarcely likely to be negative in the next 20 years, while China’s population growth rate has dropped to about 0.5%, and the total population being in a saturation state is gradually approaching the peak. Scenario 6 assumes identical other conditions as scenario 1 except to the accelerated urbanization of about 5%, leading to extra 12.9 billion cubic meters of natural gas consumption in comparison with scenario 1, which indicates that urbanization is promising to become one of the driving forces to result in a sustained increase in natural gas consumption. The natural gas consumption in scenario 7, based on the assumption of progress of natural gas utilization technology, is expected to reduce 10.2 billion cubic meters below scenario 1. The reason is that the progress of technology plays a role in cutting down the consumption intensity of natural gas and promoting utilization efficiency of natural gas.

The simulation results of natural gas demand in China during 2016–2035
4.2 Dependence on foreign natural gas
Figure 7 shows the scenario forecasting results of China’s dependence on foreign natural gas. It is easy to see that the Chinese degree of dependence on foreign natural gas shows the trend of first decline and then up in all seven scenarios. Currently, the natural gas production and consumption in China are on the track of rapid growth, but the growth rate of consumption is temporarily lower than the growth rate of production, so there will be a slight initial decline in the degree of dependence on foreign natural gas. With the improvement of domestic natural gas infrastructure and the greater support of Chinese government to clean energy, the demand of natural gas will increase further, while restricted by finite recoverable reserves it is difficult to maintain rapid growth of domestic natural gas production, so the degree of dependence on foreign natural gas eventually will increase when the growth rate of natural gas consumption exceeds the growth rate of production. In addition, the inflection point of the degree of dependence on foreign natural gas in different scenarios appears asynchronously. The faster the growth speed of natural gas demand is, the earlier the inflection point comes; for example, in Fig. 7 the inflection point of scenario 6 appears in the year of 2025, while that of scenario 4 appear in the year of 2029.

The simulation results of dependence on foreign natural gas in China during 2016–2035
4.3 Natural gas consumption structure
The scenario forecasting results of China’s natural gas consumption structure by different consumption sectors and different scenarios are shown in Fig. 8. Due to the GDP growth rate and the population growth rate in scenario 1, scenario 2 and scenario 3 were set to synchronous change, which brought great influence on the total natural gas consumption but only brought weak influence on natural gas consumption structure, so we merged the results of scenario 1, scenario 2 and scenario 3 into their average value to reflect the changes of consumption structure.

The simulation results of the natural gas consumption structure
With the implementation of the national strategy of reform and opening up, China’s industrialization process had been greatly accelerated, which leads to energy consumption, including natural gas consumption, increasing violently and natural gas chemical industry gradually replaced industrial fuel, becoming the largest natural gas consumption sector. By 1995, the proportion of industrial fuel gas in total natural gas consumption structure was more than 50%. After the industrial adjustment, accompanying the improvement of related infrastructure including natural gas transmission pipelines and urban pipe networks and the improvement of people’s living standard, urban gas entered a rapid development stage until it replaced the industrial fuel gas to be the largest natural gas consumption sector by 2008, and the proportion of industrial fuel gas fell to about 31%. The natural gas chemical industry has the disadvantages of high risk, high cost, low efficiency, and a short industrial chain; thus, all natural gas chemical projects including methanol production from natural gas were restricted or forbidden roundly, apart from natural gas hydrogen production projects which were allowed to continue to develop owing to high price endurance. During 1995–2005, the proportion of natural gas for the chemical industry continued to decline, but the proportion remained at over 30%, while after 2005, this proportion declined rapidly because the growth rate of natural gas for chemical industry was far lower than the growth rate of the other three consumption sectors, despite that the production of natural gas chemical products in this period still continued to increase. Electricity from natural gas was mainly used for peak shaving and cogeneration projects. With the increasingly serious environmental problems resulting from the high proportion of coal consumption attracting public attention, natural gas power generation projects have been popularized nationwide.
From the overall trend shown in Fig. 8, we can see that the proportion of urban gas and industrial fuel in natural gas consumption structure were only slightly changed, while the proportion of natural gas chemical industry and natural gas power generation presented a reverse substitution trend. In observation of all 7 scenarios, the proportion of city gas declined slightly from 37%–39% to 35%–37%, the proportion of industrial fuel maintained at 32%–35%, the proportion of natural gas for the chemical industry declined from 15% to 7%–9%, and the proportion of natural gas for power generation rose gradually from 13% to about 22%. The consumption sphere of urban gas mainly consisted of residential living, service industries, transportation and public utilities. The increase in urban gas consumption was derived from the development of tertiary industry and the acceleration of the urbanization process. On the one hand, the proportion of China’s tertiary industry in 2015 reached 50.5%. The proportion of tertiary industries in current developed countries is between 70% and 80%, so tertiary industry in China still has some development space. On the other hand, the Chinese government regards urbanization as the only way to push forward the reform and the Population Department of the UN predicted Chinese urbanization ratio will reach 68% in the year of 2035 from the current figure of about 50.5%. Both the above aspects will promote an increase in natural gas consumption in China. But as the growth peak of the tertiary industries and the urbanization process has already passed, the natural gas consumption in other industries has greater potential; thus, the proportion of urban gas in natural gas consumption structure is estimated to decline slightly The proportion of industrial fuels in the consumption structure of natural gas has dropped from more than 50% in 90 s to current about 31%, but this downward trend will not continue. This is due to the accelerating substitution of natural gas for the high carbon emission and pollution energy types especially coal. Although the proportion of secondary industry in the industrial structure is showing a downward trend, the proportion of natural gas in the energy consumption structure is increasing rapidly; thus, the proportion of industrial fuel in the natural gas consumption structure is expected to increase slightly. Several disadvantages of natural gas chemical production include limited demand for natural gas chemical products and relatively easy substitutability of natural gas chemical products; for example, methanol can be obtained by fermentation of biomass. This suggests that the proportion of chemical gas consumption in the natural gas consumption structure will continue to decline. Natural gas power generation has many advantages, such as high efficiency, lower environmental pollution, short construction period, strong policy support and so on, which will further increase the proportion of natural gas generation in the natural gas consumption structure.
Scenario 5 assumed a greater decline in population growth than scenario 1, but natural gas consumption structure changes only a little. While scenario 6 assumed that the urbanization process is accelerated, finally bringing a rise of urban gas proportion in natural gas consumption structure from 37.6% to 39.2% by 2035. This change in amplitude is relatively large. The two different population policies, controlling the total population and changing the population structure, will bring about an enormous difference in the natural gas consumption structure. Accordingly, speeding up the process of urbanization can effectively increase the proportion of urban gas consumption in the total natural gas consumption. The improvement in natural gas utilization technology and the acceleration of urbanization have opposite impacts on the natural gas consumption structure.
5 Conclusions and policy implications
Based on the synthetic consideration of population growth, economic development and technology progress, this study establishes China’s natural gas demand model by means of system dynamics method, to forecast the consumption, the net imports, degree of dependence on foreign natural gas, and CO2 emissions of natural gas during 2016–2035. Then, we set 7 scenarios through changing the variables in the model to explore the influencing factors on the total demand and consumption structure of natural gas. Finally, we came to the following conclusions:
-
(1)
Both production and consumption of Chinese natural gas in future will increase rapidly, but due to the limitation of recoverable reserves, the growth rate of natural gas production begins to decrease after 2023, and the production growth slows down. The Chinese economy will continue to grow in the future, and people’s living standards will improve steadily, which will result in a sustained increase in demand for natural gas. When the inflection point of net imports is crossed, natural gas imports and the degree of dependence on foreign natural gas will increase constantly.
-
(2)
The sensitivity analysis of the influencing factors on the total consumption and consumption structure of natural gas in different scenarios indicates that economic development still plays a major role in promoting the growth of natural gas consumption. In addition, the accelerating urbanization process impacts obviously on the demand for urban gas, while the promotion of natural gas utilization technology can effectively reduce the total natural gas consumption.
These conclusions have important policy implications. Firstly, to face the severe challenge of China’s gas security, China should establish sound laws and regulations system to regulate the gas market and provide a fair and dynamic investment environment, and strengthen cooperation with multiple other countries in natural gas trade to dilute potential supply risks. In addition, China should develop energetically clean renewable energy to replace natural gas in some consumption areas, such as developing jointly wind, hydroelectric and photovoltaic power generation. Finally, China should build a market-oriented price mechanism of natural gas to ensure the healthy development of the natural gas industry.
References
BP. BP World Energy Outlook 2017 edition. 2017. https://www.bp.com/content/dam/bp/en/corporate/pdf/energy-outlook-2017/bp-energy-outlook-2017.pdf.
Cai F, Zhang CW. Green book of population and labor: reports on China’s population and labor, vol. 16. Beijing: China Social Sciences Academic Press; 2015 (in Chinese).
Chen HT. Model and forecasts of China’s oil demand system based on system dynamics. Stat Decis. 2010;20:98–101. https://doi.org/10.13546/j.cnki.tjyjc.2010.20.028 (in Chinese).
Chen YQ, Hu JG, Zhang DJ. Derivation of logistic model and its self-regression method. Xinjiang Pet Geol. 1996;17(2):150–5 (in Chinese).
Cooper RN, Xu J. Prospects for the world economy in 2035. Northeast Asia Forum. 2015;1:118–26. https://doi.org/10.13654/j.cnki.naf.2015.01.001.
Department of Economic and Social Affairs, United Nations. World Population Prospects 2017. 2017. https://esa.un.org/unpd/wpp/Download/Standard/Population.
Department of Energy Statistics, National Bureau of Statistics. China Energy Statistics Yearbook. Beijing: China Statistics Press; 2015 (in Chinese).
Höök M, Aleklett K. Historical trends in American coal production and a possible future outlook. Int J Coal Geol. 2009;78(3):201–16. https://doi.org/10.1016/j.coal.2009.03.002.
Hubbert MK. Energy from fossil fuels. Science. 1949;109(2823):103–9.
Li JM. China’s new normal in population and economy. Popul Res. 2015;1:3–13 (in Chinese).
Li W, Yang G. A study of the sustainable development of energy consumption in Shanxi province based on system dynamics. Resour Sci. 2010;32(10):1871–7 (in Chinese).
Li MY, Li K, Yu PL. The study of the forecast capability of the system dynamics model of Hubbert curve: based on the data of American oil production. Syst Eng. 2009;2:102–8 (in Chinese).
Li JC, Dong XC, Gao J. System dynamical modeling of natural gas consumption in China. Nat Gas Ind. 2010;4:127–9. https://doi.org/10.3787/j.issn.1000-0976.2010.04.031 (in Chinese).
Lin BQ. Electricity consumption and economic growth in China: a study based on production function. Manag World. 2003;11:18–27 (in Chinese).
Lin BQ, Wang T. Forecasting natural gas supply in China: production peak and import trends. Energy Policy. 2012;49:225–33. https://doi.org/10.1016/j.enpol.2012.05.074.
Lv T, Zhang MZ, Lei Q. Scenario analysis and forecast of India’s energy and coal demand based on system dynamics. Resour Sci. 2015;6:1199–206 (in Chinese).
National Bureau of Statistics of China. China Statistical Yearbook. 2016. http://www.stats.gov.cn/tjsj/ndsj/2016/indexeh.htm.
National Development and Reform Commission. The natural gas development plan in 13th Five-Year. 2016. http://www.ndrc.gov.cn/zcfb/zcfbghwb/201701/W020170119368974618068.pdf.
National Population and Family Planning Commission. 2007. http://www.nhfpc.gov.cn.
National Population Development Strategy Research Group. National population development strategy research report. Beijing: China Population Press; 2008 (in Chinese).
Qin ZJ, Guo LQ. Forecasting consumption of refined oil and natural gas in Sichuan province. Resour Sci. 2006;5:120–6 (in Chinese).
Reynolds DB, Kolodziej M. North American natural gas supply forecast: the Hubbert method including the effects of institutions. Energies. 2009;2(2):269–306. https://doi.org/10.3390/en20200269.
Shi LJ, Zhou H. Supply/demand safety analysis for natural gas in China based on system dynamics. China Soft Sci. 2012;3:162–9 (in Chinese).
Sun JC, Lv D, Wu F. The simulated system dynamics analysis of natural gas supply and demand. Kybernetes. 2010;39:1262–9. https://doi.org/10.1108/03684921011063547.
Tan LL. SD model of the coal demand in the electricity industry. Syst Eng Theory Pract. 2009;29(7):55–63 (in Chinese).
Tang X, Zhang BS, Deng HM. Forecast and analysis of oil production in China based on system dynamics. Syst Eng Theory Pract. 2010;30(2):207–12 (in Chinese).
Tong HF, Yang Y, Wang JY, et al. Modeling China’s green economy 2050: scenario analysis based on the system dynamics model. China Soft Sci. 2015;6:20–34 (in Chinese).
Wang QF. System dynamics. Beijing: Tsinghua University Press; 1994.
Wang T, Sun CW, Li XH. Forecast of natural gas supply and price reform in China. J Financ Res. 2012;3:43–56 (in Chinese).
Wang JL, Feng LY, Zhao L, Snowden S. China’s natural gas: resources, production and its impacts. Energy Policy. 2013;55:690–8. https://doi.org/10.1016/j.enpol.2012.12.034.
World Bank, Development Research Center of the State Council. China in 2030. Beijing: China Financial and Economic Press; 2013 (in Chinese).
Xu G, Wang WG. Forecasting China’s natural gas consumption based on a combination model. J Nat Gas Chem. 2010;19(5):493–6. https://doi.org/10.1016/S1003-9953(09)60100-6.
Yang RG, Fan Y, Wei YM. System dynamics analytic model for coal supply and investment. J Appl Stat Manag. 2005;5:6–12 (in Chinese).
Yang YP, Yang ZP, Xu G. Situation and prospect of energy consumption for China’s thermal power generation. Proc CSEE. 2013;23:1–11. https://doi.org/10.13334/j.0258-8013.pcsee.2013.23.005 (in Chinese).
Yin JC, Liu ZB. Study of a prediction model of gas demand self-adapting optimization combination. Nat Gas Ind. 2004;24(11):167–9 (in Chinese).
Zhao Y, Ceng ZG, Chen ZH. Acquiring the large energy system outlook and promotion of sustainable development of energy. Econ Geogr. 2001;6:749–52 (in Chinese).
Acknowledgements
The work was financially supported by the National Natural Science Foundation of China (Grant Nos. 71273021 and 7167030506). This support is gratefully acknowledged.
Author information
Authors and Affiliations
Corresponding author
Additional information
Edited by Xiu-Qin Zhu
Rights and permissions
Open Access This article is distributed under the terms of the Creative Commons Attribution 4.0 International License (http://creativecommons.org/licenses/by/4.0/), which permits unrestricted use, distribution, and reproduction in any medium, provided you give appropriate credit to the original author(s) and the source, provide a link to the Creative Commons license, and indicate if changes were made.
About this article

Cite this article
Mu, XZ., Li, GH. & Hu, GW. Modeling and scenario prediction of a natural gas demand system based on a system dynamics method. Pet. Sci. 15, 912–924 (2018). https://doi.org/10.1007/s12182-018-0269-3
Received:
Published:
Issue Date:
DOI: https://doi.org/10.1007/s12182-018-0269-3