
Abstract
There is growing evidence that official population statistics based on the decennial census are inaccurate at the local authority level—the fundamental administrative unit of the UK. This paper investigates the use of locally available administrative data sets for counting populations. The method uses truth tables for combining different data sources with different population coverage according to a defined and therefore replicable set of rules. The result is timelier and geographically more flexible data which is more cost-effective to produce than a survey-based census. Associated techniques for linking diverse data sources at individual and household level are briefly discussed. The methodology is then applied to administrative data from a London borough with about 170,000 people. The results are evaluated and compared with other population sources. The paper concludes by discussing potential improvements including scaling up the work to cover multiple local authorities. The practicalities of using alternative central government data sets are briefly considered. A sequel paper in this journal provides examples of key applications of this approach at local level.
Introduction
There is considerable interest in the exploitation of administrative data to count the UK population instead of traditional methods based on a decennial census. This stems from the problem of population undercounting in parts of London and other English cities following the 2001 UK Census, the 10 year gap between each census that renders the results out-of-date as soon as they are published 2 years later, and the substantial cost of around £500 m over the 10 year cycle. These counts are used as the basis for subsequent annual Mid Year Estimates (MYE) between censuses and so contribute to a range of problems further down the line until the next census. In 2008, a House of Commons Treasury Committee report, noting that there had been substantial problems in generating accurate population estimates in some areas during the 2001 Census, declared population statistics to be ‘unfit for all purposes required’ (House of Commons 2008). In addition, users complain that the outputs are inflexible and unsuitable to support local level service planning and delivery (Westminster City Council 2002; Keohane 2008).
The demand for accurate population statistics dates back centuries to long before the first proper UK Census in 1841. In the 20th Century, this demand increased steadily, in large part due to the gradual transfer of powers, including control over funding, from local to central government over many decades in areas such as health and education, and social security. Although population statistics have a wide range of uses, it is only in recent decades that their accuracy has been recognized as a critical factor in certain applications. One of these applications is the formulaic basis for allocating money from the government to local authorities and key public services such as health.Footnote 1 Modern formula-based allocation methods are technically sophisticated, containing variables that are linked one way or another to population counts so that if these are inaccurate results will be skewed. Since the mid-1990s population statistics have acquired further uses in the governing of the country through the widespread growth in the use of targets for holding a wide range of public services to account. Targets are often expressed as ratios with population as the denominators and the function or activity of interest in the numerator (e.g. the percentage of adults who are economically inactive).
Although the new Coalition Government (2010) has now abolished targets, the ‘target culture’ became pervasive under Labour (1997–2010) with hundreds of examples drawn from areas as diverse as law enforcement, education, housing, employment, health, social services and waste disposal. However, if anything the Coalition has increased the demand for local data due to the onus on public services to make themselves more transparent to consumers. This is expected to add to the already growing range of other applications at sub-local authority level in which accurate population counts are needed to effect policy, ensure value for money and be more accountable to citizens. The problem is that many of the claims promulgated for service improvements are based on local population statistics that are spurious at best because of the poor quality of the data.
These issues have become even more pertinent subsequent to this research being completed with the announcement in July 2010 of the intention to scrap the census in its existing format, deeming it as ‘an expensive and inaccurate way of measuring the number of people in Britain’ (Hope 9th July 2010). Long before this announcement however, recognition of these issues led Mayhew Harper Associates to adapt their data linking ‘Neighbourhood Knowledge Management (nkm)Footnote 2 technique to count whole populations for local authorities. This technique utilises existing administrative data available in all local authorities and primary care trusts (PCTs) at the household level, thereby offering a population count alternative which is similar in principle to ‘Population Registers’ that are found in Nordic and other countries.
In this paper, we describe a methodology for combining local administrative data sets to create a population count using a formal system of logic to ensure reliability, established on a rule-based sequence of truth tables. In a practical application of the methodology, we show that the administrative data methodology figures are consistent with other administrative data sources such as Child Benefit and state pension counts. Because it is quicker to do than a census, data derived from this process are timelier than the census conducted by the Office for National Statistics (ONS). The process is more economical than a full census because it does not involve labour intensive and costly surveys, and therefore can be repeated frequently. However, the approach does not rule out the use of smaller scale surveys where this would supplement data derived from administrative data or other sources. The end product is not identical to the census, but it produces core demographic data by individual and household that in practical terms can be linked to a wide range of other administrative data.
By working at a household level, the flexible and granular output obtained provides greatly improved local planning intelligence (e.g. flexible spatial units, household demography and type of household). However, in the absence of consistent unique personal identifiers in the UK, data matching techniques are required, both for names and addresses. We find that quality improvements to the input administrative data (e.g. improved addressing) would lower the methodology’s data matching requirements and reduce the number of residual unmatched records. Individual local authorities could use these techniques to provide a population count to be fed into a national system. However, certain procedures would need to be put in place to cover the whole country. We will describe how commonly available administrative data sets available at local level can be used to count populations for local authority areas. Our findings are split into two papers, both published through this journal.
This first paper focuses on describing the methodology, understanding its merits and the contribution it can make to counting populations more accurately and at lower cost. It considers the nature and the strengths and weaknesses of key locally available administrative data sets and how they may be joined in such a way as to produce a replicable, credible and verifiable data set that is accurate at local level. The following sections provide further background, describe the data sources and explain the methodology; a worked example using actual data is evaluated and a discussion section at the end briefly considers wider issues of implementation and data access. Key strengths of the present approach lie in the applications which go far beyond what is possible with official population statistics, and which can be performed more quickly, accurately and with fewer resources. The second paper (Harper and Mayhew 2011), elsewhere in this journal, provides details and examples of applications using these new data sources and contrasts them with existing sources and uses.
Background
Concerns about the accuracy of population figures have been prominent in debates about statistics, for example whether national level figures derived through a census of the population are acceptably accurate at a local level (Cook 2003). It is accepted that for areas in population flux the figures are more problematic and therefore less acceptable at local authority level (House of Commons 2008). Increasingly however, local policy makers are demanding an understanding of their populations in a more disaggregated, local context in order to better understand their local needs (Freedman et al. 2008; Keohane 2008). The 2001 UK Census showed that it had not been possible to capture all addresses where people live and so coverage was incomplete even before postal survey forms were dispatched (the first ever census in which they had been used).
Substantial under-counting was also the result of low response rates to the postal survey, particularly in inner city areas. Well publicised cases of this included the cities of Manchester and Westminster (Bowley 2003; Statistics Commission 2004). The consequence of these shortcomings was that imputation techniques were needed to fill assumed population gaps. Although the 2011 Census preparation process has taken steps to overcome the addressing problem, including a dedicated address register and huge input from local authorities to help identify hard to count areas and encourage local community support, it is evident that local authorities continue to be concerned about the possibility of low response rates (Central London Forward 2010; Pharoah and Hale 2007). Further specific criticisms of the census are that it is only carried out every 10 years and because the results are not published until 2 years later they are already out-of-date. From a user’s perspective, statistical outputs and geography are inflexible and do not align with local needs; the data cannot be linked to other data sets except in crude ways; and inter-census MYE population estimates are widely believed to be unreliable due to intervening population fluxes (House of Commons 2008 p23).
Redfern (1986, 2004), Ericksen and Kadane (1986) and Keohane (2008) concur with this analysis and point to the burden on the public and the lack of cost-effectiveness, with a typical census costing around £500 million over a 10 year cycle. According to Redfern the census is no longer appropriate in that people are more mobile with second homes and the concept of the ‘usual address’ is too fuzzy. Keohane agrees that Britain’s population is getting harder to count, due to second homes, inaccessible properties, complex residential structures, and migration and student populations. The Treasury Committee Inquiry was substantially in agreement with these points concluding that the 2007 Census test had shown that even well tried methods will be stretched to the limit by the nature of contemporary society (House of Commons Treasury Committee, 2008). Redfern (2004) proclaims that estimates of the national population need substantial revision and that a new census strategy is required. In particular, he sees the creation of a population register over a period of years as ‘probably the only chance to return to quality population statistics’ (p.222).
Replacing or enhancing the census of population with administrative data is one suggestion (House of Commons 2008 p41), whilst running an administrative data check in a sample of areas in parallel to the 2011 Census is another (Martin 2006). ONS’s position on the use of administrative data has varied over the last 10 years. In 2003, ONS recognised the need for change and improvement. This was envisaged as an ‘Integrated Population Statistics System’ (Office for National Statistics 2003a) that would combine census, survey and administrative data together into a person-level population statistics database to provide superior population counts, annual estimates and ‘Neighbourhood Statistics’ to replace the 2011 Census and beyond. This would build upon work already underway to develop a high quality address register, and be combined with a population register that included administrative data linkage. Since then, they have back-tracked from this position in favour of a traditional census in 2011, with no population register in sight. The use of administrative data would be primarily to improve migration data for the MYEs (Office for National Statistics 2009) and for the Census Coverage Survey. No parallel use of administrative data to the 2011 Census has been confirmed or a decision on how the traditional method will be replaced. The ‘Beyond 2011’ programme however is intended to assess the integration of existing and new data sources (Office for National Statistics 2010) to meet the new demands of population statistics.
The use of administrative data is not new. It has been experimented with since the late 1960s in the USA (Burghardt and Geraci 1980) and exemplified in existing population registers of the Nordic countries. A population register relies on administrative records as the primary source of census type statistics. This method was pioneered in Denmark in 1981 and utilises administrative data already held in the public sector and combines them by personal identification numbers for the census (Redfern 1986; see Finnish example in Myrskyla 1991 and others in Poulsen 1999). A population register may be limited in scope to how many people are resident in a country alongside basic demographic information such as age and sex, or it may be extended into a full ‘census’ in the sense that it also records more detailed socio-economic circumstances. For example, the Dutch Population Register has been available electronically since 1995 (de Bruin et al. 2004) and was used to carry out their full 2001 Census using this and other administrative data sets and surveys, reducing the cost from 300 million Euros to 3 million Euros (Nordholt 2005, p25). There are also other administrative spin offs; these include less administrative burden on the citizen, increased tax yields and reductions in the over-payment of benefits (e.g. see Redfern 1990; de Bruin et al. 2004).
Clearly, a population register is most effective where there are central files that contain the same consistent personal identifiers, where there is a supportive legislative framework, and where citizens notify the authorities of any changes. Unlike Scandinavian countries, the UK does not have the benefit of a single personal identification number that is fully universal (Redfern 1990). Because it covers all ages, the NHS numberFootnote 3 is the closest the UK comes to this and would be undeniably useful but only if it can be accessed for statistical purposes. While much data are available in government departments that could be used as a basis for a national count, there has been relatively little progress in accessing these data, although following the Statistics and Registration Service Act of 2008, this situation has begun to improve by allowing removal of many legal barriers to data sharing between public authorities and the UK Statistics Authority for statistical purposes.
In our methodology, we use only local readily available administrative sources whose use for statistical and research purposes has been agreed under the Data Protection Act of 1998 and sanctioned by local data owners. These data sets are in use at a local level for a variety of purposes such as tax collection and registration and are part of a national system that is replicated in all local authorities. Of course, it would be even more preferable if data sets such as those held in different government departments were also to be made more available. In line with its desire to make government more transparent in future, the Coalition Government’s programme states that, ‘Setting government data free will bring significant economic benefits by enabling businesses and non-profit organisations to build innovative applications and websites’ (HM Government 2010). However, whether the data that are released would be suitable for population estimation purposes is unclear at this stage, since much depends on the level of detail that they are prepared to release.
Data Sources
Whilst administrative data sets and registers at the household level may be a viable source for capturing the population, the data need to be linked and analysed systematically before they can be used for statistical purposes. Local authorities and health trusts hold a wealth of such data on their local populations that can have added value by linking them together and using them in this way. Typical universally available data sets at a local level in the UK are listed in Table 1. These should be considered the basic minimum but the list could be extended to include others especially those relating to special populations (e.g. students, armed forces, prisons, and people in institutions).
In the absence of one single comprehensive register that captures the entire local population, combining these different sources is essential to maximise coverage. However, each data set has strengths and weaknesses. Combining them becomes a key part of the process in order to remove people that have moved away, are duplicates, or have died. It is hence extremely important to understand the basis for information held in administrative data sets before administrative data can be used successfully. The GP Register, for example, is the most comprehensive of these data sets because it records the majority of a population and contains age and gender information. Its compilation is illustrative of the detailed considerations that need to be factored in when using it for population counting.
The General Practice (GP) Register is based on the right of everyone living in the UK to register with a GP based solely on residency and not citizenship or payment of taxes. However, patients must only be registered with one practice at any one time and generally need to reside in the UK for more than three months. However, there are several issues to be considered before the GP Register can be used successfully for population counting. For example, a patient is expected to notify a GP of a change of address, but since there are lags in the system of re-registering upon moving to a new area, some records may contain the wrong address for a patient for a period. The net effect of this phenomenon is sometimes called list inflation (or deflation), i.e. when people who have moved (or have died) are not removed (for further amplification of the GP register see discussion section later).
Further considerations apply to other administrative data sets in the list. So, for example, the locally available school pupil census does not cover independent or private schools or pupils that are educated in neighbouring boroughs (unless local authority neighbours have data sharing arrangements); the electoral register only includes registered voters and only the edited version is publically available; the Council Tax Register is based on a single named person per taxable unit and not necessarily reflecting a whole or single household; benefits data contains only people eligible to receive benefits and so on. In addition, data sets such as the school census and electoral register are compiled at regular intervals whereas others such as Council Tax are updated daily.
Births and deaths data are different and these are supplied through the ONS via the local primary care trust. These contain information on all registered births and deaths in an area and can be used to verify whether a person on any of the other data sets has died or whether births have occurred that have not yet appeared on the GP register. The Local Land and Property Gazetteer (LLPGFootnote 4) serves a different purpose to the other data sets. Its purpose is to provide a base set of addresses to which people can be assigned and provide standardised address formats and labels known as UPRNs (Unique Property Reference Number). These are the common denominator which we use to link data sets together via the address as the core unit of analysis.
There are other address registers available but the LLPG is the most convenient for local authority users because it is created and updated internally and is freely available to them. It also contains other useful information such as when a property was registered and the use of the property (e.g. residential or commercial). Differences between address sources are well documented (see Office for National Statistics 2007) and no one source is able to capture all properties. A ‘super’ address register using available sources is being constructed for use by the ONS in the 2011 Census, but we understand it will not be made available to local authorities, who will continue to rely on their LLPGs.Footnote 5
Methodology
In comparing information held on different administrative data sets, it is necessary to conceptualise how the information may be categorised. For example, a person may be on one data set and not on another; a person may have a valid address that can be identified on the LLPG or the address may be invalid (the road or house number does not exist) or only partial (a house number may be missing). A person may not be on any of the data sets and is therefore ‘invisible’ for enumeration purposes. Figure 1 is a Venn diagram representing each possible circumstance a record may fall into based on the combination of the three main administrative data sources. In our methodology, we aim to confirm as many people as possible who are current at an address; by definition ‘invisibles’ are uncountable and so it follows that the more data sets that can be used the better the chance of enumeration in this regard.

Simple Venn diagram partitioning different categories of administrative data with and without addresses
In combining the data sets in Table 1, we need the methodology to be systematic and rule based so that all assumptions are transparent and therefore replicable. The stages are set out in a series of truth tables to represent how all the data sets are incorporated to create a single final population count and database. Truth tables employ Boolean algebra which can be implemented in freely available software to test whether a logical expression is true or false for all legitimate input values (e.g. Lipschutz 1998, Chapter 10). These express when a person should be classified as a current resident at an address or not, based on the binary combination of the relevant factors relating to them from the input data sets.
Prerequisites are that the datasets are all current at the same snapshot in time, that there are no duplicate people on the same data set, and that every address is represented by a UPRN from the property gazetteer. Each residential address (UPRN) on the property gazetteer is regarded as a household unit and current residents for each one counted. In summary, the methodology address matches each data set, takes the GP Register as the base, then cross-references the data sets by UPRN to assess who is current at each address, finally adding extra births and removing deaths. Sequential logical assumptions are used at each stage to determine who to include or exclude.
The logical connectives used in the logical expressions are as follows:
- ^:
-
and
- ν:
-
Or
- ¬:
-
Not
- →:
-
if-then
Table 2 is an example of the simplest kind of truth table based on the elements in Fig. 1. In Boolean terms, the combination of factors a and b and c in the logical expression (a ν b) ^ c can be represented in a truth table as in Table 2 in which ‘1’ represents the condition that a person appears on a, b or c and 0 that a person does not; a for example, might represent the GP register, b other data sets and c the LLPG. A person can be in any one of the seven categories shown in Table 2 and represented in the Venn diagram (the eighth category, row zero, is the ‘invisible’ category). A person is either accepted (‘A’) or rejected (‘R’) based on this simple example.
The rules used in the actual methodology are more involved and are applied in a series of stages with the outputs from one stage carrying forward to the next (see Fig. 2). Brief summaries of each rule are given in the boxes, together with the accompanying Boolean notational form. These rules are designed to ensure that any person identified at an address is current and can be verified, that duplicate persons are eliminated, and as many addresses as possible are filled with confirmed people. Each variable is defined in the column to the right of Fig. 2, so for example r, ‘assigned UPRN’, means that a person has been identified as having a valid address.

Summary of population count methodology stages
The first stage is to ‘clean’ the GP Register, that is, to determine who on the GP Register can be classified as current residents at UPRNs and so can be included. The rules take account of whether a person is the latest at a given address or if not, if a person is related to someone by name to someone that is current; the cut off for children and young adults is taken to be 20. The next stage of processing the GP Register is to identify who can definitely be excluded, that is, who no longer lives at an address and are part of any list inflation. The third stage is designed to fill in any gaps in the population not covered by unused records. The fourth and final stage is a last check aimed at filling in gaps that the other data sets have not been able to fill and to remove people who have died but have not yet been removed from other data bases. The end result is a data set, which we define as the ‘minimum confirmed population’ according to the rules of the algorithm, with each record representing a confirmed current resident, their age and sex and UPRN. The route to confirming a person as a current resident and therefore ‘confirmed’ is summarised in Fig. 3.

Pathway to determine if a person is a current resident at a UPRN or not
Residuals
Residuals are defined as records that have not been able to be included or verified. They are an important indicator of the completeness of the methodology, and are represented in the simple example in Table 2 in rows labeled ‘R’ (rejected). Each circle in Fig. 1 corresponds to the three main elements of the methodology—the GP Register, the property gazetteer (i.e. a record can be assigned a UPRN) and all other data sets. Categories 4, 6, 7 are part of the confirmed population if they meet the stated criteria, i.e. they are labeled ‘A’. Categories 1, 2, 3 and 5 are not part of the confirmed population and are instead treated as residuals.
The number of residuals tends to rise with the number of data sets used and so is not of itself a measure of matching success, but is more an insight into the compilation of the individual data sets. Residuals consist of data set records for people who were not able to be assigned a UPRN, records for people who were assigned a UPRN but were not confirmed as current residents, and also duplicate records across the data sets for any of these aforementioned people, because people are liable to be present on more than one data set. The main sources of residuals are records which cannot be assigned a UPRN. Therefore techniques designed to decrease the number of residuals through the correct assignment of addresses are required. Residuals are not immediately discarded but can be evaluated to examine why they have been created and strategies developed for dealing with them. Note that those who are homeless but on a data register recorded as living at ‘no fixed abode’ or at e.g. their local GP surgery, are considered residuals because they cannot be assigned a UPRN. However, they can be separated out and quantified if necessary.
Figure 4 is a flow diagram summarising the residuals and possible changes to how they are handled. Colour shaded boxes refer to the corresponding Venn category in Fig. 1. Boxes in black summarise what actions could be taken to reduce or include the residual records. For example, where a person is not included because they are not recorded on the existing input datasets, the suggested revision is to access other datasets that such a person may be recorded on. Residual sources are grouped together at the end to form a possible population ‘extension’ to indicate the range of uncertainty in any count.

Residuals and possible remedial actions
The total number of residuals is the theoretical absolute maximum the confirmed population could be extended by, and the actual number of these that should be added is unknown and could in fact be zero. In practice many could be duplicates of other records that have been confirmed but could not be matched due to spelling or other differences. It is for these reasons that the final result is called the ‘minimum’ confirmed population, but the theoretical maximum will always be uncertain due to reasons that can frequently be traced to quality issues within the source data.
Evaluation of Results
In testing the accuracy of any administrative count, it is important to recognise that there is no single gold standard against which estimates can be compared. Instead, a number of ‘reasonability’ checks are carried out on the final population count to ensure that the results are sensible, taking into account timing and definitional differences. The best sources, if possible to obtain, are often those which involve financial transactions or transfers of one kind or another (e.g. benefit or pension payments) since these are arguably more likely to be accurate. In addition, accuracy also needs to be considered in relation to why a population count is needed. For example, is it to assess the need for public transport or the number of state school places? The relevant population could be very different in each case.
Obviously, sources should be contemporaneous with the administrative snapshot where possible, although sometimes there may be a lag. Also administrative sources may be subject to changes of definition or eligibility as in the recent case of Child Benefit which was universal to the age of 16 but the Government is now intending to withdraw it from households with a higher rate tax payer. One can also use ONS MYEs or their equivalent such as Greater London Authority (GLA) estimates, although clearly there is a danger of circularity here since the purpose of an administrative count is to replace counts by other methods. However, their use for such purposes seems unavoidable until and unless they are replaced.
In practice, there are relatively few readily available administrative or other comparators, none of which is perfect and all of which are partial in coverage. Examples include:
-
Child Benefit numbers published by HM Revenue and Customs for children aged 0–16
-
State Pension claimants by males (65+) and females (60+)
-
Comparing the vacant UPRN rate with a local authority’s own figures or Council Tax records
-
UPRNs with high occupancy levels, greater than 9 people, are identified and checked for being multiple-occupancy
-
Comparison with other sources from contemporaneous snapshots e.g. ONS MYEs or GLA figures, if the local authority is situated for example in the London area
-
Number of children aged <16 without an adult at a UPRN is checked for possible explanations (e.g. parent or guardian is not on the GP register).
The question arises as to whether it is possible to create measures of confidence in estimates based on this approach using standard statistical methods and assumptions. In this regard different approaches can be envisaged. It is well known for example that the veracity of individual data sets varies both in completeness and coverage as well as accuracy, often in unknown ways. Sensitivity analysis can be undertaken by relaxing or varying certain assumptions in the methodology or by systematically adding or removing data sets; however, the approach which we find makes most practical sense is to split up the population into groups with strict rules of association and assigning labels such as ‘confirmed’ or ‘probable’.
Small surveys can then be undertaken to assign probabilities to a sample of members in each group to establish whether they should be included or not, with a given level of statistical confidence; in theory, these could piggy-back on other routine surveys, for example housing or health and life style surveys and we have some experience of this. Although we have not designed and conducted such a survey ourselves, we are aware of at least one occasion of where our data was used by local emergency services to check on people living in streets that had been severely impacted by a small localised tornado. Although hardly a model on which to build, the feedback we received was that the data were the most accurate they had ever seen!
Matching Algorithms
Thus far, we have said little about the data matching process itself which comprise the techniques needed to link people to addresses and between data sets. In an ideal world, each record on every data set would have one or more unique identifiers and so matching would be straight forward, e.g. a person identifier such as a national insurance number, NHS number, and a UPRN. In practice, the GP register is the only data set to have a unique person identifier in the form of the NHS number. The Local Property Gazetteer has UPRNs for each address and the School Pupil Census a UPN or Unique Pupil Number, but this covers only a narrow age range.
With the cancellation of the planned national identity card system, it is unclear whether there will ever be a universal basis for uniquely identifying individuals or a citizen’s index that could be used as a basis for a population register. Councils typically match council tax information to the UPRN, but matching records to UPRNs is still not common practice across other data sets. This means that we must resort to other methods of matching people either to addresses or to each other until other solutions are found. Since data sets may comprise many thousands of records, it is important that the matching process should be automated as far as possible, but also that the processes should also be accurate.
Data sets are variable in their quality and standards of completion. With addresses, the same address can be captured in varying ways either through data entry mistakes, misspelling or the existence of aliases. With individuals, sources of error are variations in spellings, data coding and preparation, use of name synonyms and nicknames, Anglicisation of foreign names, double-barrelled names, cultures that commonly incorporate the same title in the name, e.g. Singh or Kaur, use of initials, truncation and abbreviation, forename and surname swapped round, missing words and extra words (Gill, 2001). Dates of birth may not be reliable either; the day or month may be substituted with a default value if it is not known, or have a character entered incorrectly.
A crucial consideration is that different data sets may be collected for different purposes, and so were not designed for easy, accurate matching. Matching methods therefore need to reflect this and algorithms must recognise common differences and formats. While these algorithms are suited for matching local administrative data, the processes can become very technical and there is a substantial literature on record linkage that goes into more detail (Ericksen and Kadane (1986), Winkler (1995), Gill (2001), de Bruin et al. (2004), Jenkins et al. (2008), Office for National Statistics (2010a)). In our approach the two main categories used in record linking are address matching and person matching, as described below.
-
1.
Address Matching
For the purpose of the population count, every data record needs an address to act as a proxy for a household and to be used as the unit for capturing current residents. To ensure that the correct match is identified across data sets, the addresses are standardised by finding each address in the available property gazetteer and representing each with its unique property reference number (UPRN) on the data base. A purpose-built address matching algorithm has been designed to do this.
Unavoidably, a small percentage of addresses will remain that cannot be matched in this way. These tend to be formatted so differently from the gazetteer version that they need to be processed manually to choose the correct match. This is facilitated in our methodology by a semi-automatic process with manual over-ride. If after this a UPRN can still not be confidently assigned, the record becomes a ‘residual’ as defined and discussed in the previous section.
A record is designated a residual due either to the address being outwith the study area, the address is missing a vital discriminatory piece of information, usually the SAON (Secondary Addressable Object Name), the address contains a SAON that has not yet been recorded in the gazetteer, or the address is too ‘noisy’ or incomplete to assign a match with any confidence. Figure 5 sorts these cases into five categories (0 to 4) and suggests solutions to improve UPRN assignment for each as matching proceeds. For example, for addresses that contain a SAON (usually a flat number) that is not recorded in the property gazetteer, but the PAON (Primary Addressable Object Name, usually the street number and name) does exist, a ‘dummy’ UPRN will be generated.
Fig. 5 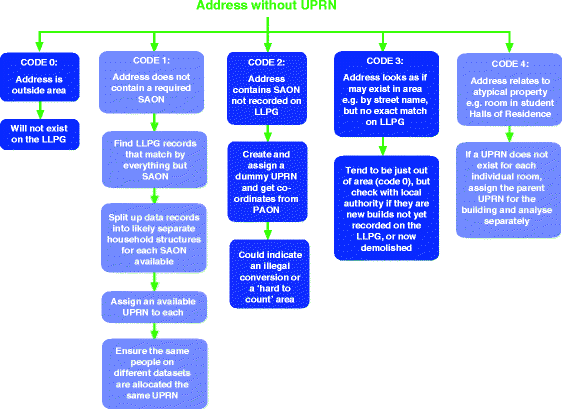
Extended UPRN assignment flow chart. Key: SAON = Secondary Address Object, PAON = Primary Address Object
-
2.
Person Matching
Person matching is used in the population count to ensure that the same person is matched across multiple data sets, particularly between the GP Register and other data sets. There is no single unique person identifier on the data sets to allow full exact matching, so a technique is employed using the forename, surname and date of birth fields. Gill (2001) and others review the issues in person matching and our methods entail similar considerations; however, we note in passing that effective person matching techniques will become critical as the value of linking administrative data is increasingly recognised and if future censuses are to be constructed in this way. In particular, names can offer clues to a person’s nationality or ethnicity especially when used in combination with a range of administrative data sources. We exploit this property in applications of our methodology (not discussed here).

A Worked Example
The methodology is now illustrated by means of the following case study which is based on the London Borough of Barking and Dagenham and uses an administrative snapshot date taken at 30th September, 2008. In this case, the UPRN assignment rate to addresses in the data sets was very high at around 98%, and so it was possible to include practically all available data records in the analysis. A summary of the audit trail for this case study is given in Table 3 based on each of the stages in Fig. 2, in which the confirmed additions to the population for each of the four stages are shown and also the numbers of records eliminated. It shows that the final population count obtained was 171,851 people.
For this case study, reasonability checks using data available at the time yielded the following results:
-
□ 44,258 children aged 0–16 were counted, compared to 44,985 on Child Benefit August 2008 (source: HMRC)
-
□ 7,492 males aged 65 and over compared to 7,830 males aged 65 and over claiming state pension as at August 2008 (source: DWP)
-
□ 13,915 females aged 60 and over compared to 14,050 females aged 60 and over claiming state pension as at August 2008 (source: DWP)
-
□ 23,801 single occupancy UPRNs compared to 20,720 on Census 2001
-
□ Vacant UPRN rate = 3.9% compared to 2.8% from Valuation List March 2008 (source: Communities and Local Government)
-
□ 152 UPRNs of the 68,247 allocated UPRNs have > nine people, covering 1,829 people in total
The population count of children 0–16 is less than the 2008 Child Benefit count by only 727. The counts of males aged 65+ and females aged 60+ are 338 and 135 less respectively than state pension counts at August 2008. Hence, these two comparators suggest that the administrative count may slightly understate the population in these two age bands, assuming that the pension and benefit counts to be accurate and contemporaneous. The number of single occupancy households is higher than the Census 2001 count, but it is not implausibly different given the timing differences between snapshots. The vacant UPRN rate of 3.9% is 1.1% higher than the 2.8% given for March 2008 for the number of vacant dwellings and second homes as a percentage of total number of dwellings on the Valuation List. However, this difference can be explained by timing and definitional differences, for example when records are added after a property is built differ on the LLPG and the Valuation List.
It is assumed that any UPRN with more than nine people in residence is potentially unusual and could indicate an error. Only 152 or 0.2% of the allocated UPRNs are affected by this, and all were checked for possible explanations. Approximately 40 of the people affected are in UPRNs known to be hostels and a further 319 in addresses that are obviously care homes. The highest occupancies of any UPRN, 28 to 61, are in these properties. The remaining cases are distributed across normal residential addresses with occupancy predominantly in the lower ranges of 10 to 15 (see Fig. 6). This very small number and the fact that many are genuinely multiple occupancy properties again indicate that the results are capturing legitimate household structures. This could be further refined and validated by obtaining the maximum capacities of known multiple occupancy addresses (e.g. hostels).

Distribution of high UPRN occupancy levels resulting from the case study
Numerous other checks are possible, including for example the number of households in which there are children but no adults. Few in number, these cases can arise where the child occurs on a data base but not the parent or guardian, e.g. an adult who is unregistered with a GP or is not the person responsible for paying council tax, etc. Based on the experience of other case studies, such checks provide confidence that the results are reasonable; however, it is always useful to consult local authority experts and analysts for further verification (e.g. in cases of recently demolished areas). Further comparisons may also be undertaken with alternative sources of population estimates, although clearly there is danger of circularity—i.e. using external estimates to verify an administrative count which is in turn is being used to validate an external estimate.
The external estimates available are the ONS MYEs or GLA figures, if the authority is situated in the London area. It is possible to envisage a number of different checks against these sources, for example comparison by age band, or at sub-authority level, such as ward or Super Output Area level (note that a comparison at a household level is not an option using GLA or ONS sources). We illustrate our findings with a comparison by 5-year age band as shown in Table 4. In constructing the age bands using administrative data, it is necessary to take into account a relatively small number of confirmed records for which there is no date of birth, no gender, or both. Since it is possible to establish that many of the ‘age-unknowns’ fall into the adult age range, it is relatively straightforward to devise an arguably reasonable distribution of these among the relevant age groups to correct for this.
As Table 4 shows, the administrative population count at 30th September 2008 is higher than the original ONS MYE 2008 count of 168,853 by 2,998 persons. In May 2010, the ONS revised its MYEs for 2002 to 2008 to reflect improvements to methods and data sources on migration. The revised 2008 figures, only published in rounded form, have been included in column four of Table 4. Interestingly, the new count comes to 171,600, which is now only 251 less than the administrative count. However, it is worth drawing attention to the fact that the administrative count was produced and disseminated within 3-months of the snapshot date, as compared with the ONS revised count which took 2 years longer to produce an almost identical total figure.
The GLA publishes population projections for London boroughs. Unlike ONS it uses housing units in its methodology, taking into account expected future housing development in an area (Hollis and Chamberlain March 2009). The GLA 2008 low and high variants give counts of 167,475 and 172,400 respectively for Barking and Dagenham, with the higher variant designed to cope with higher anticipated migration assumptions. As is seen, the administrative count is within these margins, but closer to the higher variant. The same was true when we compared the administrative count with GLA 2009 estimates, namely that the administrative count lay between the low and high variants. The GLA’s revised 2008 figure of 171,976, shown in column five in Table 4, is only 125 higher than the administrative count, but again took 2 years to be published.
There are both similarities and differences between the counts for separate age bands for each source. The administrative count is lower than ONS for ages 0 to 4, although it is not completely clear why this should be so since both GP and birth registrations are considered reliable sources. Higher administrative counts are found in the 5–9, 20–25, 35–39 and 55–59 age groups and we have generally found this to be the case in other areas we have used this methodology, especially in London (e.g. see Mayhew and Harper 2010). Reasons for this are necessarily speculative to a degree and are probably methodological in origin rather than just timing differences. For example, other sources include a baseline based on the 2001 Census and thus are possibly distorted by low response rates and imperfect imputation at the time, and secondly, failing to account properly for migration.Footnote 6
Figure 7 is a chart summarising the differences between the administrative count and the three other 2008 sources by 5 year age band. In general, the administrative count is relatively higher in age bands up to 25, lower between 25 and 35 than either ONS or GLA; but at older ages the differences tend to be narrower. Any estimates in the age range 20 to 40 from whatever source must be considered less robust than in other age bands because this population tends to be hardest to count. Since the administrative data approach uses current data sources in general, it is arguably a more accurate reflection of the population dependent on or using local and other services. However, each methodology is clearly different, and so has to be taken on its own merits.

Chart showing the differences in estimates by age group between the administrative count and ONS and GLA
The above comparisons demonstrate that each source is relatively close to each other with differences of less than 2% at the aggregate level, although the earlier availability of the administrative count makes it much more attractive from a user perspective. Larger differences became apparent when comparisons are made at ward level. We found that, based on all 17 wards in the case study, the percentage difference between the administrative count and ONS ranged from −12.9% to +8.2% with a root mean square deviation of 547 persons (average ward population is around 10,000). The same comparison using GLA 2008 (revised) figures at ward level gave slightly more extreme results, with percentage differences ranging from −17.9% to +8.1% and a root means square deviation of 621 persons.
Based on the 109 Lower Super Output Areas (LSOAs), the percentage differences between the administrative count and ONS were considerably higher, ranging from −37.7% to +15.2% with a root mean square deviation of 138 persons (the average LSOA population in this local authority is around 1,600). Clearly, these results are based on one London borough and may not be generalisable; however, they suggest that even if population figures at local authority level are comparable from the three sources, the gaps at more disaggregate geographies are greater and potentially much more of a problem, depending on the type of intended application (see Harper and Mayhew 2011 for more discussion of this point).
In reaching these conclusions, it has been necessary to discard those administrative records that did not conform to the methodology. Table 5 contains a brief enumeration of the rejected categories (rows 1, 2, 3, and 5) for the case study as defined and set out in Fig. 1 and Table 2. In general, we observe that the quantity of rejects is reassuringly small in relation to the confirmed population count, but as previously noted their number tends to rise with the number of data sets being used. In this regard, every case tends to be different and so it is not easy to draw general conclusions as it depends on the quality and number of data sets.
The question arises as to which count is the most reliable. Since the administrative methodology relies on current actual data rather than synthetically adjusted counts from a census base that is over 10 years old, it is arguably more likely to be accurate. It is based on the current dwelling stock and households as well as current data that has been systematically validated and combined. In broad terms, administrative counts are better at capturing recent arrivals in an area and so tend to be higher in areas where there is greater population turnover. Is it always the case that the administrative count will be close to conventional estimates?
It may be argued that this particular London borough is more straightforward than others in the sense of not having a particularly complex population and thus is unable to provide a strong enough test for the methodology. A much tougher challenge was the London Borough of Tower Hamlets, also in east London. This has a large student population, is undergoing massive re-generation, and has many second homes among the many new developments. These factors contributed to Tower Hamlets having the highest property vacancy rate we have observed so far in any location at 7%. In addition, and partly as a result of these factors, we also found that 13% of the confirmed population was not registered with a GP, but are people that were indentified from other data sets. On this basis, we found that Tower Hamlets had an administrative population count that was 6.5% higher than the comparable ONS MYE as compared with only 1.8% in Barking and Dagenham.
Conclusions
This paper has made the case for utilising and linking local administrative data to count local populations. The method is current, has a turn-around of up to 3 months from the time the data are obtained, and can be carried out as frequently as desired. It also has the advantage of capturing people directly from extensive databases based on their presence at an address rather than relying on enumerating heads of households with postal surveys and depending on them to complete and return the forms. The value of the use of administrative data over surveys for empirical sociology is discussed by Webber (2009) and Burrows and Savage (2009).
Our research has tried to take this further and demonstrates innovatively how the problems associated with the onus being on the citizen to self-report and self-return a census survey can be bypassed. It represents a contribution to the debate of what should replace or improve the UK national census after 2011, but also addresses the strategic gap in good population intelligence at local level, which is stifling planning and stewardship of the considerable resources that are allocated centrally through grants to finance local services. Since we believe it will be some years before there is a more credible national system for counting, we consider that there is a strong business case for this methodology to fill the gap but acknowledge that it is also capable of further refinement and development.
Although the case study gave an administrative count that is similar to other estimates at a local authority level, this has not necessarily been the case in other local authorities and the example of Tower Hamlets was mentioned. Generally, we find that in London the differences between the administrative population count and official counts have been greater than in areas that are in less flux, even though in all cases the data sets used and methodology were the same. Nevertheless, it will always be difficult for any system to capture 100% of a population, because it depends in part on how a ‘population’ is defined.
More transient populations such as tourists and short-term (e.g. <3 month stays) migrants could theoretically be included with access to appropriate data; similarly, data can be appended for those serving in the armed forces and prison populations or living in institutions. A more sophisticated set of population accounts would subdivide a population into, for example: the usual resident population (i.e. whose main home is in the area), the day-time only population, with further subdivisions based on length of stay to distinguish short term visitors from migrants. However, to do this rigorously might require a politically unpopular system of population registration to underpin it.
One important sub-group is the student population because it inflates local populations in term time and deflates them out of term time. We take current residents as at a snapshot date so that if students are on databases at this date, they are included, but we would only be able to identify them as students if they lived in designated halls of residence. Access to HESA (Higher Education Statistics Agency) data would provide domicile and study addresses, which would improve identification and separate enumeration of students. In future, we support the idea that published figures will need to differentiate between a term time and out of term population for an area and look forward to working with HESA to provide the necessary data.
The paper has explained the crucial role of the GP register for population estimation purposes but it is not a panacea and a would-be user of the GP register needs to contend with the following issues. Comparison between the GP register and official population data sources for different ages generally show that there are more people on the GP register than in official population figures (especially in urban areas). However, for people in their 20 s, particularly young adult males, there can be fewer because they have not bothered to register. Foreign nationals such as diplomats or others who exclusively use private healthcare may also be absent from the GP Register, although the numbers involved are small and tend to be localised (e.g. in London boroughs such as Kensington and Chelsea).
The reverse is that there are people on other data sets (e.g. young male adults) that are not on the GP register but can be confirmed through other sources. Our methodology enumerates these, but it cannot identify people who are not on any of the common data sets (e.g. illegal immigrants). An easily overlooked group that are alive and living in an area but may not yet be registered with a GP are newborns. Several hundred may be involved, which is why we use the public health births register to fill the gap. Similarly people may not be removed from a register if they have died, but generally we find this to be much less of an issue (see also footnote (a) Table 3). We have already mentioned that in areas of high turnover and influxes such as Tower Hamlets, a relatively large percentage of the population is not registered but confirmed using other sources.
In theory, any additional data set could potentially improve population counts within the framework of our methodology, including some commercial data sets. Each data set needs to be included on its merits (e.g. the range of information captured such as date of birth and current address, population size and geographical coverage). These criteria would rule out many commercial data sets, but some such as loyalty card customer data may capture some people not on public data sets (e.g. new arrivals from abroad). The most useful data would therefore be sources that had the potential to fill gaps and were known to be of high quality; however, the most important barrier to obtaining access to such data sets for statistical purposes is their commercial confidentiality.
We have also considered, and to some extent have tested, the use of life style and other surveys. Assuming it is possible to access the addresses of respondents and that the survey is current, it is possible to compare demographic details such as number, age, and sex against corresponding administrative data. To date, however, we have found such surveys to be more useful as a means to extend the range of socio-economic variables in the output data base to include, for example, attitudinal variables rather than for counting people as such. In practice, this entails imputing the characteristics for other similar households based on respondents to a limited survey of perhaps only a few thousand households. However, such uses raise methodological issues that go beyond the scope of this paper.
There are several more strategic issues to consider in terms of the wider adoption of this approach. Implementing the methodology at a national level has not yet been attempted but can be considered as a matter of carrying out population estimations for each of the local authorities in England and Wales,Footnote 7 and then combining them. This would require consistency in the input datasets used in terms of snapshot date, coverage and quality, and an assumption that the methodology is a ‘one size fits all’. The present assumption is that local authorities could do this for themselves, initially with outside technical assistance, but with data improvements and access to the necessary algorithms, the processes could become more automated and enable scale economies; this is something that would be best done in stages involving geographically contiguous authorities to enable more efficient data pooling. We believe this to be more of an administrative issue than a technical one because it goes to the heart of local authority co-operation in the area of shared population intelligence and resources.
It is important to note that the approach uses person-identifiable data in the initial stages, but that the final data base is anonymised for statistical use. The use of data here has been approved under the 1998 Data Protection Act, but there remain multiple local interpretations by different data owners over the user of personal data for statistical purposes. This issue would need to be addressed if the aim were national coverage and would require government leadership, more clarity and less dithering. The normal arrangement is to create ‘safe havens’ that enable personal data to be linked and anonymised and packaged for statistical purposes in wholly non-person-identifiable formats.
If a national model was to be based upon the input of each individual local authority, and as an estimate, if an administrative data population count costs on average £100 k per authority, the total cost for the 348 authorities in England and Wales would be £34.8 m. However, this cost would fall in time following data quality improvements. This compares with the decennial census which costs £500 m over a 10-year cycle. In theory, it would therefore be possible to provide annual counts rather than decennial for the same or less money; however, this view needs to be tested further as there may be unforeseen costs in scaling up our approach (e.g. see Office for National Statistics 2003b).
A completely different business model would be to utilise the considerable data resources available to central government, especially those available through the tax and benefit system. Hitherto, that route has not been possible under present legislation. However, this could change, as the Government considers the future of the census (Hope 9th July 2010). The data sharing provisions of the Statistics and Registration Service Act 2008 is a potential model. Such a model would dictate a central rather than local led solution to population estimation, but it would also carry with it significant technical challenges and upfront costs not to mention haggling between departments over data ownership.
In our judgement, it will be several years for this to be achieved if it happens at all. Thus, it seems likely to us that local data sources will continue to play an important role in this regard simply because it allows local authorities to be in control of the data that they need for local planning rather than relying on central government to produce timely accurate data that meets local (as well as national) needs. In conclusion, this paper has demonstrated that administrative data is a viable and cost effective alternative to the current census method of counting populations. This topic continues into a second paper in which we consider how administrative population counts can be used in routine applications and combined with other data sets in potentially innovative and previously unchartered ways.
Notes
In health sector, the history begins in 1970 with the Labour Government’s Green Paper on NHS reorganisation which included a commitment to a new method of resource allocation. This led to the Crossman formula and then later to the RAWP formula in the same decade. For subsequent history see Thompson (2010).
See www.nkm.org.uk
The NHS or The National Health Service number is assigned at birth or when a person registers for the first time with a doctor (for example a foreign migrant).
A LLPG forms a central or corporate address list that provides a unique and unambiguous identifier for each entry in the gazetteer. This central address list will be made up from key Creating Authority service areas responsible for the official street naming and numbering and revenue collection processes. Additional Address Change Intelligence (ACI) is also introduced from other Local Authority statutory functions such as building control, planning and land charges which affect the real world objects included in the gazetteer (www.nlpg.org.uk).
It has been recently announced that the Office of Fair Trading (OFT) has given the green light to plans unveiled by Eric Pickles MP, Secretary of State for Communities and Local Government in December 2010, to create a definitive national address database for England and Wales. This will bring together addressing information from local government and Ordnance Survey. See www.nationaladdressgazetteer.co.uk.
Undercounts in the MYEs have led them to be declared ‘unfit for purpose’ (House of Commons Treasury Committee 2008, p3) for many areas.
We have ascertained that similar data sources are available in Scotland and so the same data sets and methods could be deployed there.
References
Bowley, G. (2003). The last census? Prospect Magazine, Issue 92. http://www.prospectmagazine.co.uk/2003/11/thelastcensus/
Burghardt, J., & Geraci, V. (1980). State and local annual population estimation methods employed by the Bureau of the Census. Review of Public Data Use, 8, 339–354.
Burrows, R., & Savage, M. (2009). Some further reflections on the coming crisis of empirical sociology. Sociology, 43, 762–772.
Central London Forward. (2010). Census coverage survey and imputation: Deliberative event. Meeting minutes, http://www.centrallondonforward.gov.uk/news/clf-census-event-7-october-2010/
Cook, L. (2003). A demographics statistics service for the 21st Century. Introductory covering letter. Office for National Statistics. http://www.statistics.gov.uk/about/methodology_by_theme/Dem_Stat_Ser_21ST_Cen.asp
De Bruin, A., Kardain, J., Gast, F., de Bruin, E., van Sijl, M., & Veneig, G. (2004). Record linkage of hospital discharge register with population register: Experiences at statistics Netherlands. Statistical Journal of the United Nations ECE, 21, 23–32.
Ericksen, E., & Kadane, J. (1986). Using administrative lists to estimate Census omissions. Journal of Official Statistics, 2(4), 397–414.
Freedman, M., Lane, J., & Roemer, M. (2008). New approaches to creating data for economic geographers. Journal of Official Statistics, 24(1), 133–156.
Gill, L. (2001). Methods for automatic record matching and linking and their use in national statistics. National Statistics Methodological Series, 25, London: Office of National Statistics.
Harper, G., & Mayhew, L. (2011). Applications of population counts based on administrative data at local level. Applied Spatial Analysis and Policy, (forthcoming).
HM Government. (2010). The coalition: Our programme for Government. http://www.cabinetoffice.gov.uk/media/409088/pfg_coalition.pdf.
Hollis, J., & Chamberlain, J. (2009). GLA 2008 round demographic projections. DMAG Briefing 2009–02, Data Management and Analysis Group, Greater London Authority, ISSN 1479–7879.
Hope, C. (2010). National census to be axed after 200 years. The Daily Telegraph. http://www.telegraph.co.uk/news/newstopics/politics/7882774/National-census-to-be-axed-after-200-years.html
House of Commons Treasury Committee. (2008). Counting the population. Eleventh Report of Session 2007–8, 1, House of Commons London: The Stationery Office Limited.
Jenkins, S., Lynn, P., Jackle, A., & Sala, E. (2008). The feasibility of linking household survey and administrative record data: New evidence for Britain. International Journal of Social Research Methodology, 11(1), 29–43.
Keohane, N. (2008). Local counts – the future of the census. New Local Government Network.
Lipschutz, S. (1998). Schaum’s outline of set theory and related topics. Schaum’s Outlines, 2nd edition.
Martin, D. (2006). Last of the censuses? The future of small area population data. Transactions of the Institute of British Geographers, 31, 6–18.
Mayhew, L., & Harper, G. (2010). Counting with confidence: The population of Waltham Forest. Report. http://www.walthamforest.gov.uk/index/community/wf-statistics/mayhew-report.htm.
Myrskyla, P. (1991). Census by questionnaire – census registers and administrative records: The experience of Finland. Journal of Official Statistics, 7(4), 457–474.
Nordholt, E. (2005). The Dutch virtual Census 2001: A new approach by combining different sources. Statistical Journal of the United Nations ECE, 22, 25–37.
Office for National Statistics. (2003). Proposals for an integrated population statistics system. Discussion Paper.
Office for National Statistics. (2003). Census strategic development review alternatives to a census: Linkage of existing data sources. Information Paper.
Office for National Statistics. (2009). A summary of administrative data sources and their potential to inform statistics on migration and population. Report.
Office for National Statistics. (2010). Feasibility linkage of births records to school census records. Report.
Office for National Statistics. (2010). 2009 mid-year population estimates frequently asked questions. Report.
Office for National Statistics Geography. (2007). Coverage of address registers for 2007 Census test, phase 1. Report.
Pharoah, R., & Hale, T. (2007). Behind the numbers: Migrant living patterns in Westminster. ESRO report.
Poulsen, M. (1999). Maintaining the quality of the registers used in the Danish census. Statistical Journal of The United Nations ECE, 16, 155–163.
Redfern, P. (1986). Which countries will follow the Scandinavian lead in taking a register-based census of population. Journal of Official Statistics, 2(4), 415–424.
Redfern, P. (1990). A population register or identity cards for 1992? Public Administration, 68, 505–515.
Redfern, P. (2004). An alternative view of the 2001 Census and future census taking. Journal of The Royal Statistical Society A, 167(2), 209–228.
Statistics Commission. (2004). Census and population estimates and the 2001 Census in Westminster: Final Report. Report number 22.
Thompson, G. (2010). Primary care trusts: Funding and expenditure. Standard Note: SN/SG/5719, House of Commons Library.
Webber, R. (2009). Response to ‘The coming crisis of empirical sociology’: An outline of the research potential of administrative and transactional data. Sociology, 43, 169–178.
Westminster City Council. (2002). Evaluation of accuracy and reliability of 2001 Census. Report, City of Westminster.
Winkler, W. E. (1995). Matching and record linkage. In B. G. Cox, D. A. Binder, B. N. Chinnappa, A. Christianson, M. A. Colledge, & P. S. Kott (Eds.), Business survey methods (pp. 355–384). New York: Wiley.
Acknowledgements
This paper is based on research for the ESRC UPTAP (Understanding Population Trends and Processes) programme. We acknowledge contributions from Sam Waples of Mayhew Harper Associates Ltd and thank Richard Verrall of Cass Business School and John Eversley of ppre CIC for their comments and support.
Open Access
This article is distributed under the terms of the Creative Commons Attribution Noncommercial License which permits any noncommercial use, distribution, and reproduction in any medium, provided the original author(s) and source are credited.
Author information
Authors and Affiliations
Corresponding author
Rights and permissions
Open Access This is an open access article distributed under the terms of the Creative Commons Attribution Noncommercial License (https://creativecommons.org/licenses/by-nc/2.0), which permits any noncommercial use, distribution, and reproduction in any medium, provided the original author(s) and source are credited.
About this article
Cite this article
Harper, G., Mayhew, L. Using Administrative Data to Count Local Populations. Appl. Spatial Analysis 5, 97–122 (2012). https://doi.org/10.1007/s12061-011-9063-y
Received:
Accepted:
Published:
Issue Date:
DOI: https://doi.org/10.1007/s12061-011-9063-y