
Abstract
Quantitative structure–activity relationship (QSAR) and quantitative structure–property relationship (QSPR) models predict biological activity and molecular property based on the numerical relationship between chemical structures and activity (property) values. Molecular representations are of importance in QSAR/QSPR analysis. Topological information of molecular structures is usually utilized (2D representations) for this purpose. However, conformational information seems important because molecules are in the three-dimensional space. As a three-dimensional molecular representation applicable to diverse compounds, similarity between a test molecule and a set of reference molecules has been previously proposed. This 3D representation was found to be effective on virtual screening for early enrichment of active compounds. In this study, we introduced the 3D representation into QSAR/QSPR modeling (regression tasks). Furthermore, we investigated relative merits of 3D representations over 2D in terms of the diversity of training data sets. For the prediction task of quantum mechanics-based properties, the 3D representations were superior to 2D. For predicting activity of small molecules against specific biological targets, no consistent trend was observed in the difference of performance using the two types of representations, irrespective of the diversity of training data sets.

For each value of QM8 and logD of Lipophilicity, RMSE values for the test data set using SVR models and 2D, 3D descriptors are reported

For each target, the numbers of training compounds against the diversities of training data set are reported

For each target macromolecule, RMSE values for the test data set against the diversity (similarity) of the training data sets are reported. Models were constructed using SVR. X-axis is the mean pairwise similarity for compounds in the training data sets

For each target macromolecule, RMSE values for the test data set using different molecular representations and kernel functions are reported. Shape_kernel + Color_kernel is represented by formula (1). Color*Shape is a hadamard product which use ColorTanimoto and ShapeTanimoto. Shape_kernel*Color_kernel is represented by formula (2)


In (a), RMSE values for the test data set against training data diversity are reported. Random and Code I represent randomly extracted and Code I reference compounds besides active compounds, respectively. In (b), only individual types of compounds were used without combining active compounds

NN-distance from a test compound, which could not be predicted, to reference compounds is provided. Both represents compounds that could not be predicted by the two methods being compared. Train_active_cpds_only represents compounds that could not be predicted using only active compounds. Random_only represents compounds that could not be predicted using only randomly selected reference compounds. Code I_only represents compounds that could not be predicted using only Code I reference compounds
References
Sippl W, Robaa D (2018) Applied chemoinformatics. Wiley-VCH Verlag GmbH & Co, KGaA, Weinheim
Rodríguez-Pérez R, Miyao T, Jasial S, Vogt M, Bajorath J (2018) Prediction of compound profiling matrices using machine learning. ACS Omega 3:4713–4723
Yuan Q, Wei Z, Guan X, Jiang M, Wang S, Zhang S, Li Z (2019) Toxicity prediction method based on multi-channel convolutional neural network. Molecules 24:3383
Todeschini R, Consonni V (2009) Molecular descriptors for chemoinformatics. Methods and principles in medicinal chemistry. Wiley-VCH Verlag GmbH & Co. KGaA, Weinheim
Kuz’min VE, Polishchuk PG, Artemenko AG, Andronati SA (2011) Interpretation of QSAR models based on random forest methods. Mol Inf 30:593–603
Rodríguez-Pérez R, Bajorath J (2019) Interpretation of compound activity predictions from complex machine learning models using local approximations and shapley values. J Med Chem. https://doi.org/10.1021/acs.jmedchem.9b01101
Kearnes S, McCloskey K, Berndl M, Pande V, Riley P (2016) Molecular graph convolutions: moving beyond fingerprints. J Comput Aided Mol Des 30:595–608
Jo J, Kwak B, Choi HS, Yoon S (2020) The message passing neural networks for chemical property prediction on SMILES. Methods. https://doi.org/10.1016/j.ymeth.2020.05.009
Cramer RD, Patterson DE, Bunce JD (1988) Comparative molecular field analysis (CoMFA). 1. Effect of shape on binding of steroids to carrier proteins. J Am Chem Soc 110:5959–5967
Sato T, Yuki H, Takaya D, Sasaki S, Tanaka A, Honma T (2012) Application of support vector machine to three-dimensional shape-based virtual screening using comprehensive three-dimensional molecular shape overlay with known inhibitors. J Chem Inf Model 52:1015–1026
Hu B, Kuang ZK, Feng SY, Wang D, He SB, Kong DX, Hu B, Kuang ZK, Feng SY, Wang D et al (2016) Three-dimensional biologically relevant spectrum (BRS-3D): shape similarity profile based on PDB ligands as molecular descriptors. Molecules 21:1554
ROCS version 3.2.2.2; OpenEye Scientific Software Inc, Santa Fe, NM.
Hawkins PCD, Skillman AG, Nicholls A (2007) Comparison of shape-matching and docking as virtual screening tools. J Med Chem 50:74–82
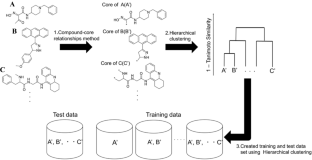
Miyao T, Jasial S, Bajorath J, Funatsu K (2019) Evaluation of different virtual screening strategies on the basis of compound sets with characteristic core distributions and dissimilarity relationships. J Comput Aided Mol Des 33:729–743
Hu G, Kuang G, Xiao W, Li W, Liu G, Tang Y (2012) Performance evaluation of 2D fingerprint and 3D shape similarity methods in virtual screening. J Chem Inf Model 52:1103–1113
Bento AP, Gaulton A, Hersey A, Bellis LJ, Chambers J, Davies M, Kruger FA, Light Y, Mak L, McGlinchey S, Nowotka M, Papadatos G, Santos R, Overington JP (2014) The ChEMBL bioactivity database: an update. Nucleic Acids Res 42:1083–1090
Naveja JJ, Vogt M, Stumpfe D, Medina-Franceo JL, Bajorath J (2019) Systematic extraction of analogue series from large compound collections using a new computational compound-core relationship method. ACS Omega 4:1027–1032
Wu Z, Ramsundar B, Feinberg EN, Gomes J, Geniesse C, Pappu AS, Leswing K, Pande V (2018) MoleculeNet: a benchmark for molecular machine learning. Chem Sci 9:513
Ramakrishnan R, Hartmann M, Tapavicza E, Lillienfield OAV (2015) Electronic spectra from TDDFT and machine learning in chemical space. J Chem Phys 143:084111
Experimental in vitro DMPK and physicochemical data on a set of publicly disclosed compounds.
Rogers D, Hahn M (2010) Extended-connectivity fingerprints. J Chem Inf Model 50:742–754
OEChem TK Version 2.3.0; OpeneEye Scientific Software Inc, Santa, Fe, NM
Molecular Operating Environment (MOE) 2019.01; Chemical Computing Group ULC: 1010 Sherbooke St West Suite #910 Montreal QC Canada H3A 2R7
OEOmega TK Version 2.9.1; OpenEye Scientific Software Inc. Santa Fe, NM
Hornik K (1991) Approximation capabilities of multilayer feed forward networks. Neural Netw 4:251–257
Svetnik V, Liaw A, Tong C, Culberson JC, Sheridan RP, Feuston BP (2003) Random forest: a classification and regression tool for compound classification and QSAR modeling. J Chem Inf Comput Sci 42:1947–1958
Wold S, Sjostrom M, Eriksson L (2001) PLS-regression: a basic tool of chemometrics. Chemometr Intell Lab Syst 58:109–130
Drucker H, Burges CJC, Kaufman L, Smola AJ, Vapnik V (1996) Support vector regression machines. Neural Inf Process Syst 9:155–161
Pytorch Version 1.5.0
Optuna Version 1.3.0
Nair V, Hinton GE (2010) Rectified linear units improve restricted Boltzmann machines. ICML 10:807–814
Chen CH, Tanaka K, Funatsu K (2018) Random forest approach to QSPR study of fluorescence properties combining quantum chemical descriptors and solvent conditions. J Fluoresc 2:695–706
Pedregosa F, Varoquaux G, Gramfort A, Michel V, Thirion B, Grisel O, Blondel M, Prettenhofer P, Weiss R, Dubourg V, Vanderplas J, Passos A, Cournapeau D, Brucher M, Perrot M, Duchesnay E (2011) scikit-learn: machine learning in python. J Mach Learn Res 12:2825–2830
Scipy Version 1.5.0
Irwin JJ, Serling T, Mysinger MM, Bolstad ES, Coleman RG (2012) ZINC: a free tool to discover chemistry for biology. J Chem Inf Model 52:1757–1768
Acknowledgements
We thank OpenEye Scientific Software Inc., for providing a free academic license of the OpenEye chemistry toolkits. This work was supported by JSPS KAKENHI Grant Number JP20K19922.
Author information
Authors and Affiliations
Corresponding author
Additional information
Publisher's Note
Springer Nature remains neutral with regard to jurisdictional claims in published maps and institutional affiliations.
Electronic supplementary material
Below is the link to the electronic supplementary material.
Rights and permissions
About this article

Cite this article
Sato, A., Miyao, T., Jasial, S. et al. Comparing predictive ability of QSAR/QSPR models using 2D and 3D molecular representations. J Comput Aided Mol Des 35, 179–193 (2021). https://doi.org/10.1007/s10822-020-00361-7
Received:
Accepted:
Published:
Issue Date:
DOI: https://doi.org/10.1007/s10822-020-00361-7