
Abstract
When people are connected together over ad hoc social networks, it is possible to ask questions and retrieve answers using the wisdom of the crowd. However, locating a suitable candidate for answering a specific unique question within larger ad hoc groups is non-trivial, especially if we wish to respect the privacy of users by providing deniability. All members of the network wish to source the best possible answers from the network, while at the same time controlling the levels of attention required to generate them by the collective group of individuals and/or the time taken to read all the answers. Conventional expert retrieval approaches rank users for a given query in a centralised indexing process, associating users with material they have previously published. Such an approach is antithetical to privacy, so we have looked to distribute the routing of questions and answers, converting the indexing process into one of building a forwarding table. Starting from the simple operation of flooding the question to everyone, we compare a number of different routing options, where decisions must be made based on past performance and exploitation of the knowledge of our immediate neighbours. We focus on fully decentralised protocols using ant-inspired tactics to route questions towards members of the network who may be able to answer them well. Simultaneously, privacy concerns are acknowledged by allowing both question asking and answering to be plausibly deniable. We have found that via our routing method, it is possible to improve answer quality and also reduce the total amount of user attention required to generate those answers.
1 Introduction
Computer mediated social networks are formed for a myriad of reasons, ranging from maintaining friendship and other social bonds, through to coming together to build a synergistic service that emerges from the network formation. One such example from the latter group is a question and answer (Q&A) network, where users submit questions and request answers from the networked crowd of individuals, such as Yahoo! (2009) or Aardvark (2009). Questions are typically categorised and submitted by the user, distributed through the network and interested members of the Q&A network then provide answers, where the user will then rank the answers as to their utility. Such services are currently accessed through web interfaces, allowing the hosting company to have access to the identity of users, and to build detailed pictures of what questions people asked and answered.
With the rise of smart phones and other mobile devices, a natural question is whether a Q&A network can exist in a decentralised fashion, emerging from ad hoc communities of individuals, rather than being brokered by a third party. Such an application may be more attractive to people with concerns about giving their questions and answers to a commercial organisation. Indeed, concerns have recently been highlighted over users not participating in Q&A networks due to how they will be perceived or because they are afraid to express personal opinion Dearman and Truong (2010); Ringel et al. (2010), and the Aardvark community has consecutively voted the thread “allow for users to be anonymous, at times I do not want specific response archived under me” as most important for many months since the application launch. If we build a distributed Q&A network, can we further protect privacy by hiding the identity of users within the crowd, and provide plausible deniability within the Q&A service by distributing the service across an ad hoc network?
If we are to provide deniability, then the problem of expert retrieval (ER) will require new solutions. Previously published ER techniques aim to rank experts for a given query, and in order to do so they make use of two assumptions Macdonald et al. (2008):
-
A complete list of users to rank.
-
Textual evidence in the form of a profile for each user.
Typically the ER community approach to retrieval is to create a global ranking of expertise and route queries directly to the known identities. But knowing the identity of each user instantly prevents deniability. In addition, supporting textual evidence in the form of a profile presents a clear and obvious privacy concern. This concern may increase rapidly with the level of resources used to construct the profile (profiles may make use of all electronic documents and correspondence including e-mails). As such, past ER techniques such as Cosley et al. (2007); Demartini (2007); Zhou et al. (2009); Macdonald et al. (2008); Craswell et al. (2001); Liu et al. (2005); Macdonald and Ounis (2006) can’t be used if we are to maintain deniability. Instead we have looked for inspiration in the deniable routing mechanisms typically used within the construction of application layer networks (Kurian and Sarac 2010).
In a fully decentralised ad hoc network setting, locating those members of the crowd with the expertise to answer a question is non-trivial due to the range of users and possible pathways towards them. This work utilises a random network to preserve deniability, and then considers and evaluates several possible naïve methods towards question routing and presents a new stigmergic-inspired approach to increase performance across several metrics. We aim to improve the quality of answers and reduce the total user attention time by routing questions towards those network members who stand a better chance of producing acceptable answers, while limiting potential bombardment of the emergent experts. A key technique adopted here is to use a non-identity based stigmergic approach to route data based on previous interactions and positive user feedback. We want to reduce the total amount of user input required to generate these answers, as users have finite attention and limited interests. Throughout this paper we interchange node and person, as each node has an owner and vice-versa.
Our key metrics in determining the success of our approaches were whether the answers provided were of comparable quality to that obtained by flooding the question to every user, the level of network resource utilised in delivering the questions and answers, and the required user attention, where we consider the total time that all users must study the questions and consequent answers. As far as we are aware, this is the first time that total user attention is considered as a performance metric within networks or within the ER research community. We feel that user attention will become increasingly regarded as an important and expensive resource when real users are involved with always-on-connections, in comparison to computation, where computational resources are becoming ever more available and inexpensive over time.Footnote 1
We have analysed an official Yahoo! Answers data set (Yahoo! Labs 2009) to provide the statistical model for question and answer generation, and utilise existing studies of user behaviour to provide a model of user attention. The new question routing approaches are evaluated experimentally using peer-to-peer network simulations. The proposed approaches show improved answer quality and reduced user attention requirements across realistic simulated networks. We define our application scenario as follows:
Active network members may submit textual questions into the network at any time. Questions will use single hop routing tactics to jump between pairs of nodes aiming to find a suitable answerer. When a question reaches a node which is interested, it is recorded and dealt with as and when the user has time to do so. Generated answers will follow the same route that the original question took back to the originating node. The choice of tactics used for routing questions will determine the quantity and quality of answers and also the path lengths. We assume users require the highest possible answer quality while reducing the overhead in terms of user attention.
The remainder of this paper is structured as follows. Section 2 describes the core features of our designs and experiments, including the modelling of users, the question and answers service and privacy concern issues; Sect. 3 discusses the various question routing protocols and in Sect. 4 we define our attack model and show how our design meets these challenges; Sect. 5 provides details of the simulation experiments and results are discussed in Sects. 6 and 7 provides results for model variations. Finally, we present related work, conclusions and suggest future research directions.
2 Core features
In this section the core features of modelling and simulating a distributed question and answer service are described. We are interested in large ad hoc networks which consist of real people, utilising a human orientated service. Using networked devices these users may engage in peer-to-peer exchanges in a decentralised manner without the requirement of disclosing personal details such as an email address or other identifiable information. We are particularly interested in mobile devices connecting to the Internet via always-on-internet connections—allowing for large groups to establish ad hoc networks irrespective of location and time.
2.1 Questions and answers
The data set (Yahoo! Labs 2009) contains approximately four million questions with associated answers from the well known and popular service Yahoo! Answers.Footnote 2 Both questions and answers exist as snippets of text, such as a short paragraph, and are assigned to a category. We currently use the 27 distinct top level categories found in the data set from Yahoo! Answers (examples of a category may be “Science and Mathematics” or “Computers and Internet”). In the Yahoo! application model each question is seen by all interested users and any number of answers may result. After some time there is a vote on the single best answer. We show the distribution of question and answer volumes for all categories in Fig. 1. We assign each generated question and answer a relevant size drawn from the length in words of questions and answers, again found in the Yahoo! data set (see Fig. 2c).

Yahoo! answer category question and answer volumes. a Question category popularity. b Answer category popularity

Yahoo! answer discrete distributions used for user modelling. a Range of interest and expertise. b Best answer count distribution. c Q&A length in words
There is nothing particular special about the number or range of categories investigated in this work except that the user model is based around analysis of this dataset—any number of categories and sub-categories could be used. Section 7.1 provides more details and discussions on dynamic categories.
2.2 User modelling
We model users by their interest, expertise and presence in the network. We analysed the data set to determine the discrete data probability distribution functions (PDF) and the corresponding cumulative distribution functions (CDF) for the number of questions per category, the number of categories in which a user would be interested, and the likelihood that a user has provided a given number of best answers in a specific category. The range of interest is seen in Fig. 2 as the number of categories on which a user has answered questions. Footnote 3 The expertise is seen in the number of categories in which a best answer is given and the number of best answers given in that category. A user with a greater number of best answers is considered more expert in our model, while some users who have never given a best answer are deemed as interested but not expert. We focus specifically on the questions and answers which are in English within the data set, which encompasses the majority of the data set. Each modelled user can therefore be probabilistically assigned a range of interest and expertise categories. This allows the realistic representation of typical Q&A service users within a simulated environment.
Following evaluation of the data set, it appears that the most sensitive questions and answers may exist within some of the most popular categories: “family and relationships”, “society and culture”, “health”, “politics and government” and “pregnancy and parenting” (see Table 1 where these categories are highlighted in italics). This supports the motivation to provide and support plausible deniability within the context of Q&A.
Our simulated Q&A users obey the following rules:
-
Users have an ordered set of expertise categories; these dictate answer preferences, and a set of interest categories drawn from the distribution of questions. Questions will have varying levels of interest to users, depending on expertise.
-
Users will ask questions associated with their interest categories with a constant probability. Questions and answers are of various lengths, which take time to compose and read.
-
It takes time steps for users to read questions and compose answers, based on the length in words and observed typical average words per minute values as in Ziefle (1998); Karat et al. (1999). We explore the effects of reading and writing abilities later in Sect. 7.
-
Users will attempt to answer questions which they are interested in by adding to a fixed length priority queue stored locally. This allows for the bursty nature often found naturally in the timings of human communications c.f. Barabási (2005). If a more interesting question arrives at a full queue, the least interesting will be forwarded.
-
Users follow a Markovian state model (Fig. 3). This models periods of inattention while remaining connected to the network. Users may only read and compose questions and answers while in the “paying attention” state. Users may be “paying attention” or “idle”. Users will remain in the attention state with probability P and will transition and reside to idle with probability 1 − P. Users will remain idle with probably Q and transition to the attention state with probability 1 − Q. While paying attention users may be asking, answering or waiting. While idle the node software continues to route Q&A. This model provides the flexibility to represents various attention behaviours.
Fig. 3 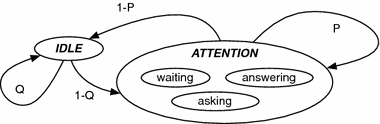
Attention Markovian model
-
Positive feedback is sent back by the questioner along the route of answers generated by authors with some knowledge of the subject. We simulate a judgement of some knowledge by allowing the questioner to know whether a user has generated at least one best answer from the Yahoo! model.
-
We assume that users are able to determine if an answer contains some useful information (that being answered by an author who has some knowledge in the subject area of the question).

2.3 User privacy: plausible deniability
Within this work an identity refers to the network internet protocol address and/or the hostname of a particular host. Such identities can be used to pin-point a specific organisation or location or a set of specific individuals at a given time and place. We are motivated by providing deniability between identities and specific questions and answers rather than being a member of the emergent network. For additional privacy it is possible to obfuscate one’s true address using TOR Footnote 4 or a similar proxy service when connecting to the Q&A network.
Due to the nature of our ad hoc decentralised model, we use single hop routing tactics to pass messages between network nodes (see Fig. 4). This feature of ad hoc networks allows us to support our privacy requirements by creating an element of anonymity or plausible deniability for question askers and answerers, in a similar fashion to the work on crowds (Reiter and Rubin 1998), Freenet Clarke et al. (2001) and the network of Kacimi et al. (2009), whereby the complete path of the route of a particular question or answer is not known by any one node in the network and therefore the exact author of a specific question or answer is plausibly deniable (see below for an outline of the model). In order for such mechanisms to work, we use a uniform random topology for the network graph (\(\Upgamma_{n,N}\), where n is the number of nodes and N is the number of links) based on the Erdős and Rényi random graph model. In such a graph, Erdős and Rényi (1959) shows that such a random graph will surely be fully connected if \(N > 2\ln(n)\) as n tends to infinity, ie the average degree \(N/n>\frac{2\ln(n)}{n}\), which we term the Erdős constraint.

Small Q&A example routing a question to answerers
We use a random topology to maintain deniability. We wish to prevent any node from becoming too central within the network and knowing too much about the Q&A activities of other nodes. Additionally, a random topology is used to provide even connectivity among network nodes, providing a distributed set of neighbouring links throughout the network. This uniformly random connectivity provides robustness and fault tolerance in a similar manner to Chord Stoica et al. (2001) and Tapestry Zhao et al. (2004).
When a question is injected into the network the asker generates a unique question GUID, in the form of a immutable universally unique identifier (UUID),Footnote 5 and a time to live (TTL) value. GUIDs are used to uniquely identify questions so that routing choices can be recorded allowing for path reconstruction later by relating a GUID to a particular neighbour. TTL values are used to prevent questions from lingering in the network indefinitely. At each hop (visited node) the TTL value is decremented, when the TTL value reaches zero the question is discarded. To prevent identification of the source of a question, we use a random Poisson distribution to assign our TTL values. Our random Poisson distribution has a mean value related to a proportion (20% here) of the network size and the number of answers required via Eq. 1.
A node receiving a question notes the GUID against the ingress link. The routing algorithm (discussed in Sect. 3) chooses whether to add to the queue to be answered locally and/or to forward. If forwarding on an outgoing link is chosen, the question GUID is noted against the egress link and the TTL is decremented. When the TTL reaches zero the question is discarded. If the outgoing link has already seen the question a new link is chosen. When an answer is returned it is forwarded directly back on the original ingress link to shorten the path. If the present routing protocol includes positive feedback this is applied only to the final egress link from which the answer originated. The forwarding process is illustrated in Fig. 4. Only the original question asker has no ingress link to forward down, and the identity of that node or the answering cannot be seen by any other nodes in the network. We discuss attack models in Sect. 4.
3 Question routing approaches
As far as we are aware this is the first attempt to evaluate routing tactics to aid question answering within fully decentralised ad hoc networks. In small networks a flooding approach will perform well. However, flooding does not scale with the number of nodes and acceptable levels of attention. A random approach also works well in small networks, but it neither learns nor directs questions towards experts. In this section we describe the naïve approaches of network flooding and random hops followed by our stigmergic inspired solution, which attempts to bring together the best aspects of flooding (answer quality) and random routing (attention). We note that established peer-to-peer approaches seek to search for data rather than people (where human attention which is of the highest value is consumed), focusing on locating specific data items which exist on multiple nodes and disregarding deniability such as Yang and Garcia-Molina (2002); Tang et al. (2002); Michlmayr (2006), and aren’t directly comparable to our approach.
3.1 Network flooding
A flooding approach will attempt to deliver all questions to all network nodes. Each node that is able to answer the question will compose its answer and send it back towards the source node using the outlined single hop routing tactics. The flooding approach should reach the best possible answerers but also the worst. In larger networks the number of responses may be so large that they result in source bombardment or denial of service. It is also possible to push less interesting questions from the experts due to the flooding of local priority queues with more interesting questions. In addition, this approach consumes the maximum levels of attention from all users of the network. Figure 5a depicts the flooding routing tactic, where given a single question it will be forwarded by each node to all known neighbours. Once seen and forwarded, the node will ignore all subsequent occurrences of the same question sent to the node.

Naïve routing methods. a Flooding: send to all links. b Random: uniform path selection
3.2 Random hops
A random technique will pass questions between nodes choosing an arbitrary path. This simple approach can find experts, but as network sizes grow it becomes increasingly difficult to locate experts without any insight. The main benefit is that it requires comparatively low overhead, but unfortunately the answer quality will be inconsistent and statistically worse than a more informed approach. The random routing approach can be seen in Fig. 5b, where each question is forwarded randomly once with uniform probability—each link has a equal chance of being selected as the next hop.
3.3 Our approach: stigmergy
The key approach we adopt is based on stigmergy, as used by ants when foraging for food. Ant trails are marked with pheromones producing a trail-laying/following behaviour. Pheromones are a volatile chemical substance used by ants to encourage other ants to follow the same path. More desirable routes emerge with stronger pheromone trails and therefore exhibit preferential path selection by the ants as described by Goss et al. (1989).
Existing research has investigated this technique in networks, for example Bonabeau et al. (1999), Schoonderwoerd et al. (1996), and found very promising results for “dynamic networks” which adapt as network entities join and leave, creating new and broken pathways. Due to the nature of ad hoc networks, this approach appears very promising for our purposes.
Pheromones are represented in the local routing tables of network nodes in our Q&A networks where T i represents the routing table at node i, with each entryrepresenting the learned appropriateness of choosing link l for questions of category type c, denoted T i lc . The appropriate routing entry values are used to make a probabilistic routing choice at each node using a simple algorithm (see Eq. 2).
The probability of choosing a given link for forwarding a particular question is proportional to a link’s pheromone category strength against all other known links. Our work in terms of stigmeric routing specifics is similar to existing approaches towards routing in computer networks such as found in work by Caro et al. (2005).
Virtual pheromones will be deposited on the routing table entries of our network nodes. Questions will be forwarded probabilistically according to the routing table pheromone strengths; the higher the pheromone strength the more likely it is that the link will be chosen as the next hop.
The following pheromone updates rules are used for updating our routing table entries; (1) increase strength to links which produce answers, (2) increase strength to those links which provide useful answers, (3) optionally reduce strengths to those links which have been forwarded questions recently (load balancing). The probability of selecting a given path is:
This equation is used within the stigmergic routing approaches via the use of Algorithm 1. This allows for the probabilistic selection of the next hop for a question based directly on the pheromone levels found within local routing table entries (Algorithm 2).
Our work differs slightly from previous stigmergic routing seen in computer networks in that the path taken by the answer is almost the same as that taken by the question message. In the previous approaches the eventual destination node will contact the source node directly. In addition, we use active learning within the network rather than proactively updating our routing tables—our routes are learnt only from the direct interactions and feedback of the network users. Strongly scented routes do not explicitly point to a specific individual, but instead, flag those routes which have some expert or knowledgeable user connections through some path further along the network.
We consider three versions of our stigmergic-based approach for evaluation and comparison.
-
V1 A pheromone per category per routing table entry.
-
V2 As above with a local loopback routing table entry to allow self learning of expertise at the protocol layer. Nodes will only be allowed to answer questions which are self promoted by the protocol.
-
V3 As V2 but reducing routing pheromone strengths for a given link when selected for question routing, providing load balancing and additional network exploration/learning.
A loopback routing table entry is helpful for overcoming the situation where experts are hidden behind less knowledgeable members of the network. All interested parties will attempt to answers questions and therefore questions may be consumed before reaching a desirable user. The loopback allows for the underlaying protocol to determine if a particular question is pushed up to the user for answering, rather than having questions automatically consumed.
3.4 Stigmergic protocol overview
When a question arrives at a particular node, if the question is to continue on its pathway into the unknown, a routing option needs to take place.
The stigmergic protocol will forward questions to neighbours probabilistically based on the pheromone strengths for the corresponding question category as portrayed in Fig. 6. In this example a user asks a question identified by a globally unique identification number (GUID), which is forwarded to node a and then to an arbitrary set of intermediate nodes, finally arriving at node b who forwards the question to a node who is interested in answering.

Protocol question message sequence
In time, the question is read by the answering node and a unique answer with corresponding GUID is sent back along the path from which the question originated (see Fig. 7). The answer causes local pheromone strengths (related to the question category) at each intermediate node in the path to be increased back towards the answerer (in the direction on the grey arrows beneath the nodes), creating a greater probability of selecting this route in the future—when questions happen upon one of the nodes in this pathway. In our examples we indicate the answerer with a star icon to represent their expertise in this particular question category.

Protocol answer message sequence
In turn the original question asker may submit positive feedback in response to the received answer, back to the corresponding author (see Fig. 8). Positive user feedback causes a more powerful reinforcement of pheromones along the path towards the answerer, again increasing the probability of selecting this pathway for this particular question category in the future. We assume that all somewhat good answers receive positive feedback, but no further differentiation is made. Good answers can only be generated by users with non-zero expertise ratings in corresponding question categories. We assume that good answers are unlikely to happen by chance and that specific expertise is required which can be identified by other users.

Protocol feedback message sequence
Figure 9 presents a situation when the stigmergic protocol has 4 possible links \( (a \ldots d) \) for forwarding a particular question associated with category c. In this example, node a represents a link which has generated an answer in this category previously via one of its own links and has also received positive user feedback as a result, earning this link the pheromone level of 0.91. Link b has also produced an answer to a question in this category via one of its connections, however it did not receive any positive feedback and is therefore shown with a smaller star icon and the pheromone scent level of 0.11. Link c represents a path for which there has been no activities for this category and is therefore given the scent level of 0.06, choosing such a link would be useful for exploration of the network and could uncover new experts. Finally routing option d signifies a link which has been forwarded a question but has not yet generated an answer in response (as is the case in V3 of our protocol) this link has been reduced to the level of 0.01. Any of these four routes may be chosen, with a probability as given in Eq. 2.

Stigmergic V1: path selection with pheromone scent levels
To help improve the quality of the generated answers, we investigate a loopback routing table entry (see Fig. 10) in versions 2 and 3 of our stigmergic approaches. When a question arrives at a node, it selects the next hop from its set of neighbours, including itself. Nodes can only attempt to answer questions which are self-promoted by the underlying protocol and as such, learning of a users expertise can take place locally. Nodes start with a high pheromone value for those categories for which they deem themselves an expert or are interested in. Over time, the local loopback pheromone entries may reduce causing non-experts to be selected less often than more strongly scented external routes as a possible answerer for a given question.

Stigmergic V2 and V3: loopback routing table entry
3.5 Dynamically updating routing tables
The three key protocol messages: Questions, Answers and Feedback all relate to a specific category. From a given message we can extract the related category from associated metadata. It would also be possible to extract this information using traditional natural languageprocessing techniques. When a particular protocol message arrives with a corresponding category, the routing tables can be dynamically updated as seen in Algorithm 3. A node will increase the pheromone category strength for a neighbouring link (associated with the original question/answer routes) depending on the particular message received. We assign constant values to increase pheromone strengths for each message and also use a minimum and maximum pheromone strength constraint.
3.6 Network formation and bootstrapping
On joining the network a new node contacts an “oracle” system. It is the oracle system’s responsibility to maintain a list of nodes currently in the network to provide bootstrapping and to serve neighbours when required from existing members of the network. The oracle system could be a single centralised computer or a fully distributed, load balanced system in its own right. There are other solutions to bootstrapping and network management, but they don’t affect the Q&A, just network load and attack models. We choose an oracle as it makes the evaluation of routing the key focus of our work without the costs and overheads associated with a more complicated bootstrapping approach.
When a new node joins the network, the oracle provides the relevant number of neighbouring nodes drawn at random from the current selection of online nodes. When a node leaves the network, it is removed from the current pool of nodes on record with the oracle. This could be supported by nodes gracefully exiting and informing the oracle or via a systematic timeout and polling system.
The oracle returns sufficient nodes from its list, drawn at random, to satisfy the current Erdős constraint. The joining node then contacts each one, being added as a new link to that node. If any do not reply (the oracle cannot be perfectly up to date) a request for additional node(s) is made, until the constraint is reached. A reply may not be given where a node has too many connections or has left.
Having joined, a node becomes listed by the oracle and so may receive requests for connection by subsequent joiners. If, despite this, its node count drops below the current constraint number (either through loss of nodes or change in the constraint) further requests can be made.
This approach ensures the randomness of the underlying peer-to-peer network and sufficient connections to prevent closely interconnected clusters or nodes being over-connected.
3.6.1 Network size and connectivity
Nodes can make use of various distributed mechanisms to estimate the current network size—for our experiments this knowledge is provided by default, allowing nodes to determine when new neighbours must be adopted in order to stay connected by satisfying the Erdős and Rényi constraint. We assume the existence of a network size estimation protocol operating in our networks, for example the epidemic style gossip approach by Jelasity and Montresor (2004) is a particularly successful and proven technique. This technique starts with a single node orchestrating a unique network size (N) estimation. The initiator begins with a local value of 1 while all other nodes for this unique session return 0 at first when requested and then the following calculation is performed \(update=\frac{local+remote}{2}\) to update local estimates. When a new estimation is to be calculated, all nodes exchange messages with random neighbours rapidly ‘gossiping’ to determine the size of the network. At the end of the estimation period, intuitively the result will be the global average from which N can be directly calculated by \(estimate=\frac{1}{local}\).
4 Attack model
Our ad hoc Q&A networks may be attacked and abused in various ways. We have designed our protocols and routing tactics to thwart these possible malicious attacks. We present the attack model and our related design features below:
Establishing an author’s identity We wish for question asking and answering to be plausibly deniable—as such, we disguise the source and destination address via an unknown intermediate pathway. Our random network topology and underlying protocol hides this information and so inherently it is protected. The TTL of messages is drawn from a random distribution, so that the source cannot be identified by its immediate neighbours. We cannot control directly the content of the questions and answers, however an anonymizing layer could be utilised to remove traces of identity such as names and addresses.
Reduce the quality of answers Users might try to reduce the quality of answers generated by the network by providing false positive feedback. Under such circumstances, a user could provide positive feedback for bad answers—reinforcing paths towards non-expert users. This effect would not exclude other users, due to the probabilistic behaviour and would be diluted by other interactions. Feedback is tied to question GUIDs, and hence a question and answer, so that spurious or multiple feedback cannot be generated.
Eager answerer An eager answerer could answer all questions directed at them in an attempt to cheat the routing system. If a user decides to answer all questions which arrive, they may be able to negate the advantage of positive feedback sent to neighbouring nodes and prevent further routing from taking place. This form of attack could lead to a node increasing the likelihood of being sent questions without having any expertise at all—just the time and attention required to deal with the incoming queries. In the standard approach a malicious user who is generating junk answers counteract the pheromone adjustments caused by positive feedback by supplying enough answers (ω) to satisfy this condition, namely: ω = (PHEROMONE_FEEDBACK/PHEROMONE_UPDATE) + 1.0 for example, if the pheromone feedback rate is 0.80 and the update rate is 0.05 then a malicious user would need to answer over 16 questions to create the attack. This is indeed an important attack on the routing mechanics. Fortunately, using V3 of our approach we are able to set a suitable strength decrease when sending questions to negate this form of malicious attack, such that either far more answers are required or making this impossible by penalising pathways producing solely junk answers. For example reducing the strength to the links which questions are forwarded through by an equal or greater amount than the enforcement gained from the routing back of a single answer.
Denial of service (DoS) Malicious users could bombard the network users by flooding the network with questions or answers. This form of attack pollutes the network with traffic aimed at consuming time and attention of the network users. This attack can be controlled by rate limiting the number of forwarding requests honoured on behalf of a specific neighbour. Nodes which exceed some threshold can be ignored or even removed as a neighbour. Nodes supplying spam as questions will eventually be routed out via our routing approach seen in V3, which allows link strengths to be reduced when using links which are not generating useful answers. This threshold or rate does not need to be determined prior to the network construction and could be enhanced through end application features such as signals from the end users.
Colluders In an attempt to cheat the network mechanics, colluding users may attempt to route and reinforce routes between one another. Such a colluding set of users may ask questions regarding specific subjects, when answered by a fellow colluder provide positive feedback. This may allow a colluding set of nodes to cause questions to flow towards specific users undermining the routing. Random routing and proabilistic link selection makes it hard for this attack to have a widespread impact on the network. The load balancing mechanisms of the V3 model further reduce the effect of collusion.
We investigate the more quantifiable attacks experimentally later in Sect. 8.
5 Experimental evaluation
Ideally the routing strategies would be compared with real users out in the wild. Gathering large numbers of real users to help develop an application, provide valuable feedback and allow for parameter tuning is unfortunately infeasible. Indeed, real world experiments are hard to run—and even harder to extract clear analysis of algorithms from. We perform extensive experimentation and attempt to negate the problems associated with a simulated approach by exploring the choice of parameters to show applicability to a wide range of scenarios. To further enhance our experiments, we explore the key assumptions and variables in detail in Sect. 7.
The five approaches are primarily compared with regard to answer quality and user attention. We also consider unanswered questions and network load. The simulation mechanism is built on top of the Java based peer-to-peer simulator Planetsim (2009) which provides the support of a discrete event simulator. We use a uniform random network topology and master seeding such that each approach is tested under the same network conditions, question frequency and user attention behaviour. Five different seeds, and hence network and question conditions, are tested. Results are presented using percentiles (5th, 25th, mean, 75th, 95th) due to the variation in the number of questions, network set up and answers based on random seeding across runs. Each iteration of each approach has an identical master random seed and therefore the comparisons are like-for-like. Our results are an amalgamation of our chosen metrics across all iterations. We shall now give details of the metrics, configuration and results.
5.1 Modelled users
By using a master experiment seed we can repeatedly generate the same set of simulated users. A summary of key user related information follows below in Table 2. Our user categories of interest (those they will ask questions about) and expertise (those which they will answer questions from) are each drawn from the cumulative distributions found in the Yahoo! Answers dataset as presented in Fig. 2 and Table 1. We present the exact counts of users with interest and expertise in each category in Fig. 11. We ignore any correlation between users expertise and interests, but draw from the population as a whole.

Simulated population knowledge (interests and expertise categories)
5.2 Evaluation metrics
We use the following performance metrics to compare routing approaches:
Answer quality We wish to identify how good an answer is in comparison to all other possible answers which could have been generated by the current network of users. Assuming that users with higher expertise values always generate better answers, we use the following definition of quality: When a question is first sent into the network, those active nodes who have an interest in the category (set A) are recorded, when an answer is generated these nodes are checked to see if they are still online (set B). The set C = A ∩ B is then found—consisting of those nodes who had the potential to answer a particular question. The available expertise is then the set of user expertise ratings from C. For example C = {0, 3, 4, 35, 100}. We then produce a ranking 0 ≤ quality a ≤ 1 based on the members of C to tag an answer with a perceived answer quality rating via Eq. 3 where a refers to the answer in question and u the authoring node of a and ranks is equivalent to set C above. If we evaluate an answer authored by the expert with rating 35 in the above example the quality rating would be r = 0.75, based on the position within the zero indexed ordered set. Each answer is tagged with its associated perceived quality rating of the author. An ideal algorithm will return consistently high quality answers. We use the average of the set of answer qualities and the overall best answer quality per question.
Total user attention We record the number of simulation steps each node spends reading questions, composing answers and dealing with answers received from the questions asked. We present statistics for the attention consumed per question. An ideal algorithm will consume a low amount of attention from each question and a consistent amount from each user. An algorithm which maximises answer quality may focus all questions on a few users. In order to achieve a balanced attention cost some reduction in quality may be required.
Hops Each question tracks how many hops it has taken throughout its lifetime. When an answer is generated at a node, the number of question hops is recorded and logged against it. This allows us to generate percentiles of the number of hops for each question/answer pair. As well as network load in our decentralised, single hop network setting we need to try to reduce path length to avoid broken pathways as churn causes the network topology to change over time. An ideal algorithm will minimise the path cost through the network. To achieve higher quality more steps are typically required to reach the better qualified users.
Unanswered For each question generated in the simulations, all answers received in response are linked back to the original question. All questions which have zero answers are deemed unanswered. At the end of a simulation run we can check which questions have no answers and from this we can calculate the percentage of unanswered questions and the percentiles of these values across simulation runs. An ideal algorithm will minimise the quantity of unanswered questions.
5.3 Simulation setup and configuration
For each iteration of our simulation (per approach) we create a random network topology consisting of 1,000 nodes. We show later in Sect. 7 that our approaches scale for larger networks (10,000 nodes) with comparable results.
A churn model where nodes enter and leave the network is drawn from a Weibull distribution, which has been observed as accurately fitting session durations in peer-to-peer networks as discussed by Stutzbach and Rejaie (2006). We do not opt to take the observed Weibull parameters directly, as it is associated with BitTorrent users downloading durations and bandwidths. We instead use the Weibull distribution to define sample scenarios for users who interact with a service at a particular time/event (see Fig. 12). We assign each node a session duration and allow nodes to leave when this session expires. Additionally, new nodes may arrive at the start of a simulation step. The network size remains approximately constant over time, although the population varies at different rates with different churn scenarios, as illustrated in Fig. 13.

Weibull session duration scenarios

Network size over time
Each of the simulations run for 36,000 steps, assuming each step represents 1 s, the simulations represent approximately a 10 h time period. We do not allow question asking or record any results during the initial creation of the network. Additionally, the first 15,000 steps (≈4.0 h) of the simulation results are discarded, giving a “warm start”. The duration of the warm start period is found by examining the time taken for the routing to establish knowledge of the network, found by observing the exponentially weighted moving average answer quality at each simulation step until it settles (see Figs. 14, 15 and 16). This leaves 21,000 steps (≈6 h) which are used to evaluate the running network, rather than a stabilising one.

Example exponentially weighted mean average for C0

Example exponentially weighted mean average for C1

Example exponentially weighted mean average for C2
At the end of the simulation, we prevent question asking and while still allowing for churn, clear all node’s question queues and include these stats in our results.
The simulations use various configuration values across all iterations to provide an appropriate bias for the stigmergic routing to work accordingly. The most important key variables are discussed below:
-
CONNECTIVITY Network nodes aspire to keep at least the number of neighbours required for the Erdős threshold of connectivity. Every 180 simulation steps (3 min) the nodes become aware of the current network size and will request more neighbours addresses from the “oracle” when their local neighbour collection drops below the required threshold.
-
PHEROMONE_RATE The rate at which answers flowing through links increase link strengths regardless of quality. We use a constant 0.05 which allows bias towards links which are generating answers.
-
PHEROMONE_FEEDBACK The constant strength 0.80 increase is used for a link which is selected as having generated an answer by a user with a non-zero expertise rating. This is propagated back towards the node where the answer originated from. To determine these values, we evaluated all combinations of rates (in the range [0.0–1.0]) to evaluate the surfaces of mean best answer quality and 95th percentiles of attention consumption. We use the pheromone values which maximise the ratio between quality and attention. The best ratio is achieved when the pheromone rate is low with a high feedback level high, roughly in the range fb_rate > 3 * p_rate.
-
USER_ATTENTION_P and USER_ATTENTION_Q We assume that P and Q are equal in our behaviour model (see Fig. 3), with a value of 0.9996, this provides a 50% chance of a transition between states once every half hour (1,800 steps) \((0.5^{\frac{1}{1,800}})\). We further explore the choice of P&Q values in Sect. 7.
-
PHEROMONE_Q_RATE The constant strength reduction to links as questions flow through. This is used in V3 for load balancing and to promote exploration and is set to 0.05. We use a value which reduces the strength to links which have not yet produced an answer.
-
PHEROMONE_MIN, CAP and DEFAULT We choose a minimum value of 0.01 to ensure that a link always has some probability of being selected as the next hop within a path (no matter how small). A pheromone cap of 5.0 is used to prevent extreme pheromone differences upsetting the routing decision through heavy bias as observed in existing stigmergic network routing algorithms by Roth and Wicker (2003). We start with equal low pheromone values of 0.06, with loopbacks of associated interest categories set to 1.0 to provide bias for bootstrapping, approximately equivalent to a single answer being received with positive feedback.
-
DISSOLVE_RATE and DISSOLVE_STEPS The rate and frequency at which pheromone strengths evaporate. A constant value of 0.001 is deducted each 250 steps from all routing table entries for each pheromone category.
-
STAY_SHAPE and STAY_SCALE Dictate session durations draw from a Weibull distribution with shape (k) and scale (λ) parameters according to our churn scenarios (C0…C2). The inter-arrival time between freshly arriving nodes is set to maintain the network size, while keeping the same shape parameter k. Our results are shown for three difficult churn scenarios, the first of which has a constant network size without churn (C0). The second, can be described as ≈25% stay for up to 3 h, while ≈50% stay for between 3 and 5 h (C1) with Weibull parameters k = 3.07, λ = 269.79. Finally, a scenario is defined with 0.5 and 0.5–2 h boundaries on these percentiles (C2) using the parameters k = 1.13, λ = 89.97. The network size over time can be seen in Fig. 13 for each of our churn scenarios. We examine the effect on quality and attention for a large range of Weibull parameters later in Sect. 7.
-
QUESTION_QUEUE_SIZE Specifies the size of each users local priority queue. In our simulations we use a fixed size of 10 questions. When queue sizes are too small overloading occurs. A 10 item queue allows the flexibility for a collection of questions of various interest level to await answering.
-
QUESTION_ASK_PROB Questions are asked with the probability of 0.000175 at each step for each node. We request five answers from the network for each question by sending initial questions through five distinct links. We choose to investigate this particular modest question asking rate as it is at the lower end of the examined question rates, with less than 1 question per user each hour, providing a good balance between attention and quality. We explore the effects of question ask probabilities and number of answers later in Sect. 7.
6 Results
We show in Fig. 17 that the level of attention per question required from the users is dramatically reduced in comparison to flooding. Additionally, as shown in Figs. 18 and 19, we improve the quality of answers significantly for CO and C1 (specifically the 75th percentiles and means) in comparison to random routing, showing an improvement for the majority of users. In all cases attention per question is comparable to random, with a slight raise in the 25th, mean and 75th percentiles. Attention is a little raised but without experts being swamped as a poorly designed algorithm might do.

Attention consumed per question

Best answer quality per question and approach

Average answer quality per question and approach
Figure 20 shows a significant proportion of unanswered questions, particularly as churn rises—even with the flooding approach. However with our primary approach V1, all remain clearly better than random in each case. In future work we shall explore techniques to mitigate the loss of knowledge and packets caused by churn further. Network hop count shows use of longer paths as churn increases, but our approaches do not place substantially more load on the network. Although flooding has better quality and answer percentages, attention per question is massively better with the stigmeric approaches. The attention requirements to achieve the highest quality answers from flooding is huge, we cannot expect the users of the network to invest this level of attention.

Unanswered questions
In comparing the variations in our algorithm we see that the basic version, V1, has a small advantage in answer quality. However, V1 closely followed by V3, most reliably generate an answer, as shown in Fig. 20. Flooding is able to maintain extremely short pathways due to the network diameter being small and attempting all possible routes as shown in Fig. 21. Flooding suffers from bombardment and network load however, which results in some questions being pushed away. In any case, the additional network load is unlikely to be an issue on practical networks.

Network load
Its clear that our stigmerigic approaches take some time to learn about the available network users and their expertise in proportion to the number of questions and answers being generated within the network. By monitoring the interactions between users we are able to update the pheromone routing table entries of nodes accordingly to inform path selection. Churn plays an important role in determining how long the learned paths remain up to date, indicating routes towards those members of the network who stand a chance of proving some answer to a given question.
Applications adopting our routing techniques should promote and award users who stick around and participate at the network level. Users do not need to pay full attention to the system for our approach to work, however the longer they can remain connected to the network to facilitate routing the better.
7 Model variations
In this section we present results showing the sensitivity of our protocol to variations in the parameters of the simulation and of the protocol itself. We explore a range of user attention states and the proportion of time spent actively engaging with the Q&A system, determine the levels of churn where our routing strategies are effective, and show how variations in reading and writing speeds, question rates and answer volume affect the protocol.
In these simulations we use networks of 1,000 nodes for 36,000 time steps using our middle C1 churn scenario. We investigate the changes in our key quality and attention metrics, comparing with random hops when appropriate. The more extensive three-dimensional surfaces use 500 node networks to reduce the overall complexity.
Figure 22 provides details of the effects on quality and attention when different attention models are used. We can see that the more attention users dedicate to the system, the greater performance we can expect. We do however see good quality and attention utilisation in a large proportion of the variable space.

Variations of our attention model assumptions (we use P = Q = 0.9996). a Attention model effect on quality. b Attention model effect on attention
We have assumed that the reading and typing speeds of users has little impact on the quality of answers, only affecting the attention requirements due to the changes in the time it takes to compose and read text (Fig. 23). We choose WPM rates from existing literature which shows how particular devices adjust the speeds at which users can realistically perform (Table 3).

Variations of our reading and writing ability assumptions (we use read: 180 wpm, write: 19 wpm). a Effect on quality. b Effect on attention
The more questions asked and answers generated by users, the greater the learning which takes place apparent in established pheromone trails (as seen in Fig. 24). We have used a modest question asking rate in our simulations, but a more active population could benefit from improved learning of expert locations.

Variations of our question rate assumptions (we use ~0.5 question). a Effect on quality. b Effect on attention
The quality of answers increases with the number of answers requested per question from the network, where the stigmergic routing approach improves at a faster rate than randon (Fig. 25).

Variations of our number of answer assumptions (we request 5 answers). a Effect on quality. b Effect on attention
We can see how the two Weibull distribution parameters (λ, k) used for session durations impact quality and attention within the Q&A networks (Fig. 26). As users exhibit longer session durations (as λ increases) they will be able to ask and answer more questions.

Variations of our churn assumptions. a Effect on quality. b Effect on attention
We investigate much larger networks of 10,000 nodes with our C1 churn scenario (see Fig. 27) and find that we are still able to keep the relative comparable improvements from our random hops base line approach. Within our larger network simulations we are able to clearly see the improvement in the exponentially weighted mean average quality over time in Fig. 27c. In addition, our quality calculations include the full set of possible experts and therefore all results are squashed, as questions are serviced more easily when a larger collection of nodes are held together. Possible experts included in our answer quality metric may be deep within the network and practically unreachable before questions are consumed and answered by interested users. We are still able to see a clear improvement however (Fig. 27a), still with comparable attention (Fig. 27b) requirements.

Variations of our network size assumptions (10,000 node simulation). a Effect on quality. b Effect on attention. c EWMA quality comparison
7.1 Dynamic categories
The categories used to classify particular questions in this study is derived from the 27 top level categories seen in the Yahoo! Answers data set. In reality, this set of categories could be dynamic and systemically updated using one time network flooding or a centralised topic list as a feature of the oracle system. It should be possible for question categories such as ‘2012 Olympics’ to be created and also decommissioned at some later time.
Nodes could assume a default pheromone level for all unknown categories types, dynamically manipulating the pheromone levels as described. This approach has the added advantage that it reduces the amount of pheromone related data that is needed to be stored alongside each node in the routing table.
A more fine-grained categorisation could be assigned to questions, whereby subcategories are used to provide a more precise and rich categorisation. This would increase the storage requirements of the routing table in the worst case. To allow for correct routing to take place, subcategory pheromones could be combined to represent the top level category scents. There is however a clear trade off between the granularity of classification and actually getting answers to questions.
8 Attack model results
We examine several of our attack models in this section and compare against our key quality and attention metrics. We find that as long as 50% of the network is behaving (Fig. 28a) then our routing approach still performs well. The v2 and v3 algorithms mitigate the attacks better than v1. We also investigate the effects of eager answerer’s and find that this attack could quickly reduce the quality within the network if enough network members are malicious (see Fig. 28b). A difficulty of a distributed approach to Q&A is that it relies on nodes to route requests and if too high a proportion of the network absorbs all requests, as seen here, problems will appear as the routing cannot explore and learn correctly.

Attack model investigations. a Reduce the quality of answers. b Eager answerer
9 Related work
Questions and answers (Q&A) has received much attention from the information retrieval (IR), natural language processing (NLP) and human computer interaction (HCI) communities.
The area of Expert Searching, a sub-field of IR, has seen attention drawn towards online forums and communities to locate expertise using various tactics. Work such as G-Finder by Li et al. (2010) attempts to find experts within programming forums by creating concept networks relating to the source code found within discussion threads which are mapped to user networks. This work aims to establish expertise to decrease waiting times for question answers, however it is concerned with a known set of experts rather than modelling an arbitrary group. In addition it states that one of the main problems with the approach they adopted is locating new experts that emerge over time as seen in here.
Prior work by Anvik et al. (2006) aims to aid the assignment of bug reports to the relevant developers (with the appropriate expertise) to resolve them. This work aims to reduce the time spent on this allocation activity. Bug tracking data from source revision (CVS) and bug tracking software is used across several open source projects including EclipseFootnote 6 and Firefox.Footnote 7 This work is specific to open source programming projects and the bugs associated with them, it also uses a known set of real developers for which to assign these tasks/jobs to. Other work by Balog et al. (2007) aims to perform expert finding and ER via organisation intranets. Again, this work looks at the analysis of existing data sources to build a set of expertise information, rather than building on the fly routing aids from user interactions and feedback as seen in our work. Finally, all of the IR related work that we have seen in the context of expert sourcing ignores human attention, privacy and network routing.
Recent research has been conducted towards ranking experts in Q&A sites. Work such as Gyongyi et al. (2007); Balog et al. (2007) disregard the use of number of best answers as an appropriate ranking metrics. The basic idea is that answers have more value when in competitive answering environments and that questions are more meaningful when they have many answers. However, again, this work is looking at an established set of individuals and often the prediction of future question and answering interactions. We are interested in modelling some population of expertise rather than a distinct set of users and individuals and identifying them for answering specific questions in the future.
NLP has investigated methods to categorize questions more accurately and appropriately (work such as Zhang and Lee (2003) discusses these concepts) in order to aid question classification. Additionally, numerous works surrounding the use and motivations of Q&A (e.g., Jeon et al. (2010); Dearman and Truong (2010)) are still popular research areas. Interestingly, there is a consensus that people do help one another through Q&A services for free, as demonstrated by the numerous services available and their popularity, e.g., Yahoo! Answers, AardvarkFootnote 8 and StackOverflow.Footnote 9
Research has been conducted by Dearman and Truong (2010) to investigate why not all questions receive answers from online question and answer communities. It is accepted that users will not answer questions if they are not interested in the subject or if they are unable to provide an answer—but this does not provide a complete image. Top and regular contributors appear to not answer questions for similar reasons, for example those questions with many answers are less likely to be answered as the contribution may be “lost in the crowd and not be read”. Most importantly the respondents perception of how the asker will receive, interpret and react to their answers is paramount. Users do not wish to get reported for abuse and potentially loose access to the community. Another key reason for not answering questions is concerned with the interpretation of answers, for example a quote from one interviewee from this work states “Certain questions I dont reply to because I am afraid that if I express my personal opinion, I might offend someone”. Respondents are wary of answering when the response could be misinterpreted or misconstrued due to the subjective interpretation of an answer.
With the emergence of AardvarkFootnote 10 and it’s popularity, the case for practical use of such a system is strengthened. It has been a growing user concern in the Aardvark community that users wish to ask questions anonymously; currently each question and answer is tagged with the full name and location of the author. The Aardvark community has consecutively voted the thread “allow for users to be anonymous, at times I do not want specific response archived under me” as most important for many months since the application launch. Aardvark uses a users real social network to route questions, unlike our approach which is intended to work when all users are strangers. Additionally, the Aardvark network uses a centralised platform to route questions and is therefore not strictly a peer-to-peer application.
Past work by Haase et al. (2008) is similar to this work in terms of problem definition and motivations as they investigate methods for locating \({\rm Bi{B}TeX}\) data from local user stores. They are not however searching for expert users who answer real questions with various levels of quality/ranking. They also do not follow privacy considerations between asker and answers, nor do they investigate stigmergic techniques to solving this problem. Finally, Kacimi et al. (2009) investigate anonymous opinion routing through social networks. They too use single hop routing tactics to mask the source of a message, however they do not consider the direction of the routing nor the quality of the users, and instead, simply look at accumulating opinions from a source statement.
10 Conclusions and future work
This work has investigated a new approach towards question routing within ad hoc social networks and found that it is not only possible to improve answer quality, but the total amount of attention required to locate knowledgeable users can be controlled and the anonymity of contributions maintained. Although naïve approaches work well in small networks, we need to carefully consider our approaches when it comes to larger emergent ad hoc networks to successfully manage the workload on the network members.
In order to balance answer quality and user attention we must ensure that we do not bombard experts in the network with questions. If we rely only on the highest ranked experts, as seen in traditional ER approaches, we will be disappointed with the level of unanswered questions and attention requirements on those few members of the community. We cannot realistically expect to use a flooding approach, which consumes the maximum levels of attention, so we must opt for a more elegant autonomous option such our algorithm. We can achieve a good balance of attention workload by using techniques such as our stigmergic inspired approach which can be used to throttle requests (as seen in V3).
Work on this protocol is ongoing: to further explore the scalability and robustness of the approach; and to explore the effectiveness of extensions to the routing algorithms and local sharing of information. Work on the modelling of users is also ongoing, considering longer period behaviours and whether such a protocol can benefit from users’ temporal patterns without breaking the anonymity and scalability of the approach.
Notes
Of course, people studying email and spam have already noted how the network empowers the sender over the receiver Palme (1984).
Due to only knowing the categories in which users gain best answers, we assume that users will answer questions in at least a single category.
http://vark.com now closed.
Aardvark was purchased by Google in February 2010, and Google announced in September 2011 that they would discontinue the service. These comments were current when the research was being undertaken.
References
Aardvark. (2009). http://vark.com.
Anvik, J., Hiew, L., & Murphy, G. C. (2006). Who should fix this bug? In Proceedings of the 28th international conference on software engineering, ICSE ‘06 (pp. 361–370). New York, NY, USA: ACM. doi:10.1145/1134285.1134336.
Arif, A. S., & Stuerzlinger, W. (2009). Analysis of text entry performance metrics. In Proceedings of the IEEE TIC-STH 2009 (pp. 100–105). IEEE.
Balog, K., Bogers, T., Azzopardi, L., de Rijke, M., & van den Bosch, A. (2007). Broad expertise retrieval in sparse data environments. In Proceedings of the 30th annual international ACM SIGIR conference on research and development in information retrieval, SIGIR ‘07 (pp. 551–558). New York, NY, USA: ACM. doi:10.1145/1277741.1277836.
Barabási, A. L. (2005). The origin of bursts and heavy tails in human dynamics. Nature, 435, 207–211. doi:10.1038/nature03459.
Bonabeau, E., Dorigo, M., & Theraulaz, G. (1999). Swarm intelligence: From natural to artificial systems. New York, NY, USA: Oxford University Press.
Caro, G. D., Ducatelle, F., & Gambardella, L. M. (2005). Swarm intelligence for routing in mobile ad hoc networks. In Proceedings of the 2005 IEEE swarm intelligence symposium (SIS).
Clarke, I., Sandberg, O., Wiley, B., & Hong, T. W. (2001). Freenet: A distributed anonymous information storage and retrieval system. In International workshop on Designing privacy enhancing technologies: design issues in anonymity and unobservability (pp. 46–66). Berkeley, CA : Springer-Verlag New York, Inc.
Cosley, D., Frankowski, D., Terveen, L. G., & Riedl, J. (2007). Suggestbot: Using intelligent task routing to help people find work in wikipedia. Intelligent user interfaces, 3(4), 32–41. doi:10.1145/1216295.1216309. http://dl.acm.org/citation.cfm?doid=1216295.1216309.
Craswell, N., Hawking, D., Vercoustre, A. M., & Wilkins, P. (2001). P@noptic expert: Searching for experts not just for documents. In Ausweb (pp. 21–25).
Dearman, D., & Truong, K. N. (2010). Why users of yahoo! answers do not answer questions. In Proceedings of the 28th international conference on human factors in computing systems, CHI ‘10 (pp. 329–332). New York, NY, USA: ACM. doi:10.1145/1753326.1753376.
Demartini, G. (2007). Finding experts using wikipedia. In Finding experts on the web with semantics (pp. 33–41).
Erdős, P., & Rényi, A. (1959). On random graphs (Vol. 6, pp. 290–297). Debrecen: i. Publicationes Mathematicae.
Goss, S., Aron, S., Deneubourg, J., & Pasteels, J. (1989) Self-organized shortcuts in the Argentine ant. Naturwissenschaften, 76(12), 579–581. doi:10.1007/BF00462870.
Gyongyi, Z., Koutrika, G., Pedersen, J., & Garcia-Molina, H. (2007). Questioning yahoo! answers. Technical report 2007-35, Stanford InfoLab. URL: http://ilpubs.stanford.edu:8090/819.
Haase, P., Siebes, R., & van Harmelen, F. (2008). Expertise-based peer selection in peer-to-peer networks. Knowledge and Information Systems, 15(1), 75–107. doi:10.1007/s10115-006-0055-1.
Jelasity, M., & Montresor, A. (2004). Epidemic-style proactive aggregation in large overlay networks. In Proceedings of the 24th international conference on distributed computing systems (ICDCS ‘04) (pp. 102–109). Washington, DC, USA: IEEE Computer Society.
Jeon, G. Y., Kim, Y. M., & Chen, Y. (2010). Re-examining price as a predictor of answer quality in an online Q&A site. In CHI ‘10 proceedings of the 28th international conference on human factors in computing systems (pp. 325–328). ACM. doi:10.1145/1753326.1753375.
Kacimi, M., Ortolani, S., & Crispo, B. (2009). Anonymous opinion exchange over untrusted social networks. In SNS ‘9 (pp. 26–32). New York, NY, USA: ACM. doi:10.1145/1578002.1578007.
Karat, C. M., Halverson, C., Horn, D., & Karat, J. (1999). Patterns of entry and correction in large vocabulary continuous speech recognition systems. In CHI ‘99 proceedings of the SIGCHI conference on human factors in computing systems: The CHI is the limit (pp. 568–575). New York, NY, USA: ACM. doi:10.1145/302979.303160.
Kurian, J., & Sarac, K. (2010). A survey on the design, applications, and enhancements of application-layer overlay networks. ACM Computing Surveys, 43(5), 1–5:34. doi:10.1145/1824795.1824800.
Li, W., Zhang, C., & Hu, S. (2010). G-finder: routing programming questions closer to the experts. In OOPSLA ‘10 proceedings of the ACM international conference on object oriented programming systems languages and applications (pp. 62–73). New York, NY, USA: ACM. doi:10.1145/1869459.1869466.
Liu, X., Croft, W. B., & Koll, M. (2005). Finding experts in community-based question-answering services. In CIKM ‘05 proceedings of the 14th ACM international conference on information and knowledge management (pp. 315–316). New York, NY, USA: ACM. doi:10.1145/1099554.1099644.
Macdonald, C., & Ounis, I. (2006). Voting for candidates: Adapting data fusion techniques for an expert search task. In CIKM ‘06 proceedings of the 15th ACM international conference on Information and knowledge management (pp. 387–396). New York, NY, USA: ACM. doi:10.1145/1183614.1183671.
Macdonald, C., Hannah, D., & Ounis, I. (2008). High quality expertise evidence for expert search. In European colloquium on IR research (pp. 283–295). doi:10.1007/978-3-540-78646-7_27.
Michlmayr, E. (2006). Ant algorithms for search in unstructured peer-to-peer networks. In ICDEW ‘06 proceedings of the 22nd international conference on data engineering workshops (p. 142). IEEE Computer Society, Washington, DC, USA. doi:10.1109/ICDEW.2006.29.
Palme, J. (1984). You have 134 unread mail do you want to read them now? In Proceedings of the IFIP WG 6.5 working conference on computer-based message services (pp. 175–184). New York, NY, USA: Elsevier North-Holland.
Planetsim. (2009). Object oriented simulation framework for overlay networks. http://projects-deim.urv.cat/trac/planetsim.
Reiter, M. K., & Rubin, A. D. (1998). Crowds: Anonymity for web transactions. In ACM transactions on information and system security, 1(1), 66–92. http://citeseer.nj.nec.com/284739.html.
Ringel, M. M., Teevan, J., & Panovich, K. (2010). What do people ask their social networks, and why? A survey study of status message q&a behavior. In CHI ‘10 human factors in computing systems (pp. 1739–1748). ACM.
Roth, M., & Wicker, S. (2003). Termite: Ad-hoc networking with stigmergy. In GLOBECOM ‘03 global telecommunications conference, 2003 (Vol. 5, pp. 2937–2941). IEEE.
Schoonderwoerd, R., Bruten, J. L., Holland, O. E., & Rothkrantz, L. J. M. (1996). Ant-based load balancing in telecommunications networks. Adaptive Behaviors, 5(2), 169–207. doi:10.1177/105971239700500203.
Stoica, I., Morris, R., Karger, D., Kaashoek, M. F., & Balakrishnan, H. (2001). Chord: A scalable peer-to-peer lookup service for internet applications. In SIGCOMM ‘01 (pp. 149–160). New York, NY, USA: ACM. doi:10.1145/383059.383071.
Stutzbach, D., & Rejaie, R. (2006). Understanding churn in peer-to-peer networks. In IMC ‘06 proceedings of the 6th ACM SIGCOMM conference on internet measurement (pp. 189–202). New York, NY, USA: ACM. doi:10.1145/1177080.1177105.
Tang, C., Xu, Z., & Mahalingam, M. (2002). Peersearch: Efficient information retrieval in peer-to-peer networks. Tech. Rep. HPL-2002-198, HP Laboratories Palo Alto.
Yahoo! (2009). Answers. http://answers.yahoo.co.
Yahoo! Labs. (2009). Comprehensive questions and answers version 1.0.
Yang, B., & Garcia-Molina, H. (2002). Improving search in peer-to-peer networks.Distributed Computing Systems. In International conference on 0:5. doi:10.1109/ICDCS.2002.1022237.
Zhang, D., & Lee, W. S. (2003). Question classification using support vector machines. In SIGIR ‘03 (pp. 26–32). New York, NY, USA: ACM. doi:10.1145/860435.860443.
Zhao, B., Huang, L., Stribling, J., Rhea, S., Joseph, A., & Kubiatowicz, J. (2004). Tapestry: A resilient global-scale overlay for service deployment. IEEE Journal on Selected Areas in Communications, 22, 41–53.
Zhou, Y., Cong, G., Cui, B., Jensen, C. S., & Yao, J. (2009). Routing questions to the right users in online communities. In International conference on data engineering (pp. 700–711). doi:10.1109/ICDE.2009.44.
Ziefle, M. (1998). Effects of display resolution on visual performance. Human Factors, 40, 554–568.
Acknowledgments
This work was supported by the Engineering and Physical Sciences Research Council, grant EP/F064330/1. We would like to thank Des Watson and the anonymous reviewers for their help in polishing this article.
Author information
Authors and Affiliations
Corresponding author
Rights and permissions
About this article
Cite this article
Fleming, S., Chalmers, D. & Wakeman, I. A deniable and efficient question and answer service over ad hoc social networks. Inf Retrieval 15, 296–331 (2012). https://doi.org/10.1007/s10791-012-9185-0
Received:
Accepted:
Published:
Issue Date:
DOI: https://doi.org/10.1007/s10791-012-9185-0