
Abstract
In the moment of preparation of this paper, the world is still globally in grip of the Corona (COVID-19) crisis, and the need to understand the broader overall framework of the crisis increases. As in similar cases in the past, also with this one, the main interest is on the “first response”. Fully appreciating the efforts of those risking their lives facing pandemics, this paper tries to identify the main elements of the larger, possibly global, framework, supported by international standards, needed to deal with new (emerging) risks resulting from threats like Corona and assess the resilience of systems affected. The paper proposes that future solutions should include a number of new elements, related to both risk and resilience. That should include broadening the scope of attention, currently focused onto preparation and response phases, to the phases of “understanding risks”, including emerging risks, and transformation and adaptation. The paper suggests to use resilience indicators in this process. The proposed approach has been applied in different cases involving critical infrastructures in Europe (energy supply, water supply, transportation, etc., exposed to various threats), including the health system in Austria. The detailed, indicator-based, resilience analysis included mapping resilience, resilience stress-testing, visualization, etc., showing, already before the COVID-19, the resilience (stress-testing) limits of the infrastructures. A simpler (57 indicator based) analysis has, then been done for 11 countries (including Austria). The paper links these results with the options available in the area of policies, standards, guidelines and tools (such as the RiskRadar), with focus on interdependencies and global standards—especially the new ISO 31,050, linking emerging risks and resilience.
1 Introduction, what is/was really new about COVID-19?
1.1 COVID-19 as “surprise”?
As of April 2020 COVID-19 has “covered” the world (Fig. 1). More than any other crisis before, the Corona crisis comes as probably the most global one so far, not only in terms of geography. The crisis is unique also because it appears to be one of the first globally experienced emerging risks. Affecting resilience of the world and stress-testing the resilience of both the healthcare system and the society as a whole. Did it come as a surprise? Hardly.

The world on April 2, 2020: firmly in the grip of COVID-19 (https://www.google.com/maps/d/viewer?mid=1yCPR-ukAgE55sROnmBUFmtLN6riVLTu3&ll=18.683350789325377%2C52.46303051550274&z=2, accessed on 2 Apr 2020)
Despite the numerous preceding warnings and mentioning of new kind of pandemic risk in the WEF Global Risk Report starting as early as 2006, and the detailed OECD reports (2011a; b), preparedness level of almost all healthcare systems around the globe to fight a pandemic outbreak remained insufficient. The critical mix for a “successful pandemic outbreak” is a fast and efficient human to human transfer of the pathogen where, humans have little or no immunity against it, no vaccines currently exist and supply of antiviral drugs is insufficient or not existing. Most of these can now be seen during the current COVID-19 outbreak. In other words, the outbreak of COVID-19 is not a real surprise, the surprise is linked to its extremely high infection rate allowing a very fast worldwide progression. In the Global Risk Report of 2006 (written after the Avian Flu H5N1 Pandemic in 2003), it is mentioned that if the virus can no longer be contained and person to person infection were to become common place, “the vulnerabilities of our interconnected global system would intensify the human and economic impact. The worldwide spread would be facilitated by global travel patterns and insufficient warning mechanisms. Short term economic impacts would include severe travel impairments, tourism and other service industries, as well as manufacturing and retail supply chains. Deep shifts in social, economic and political relations are possible”. What else could one have added? In its voluminous, almost 300 pages long report, OECD (2003, p. 31) has been forecasting this as follows:
As underlying conditions of risk – from climate to pathogen resistance – change, risk management policies based on past records and experience are likely to be increasingly faced with “surprises”. How to account for evolving conditions will become a central issue in the handling of many risks. This will entail, in particular, a framework for dealing with major uncertainties and gaps in scientific knowledge.
1.2 COVID-19 pandemics as a “global shock”?
Considering pandemics as aspects of public health and infectious diseases as “existential threats” to the society has been embedded already in the United Nations Development Programme (UNDP) of 1994 and reaffirmed in the 2003 UN Commission on Human Security (see OECD 2011b). The report points out, that “survival under a pandemic global shock clearly refers to taking every action to minimize morbidity and mortality as well as to minimize the effect of the pandemic on the economic, social and political stability of communities, nations and transnational organizations”. Furthermore, the authors argue, that the global shock to public health in the form of a pandemic is unique among global shocks in having profound positive and negative externalities and interdependencies. But being officially classified as pandemic by WHO,Footnote 1 would COVID-19 qualify as “global shock”, too? Table 1 shows that it is clearly the case. But six months after the outbreak of COVID-19, it is rather understood and perceived as a “global threat” and the focus is on monitoring of the threat (e.g. Johns HopkinsFootnote 2), media focused on response measures and science unable to make reliable predictions, or even provide consistent explanations.
1.3 COVID-19 as an emerging risk
New, previously unknown or not considered, “emerging” risks can pose the greatest challenges to resilience, safety and operational and business continuity. These “new and/or increasing” risks can be related to different areas of activities, such as new processes, new technologies, new types of workplace, or social or organizational change. They can also be some long-standing issue, newly considered as a risk due to a change in social or public perceptions or due to new scientific knowledge. The increasing nature of these risks means that the number of hazards leading to the risk may be growing, or that the exposure to the hazard leading to the risk is increasing, or that the effects/impacts of the hazards are getting worse (e.g. seriousness of effects and/or the number of people affected). These risks will interrelate with the processes like globalization, digitalization, innovation, cross boundary operations and many others, inextricably, directly or indirectly influencing each other, being interconnected, systemic and/or interdependent.
Starting from the ISO 31000 definition of risk (“effect of uncertainty on objectives”) and understanding risk management as a significant contributor to value creation and preservation, the new "ISO 31050Footnote 3 Guidance for Managing Emerging Risks to Enhance Resilience", currently under development, will contribute to the further enhancement of integrated governance and management processes that provide insight into how risk may affect the achievement of organizational objectives.Footnote 4 An emerging risk, as currently discussed at within work at the new ISO 31050 standard, proposes to define it as a highly uncertain risk which is evolving from events with potential for serious consequences/impacts. There, the term “evolving” refers to changes in the risk understanding related to relevant threat sources, events and their effects/consequences, their likelihood and/or level of and uncertainty associated with background knowledge. Obviously, COVID-19 is in the scope of this definition, but primarily in terms of “potential for serious consequences/impacts”, not in terms of awareness that an event like this may occur.
2 Risk and resilience analysis
The ISO (22300:2018(E)) meta definition of Resilience is ability to absorb and adapt in a changing environment. In the context of critical infrastructures and the SmartResilience project (2016), the definition was first extended to resilience as the ability to anticipate, prepare for, and adapt to changing conditions and withstand, respond to, and recover rapidly from disruption (Linkov 2014, NAS 2012) and then, with inclusion of the ability to understand risks (current and emerging), as the ability to understand risks, anticipate, prepare for, and adapt to changing conditions and withstand, respond to, and recover rapidly from disruption” (Øien et al. 2010). SmartResilience project adopted concept of resilience of an infrastructure (Jovanović et al. 2019a, b) as the ability to understand and anticipate the risks – including new/emerging risks – threatening the critical functionality of the infrastructure, prepare for anticipated or unexpected disruptive events, optimally absorb/withstand their impacts, respond and recover from them, and adapt/transform the infrastructure or its operation based on lessons learned, thus reducing the critical infrastructure fragility (Russoa, Ciancarinia, 2016). This conceptual framework, as an extension of the one of Fox-Lent et al. (2015 and 2018) and Linkov (2018), yields the following main additional advantages:
Including understanding of risk (including emerging risks),
Including optimization, adaptation and transformation,
Allowing to naturally include phases of the resilience cycle and the indicator-based approach within the resilience matrix.
The definition allows analysing behaviour of an infrastructure exposed to an adverse event both during the operation time (e.g. a year) and over the “scenario time” (e.g. during the adverse event, Figs. 2, 3). The approach allows to decompose the overall resilience problem and focus on single relevant resilience issues described by relevant resilience indicators, the values of which allow to quantitatively assign an aggregated value to each “cell” of the resilience matrix (Fig. 4).

The resilience matrix based on five phase and five dimensions as adopted in SmartResilience project (2019)

Possible outcomes in the case of an infrastructure exposed to an adverse event: between improvement and complete failure, e.g. in the case of COVID-19

Example of a resilience matrix showing the resilience level in each cell of the matrix (NOT related to any particular case and not to COVID-19; examples of issues and indicators defining the resilience level are given in 4.2)
- Phase I:
Understand risks, is applicable prior to an adverse event. It emphasizes emerging risks and includes their early identification and monitoring; e.g. what could the “adverse event” be?
- Phase II:
Anticipate/prepare, also applicable before the occurrence of an adverse event. It includes planning and proactive adaptation strategies, possibly also “smartness in preparation”.
- Phase III:
Absorb/withstand, comes into action during the initial phase of the event and shall include the vulnerability analysis and the possible cascading/ripple effects; e.g. “how steep” is the absorption curve, and “how deep” down will it go?
- Phase IV:
Respond/ recover, is related to getting the adverse event under control as soon as possible, influencing the “how long” will it last, question. Further, it includes the post-event recovery; e.g. “how steep up” is the recovery curve for normalization of the functionality?
- Phase V:
Adapt/transform, which encompass all kinds of improvements made on the infrastructure and its environment; e.g. affecting “how well” the infrastructure is adapted after the event, and whether it is more resilient and “sustainable”. The activities in this phase also lead to preparation for the future events and hence, this resilience curve also exhibits a reoccurring cycle.
For each phase, one can define dimensions of the resilience, such as state of physical characteristics, information flow, organization, policies, etc. While defining the “phases” of the resilience cycle (“A”), is usual straight-forward, the decomposition over dimensions (“B”) might be more difficult, as these may overlap very much in practical cases (Fig. 4).
The dimensions help in categorizing the indicators. Dimension (a), system/physical, includes technological aspects of the given infrastructure, as well as the physical/technical networks being part of a given infrastructure, and interconnectedness with other infrastructures and systems. Dimension (b), information/data, is also related to the technical systems but is dealing with information and data, specifically. Further, dimension (c), organizational/business, covers business-related aspects, financial and HR aspects as well as different types of respective organizational networks. Dimension (d), societal/political, encompass broader societal and social context, also stakeholders not directly involved in the operation and/or use of the infrastructure (e.g. social networks). Lastly, dimension (e), cognitive/decision-making, accounts for perception aspects (e.g. perceptions of threats and vulnerabilities, Jovanović et al. 2016).
3 Analysing resilience by means of resilience indicators
In the indicator-based concept (Fig. 5), an "issue" is a general term referring to anything that is important in order to be resilient against severe threats such as terror attacks, cyber threats and extreme weather. It is telling what is important, e.g. it can be "training" performed in the anticipate/prepare phase. Obviously, the more indicators one choses, the better the “coverage” of an issue is going to be, but it is also obvious that the larger the number of indicators, the more complex their handling is going to be. The “way out” has two components and these would be:
finding the “right number” of indicators properly describing given resilience problem tackled (in the usual engineering practice, managed by humans, 120–150 indicators are usually a maximum—the more critical the situation, the smaller the number; in absolute emergency situations humans can hardly look at more than 3 indicators), and
allowing to “drill-down” in cases when one or more indicators need further explanation.

Issues measured by indicators, allow to make the bridge between a given, e.g. measured value of an indicator, and the overall, final Resilience Index & Resilience Cube
The resilience indicators are mainly taken from current practices (standards, guidelines, reports, etc.) within safety and risk management, emergency preparedness, business continuity, etc. and in most cases, they exist already as safety indicators, risk indicators, or similar. Collecting the indicators and applying the approach, the theoretical framework for variable selection, weighting, and aggregation must be defined and the basis for this is the context of the assessment, or scenario.
The value of an indicator can come from, e.g.:
Expert opinion (e.g. during a table-top exercise)
Measured value (e.g. from a monitoring system)
Analysis of big data.
Once in the model, they are, in a general case, normalized and used as scores.
There are two principally different ways (methods) of measuring resilience using indicators as illustrated in Fig. 6.
Method 1 treats the resilience cycle indirectly, as a conceptual model where indicators are used to measure the resilience in each phase indirectly, i.e. without considering the curve describing functionality of the system by means of the resilience curve.
Method 2 models of the shape of the resilience curve (FL-t curve) directly and looks for "macro-indicators" (e.g. maximum loss of functionality, downtime, etc.). In this method, the event is described as an exact scenario, and the time may be referred to as scenario time, as described further below. The model behind the method is illustrated in Fig. 7.

Indirect and direct measurement of resilience

The hierarchical model in method 1
3.1 Analysing resilience over operating time (“indirect resilience assessment”)
In the SmartResilience approach applied in in the research behind this paper, the values of the indicators (at the time of measurement) are based on, e.g. data from monitoring systems, expert opinions and big data analysis. The approach is based on several previous methods, notably the ANL/Argonne method (Fischer 2010), the Leading Indicators of Organizational Health (LIOH) method and the Resilience-based Early Warning Indicator (REWI) method (Øien et al. 2012).
The indicators can be of any type, e.g. yes/no questions, numbers, percentages, portions, or some other type. They are transformed to an equal scale, i.e. a score on a scale from 0 to 5. The indicator scores are aggregated upwards in the six-level hierarchical model ending with an overall resilience level (RIL) of a critical infrastructure (e.g. healthcare system) or an entire area (e.g. a city or a country). If the assessment is repeated (regularly, e.g. annually), the trend curve (RL-T) is obtained. This time (T) may be referred to as operational time and the details on the underlying levels can be drilled-down using visualization (Jovanović et al. 2017).
The calculations are performed bottom-up, but the main part of the assessment is carried out top-down, starting with defining the scope, e.g. a city, region or country (level 1), one or more smart critical infrastructures (SCIs), e.g. the healthcare system (level 2), one or more threats, e.g. pandemic (level 3). The phases (level 4) are fixed as described in Sect. 2. The remaining two levels, issues (level 5) and indicators (level 6) are core concepts in the resilience assessment method.
An "issue" is a general term referring to anything that is important in order to be resilient against severe threats such as a pandemic. It is telling what is important, e.g. it can be "understanding of the threat/ pandemic", "learning from others about COVID-19, e.g. China", "doctors and nurses", "intensive care beds", "respirators", "test equipment", "infection control equipment", "plans for increasing capacity", "plans for restrictions such as quarantine and isolation", etc. The issues can, if necessary, be categorized in various ways, e.g. according to the dimensions in Fig. 2 or some subcategories. Computationally, this can be solved by weights. One or more indicators are used to measure each issue, e.g. "number of intensive care beds available", "number of respirators operational", etc. The issues and indicators for any resilience assessment have to be tailored for a given assessment, e.g. in the case of a pandemic in general, or COVID-19 in specific.
One of the strengths with this method is that every measure (or at least the most important measures) taken before and during (and eventually after) COVID-19 can be described as issues/indicators in the resilience matrix and made more transparent (see Annex 1). The preference for certain measures will of course vary between countries due to, e.g. political, cultural, social, financial and other differences.
3.2 Analysing one resilience cycle (“direct resilience assessment”)
One challenge with this approach is that no matter how intuitively one might say that the critical functionality of an infrastructure is easy to define, in practical terms, especially quantitative, it is usually not. In the case of COVID-19, the healthcare system's critical functionalities are, e.g. to hospitalize all infected persons in need of healthcare, to provide intensive care for those who need this, and to provide respirators for the most critical patients, but also, e.g. continuing to provide adequate care to non-COVID-19 patients. In the SmartResilience concept, these are the functionality elements (corresponding to the “issues” in the indirect method), which can be assessed by functionality indicators, just as in the indirect method based assessment (e.g. the "number of intensive care beds available" can be such an indicator). Defining the functionality this way enables to quantitatively define the resilience curve in scenario time, e.g. for the main characteristic points in time.
Based on the resilience curve (or functionality curve), it is then possible to define the resulting macro-indicators, such as Robustness, Absorption time, Downtime, Loss of Functionality, Fragility (loss of functionality rate × Loss of functionality), Recovery time, Recovery rate, Disruption time, and Adaptation/transformation (Jovanović et. al 2018a, b, c). The resulting macro-indicators (not the input indicators) can also be used for "stress-testing", in which case these can be compared with the critical thresholds, e.g. for the maximum loss of functionality, duration or a combination of these, etc.
A special characteristic of a pandemic like COVID-19, compared to other extreme events, is that it is gradual, long-lasting and may involve several dips in functionality level. This gradual increase in infected population, i.e. the infection rate, is critical to control in order not to overwhelm the healthcare system, i.e. it is necessary to "flatten the curve", as illustrated in Fig. 8. The figure also illustrates that during the preparation phase, the critical functionality (critical resources) can be increased, since all but the first country (China) know that the virus is on its way. In addition, the phases "absorb/withstand" and "respond/recover" are not as clear-cut as in sudden and concentrated events. The same type of representation can also be used to look at the gradual and long-lasting impact of COVID-19 pandemic onto infrastructures (health and others) including the, e.g. multiple shocks of varying degrees of severity occurring to the system over time with different recovery responses (e.g. the often discussed “second wave”).

Flattening of the curve to not overwhelm the healthcare system
4 Application of the approach to assess resilience of a healthcare infrastructure
The approach assumes that the resilience of the healthcare system plays a key role in assessing the overall resilience of other related critical infrastructures. In this sense, looking at healthcare infrastructure means also looking at the society in terms of infrastructure-of-infrastructures, i.e. as an “integrative” case study. The scenario was analysed before Corona (COVID-19) crisis, but de facto considering many its elements. It assumed a threat of a sudden and/or unexpected surge of patients or injured people due to either a mass casualty incident (e.g. water contamination, disasters), or a health problem like epidemic (pandemics such as COVID-19 in an extreme case), or due to an event that renders a substantial fraction of healthcare providers inoperable. The healthcare system of Austria is used as a test case. Experts from the technical direction of Europe’s largest hospital, as well as experts for a data-driven and evidence-based benchmarking and performance measurement of healthcare systems evaluated the threats and provided advice.
4.1 General description of the assessed critical healthcare infrastructure
The Austrian healthcare system encompasses about 20,000 different healthcare providers with services that accounted for 39.6 billion € or 11.2% of the Austrian GDP in 2016. Among these providers are 122 hospitals throughout the country and about 5000 primary care providers that provide services covered by the mandatory social insurance in Austria. The focus is on the General Hospital of Vienna, the largest hospital in Europe and employing about 9000 people and treating around 95,000 inpatients annually (Fig. 9).

Map of Austria with healthcare providers shown as circles (inset: General Hospital Vienna)
The Austrian healthcare system is highly segmented with responsibilities being split up between various regional or national organizations in different health sectors. For instance, responsible for outpatient care in Austria are mostly more than 20 different social security institutions that have recently been restructured into only five institutions. In the inpatient sector, hospitals are managed by regional carrier organizations, next to some exceptions of hospitals that are managed directly by the Republic of Austria. From this fragmentation (presumably an issue in other countries, too) arises the challenge of harmonizing and integrating data from all of these institutions, which is necessary to give a comprehensive picture of the efficiency and resilience of healthcare in Austria. In practical terms, this means that there are databases that integrate these heterogeneous data sources. They include all relevant inpatient and outpatient services (which allows connecting activities in the health sector to other sectors, such as transportation). But, there is no real-time monitoring on a comprehensive, nation-wide scale of such activities and, therefore, no (non-)automatic adaptations to events observed in real time.
Almost all European countries face the challenge of an unsustainable healthcare system. That is, health expenditures typically grow faster than national incomes, which means that on the long run there is only a limited set of options: one either cuts back on medical services provided to the population or cuts back in other sectors, unless dramatic technological developments reduce the future demand for health services. As a consequence of these pressures, healthcare systems are constantly pushed towards operating at their maximal capacity, e.g. in terms of patients treated at hospitals and the occupancy of hospital beds. If the system is already close to its maximum capacity in the normal mode of operations, how will it react in the situations of severe shocks such as COVID-19? How resilient will the system be with respect to sudden and unexpected surges in patient numbers if waiting rooms in outpatient wards and doctor offices are already full? Relevant threats on the routine level (Table 1) therefore include cyber-attacks (rendering some providers non-operational) and natural threats (e.g. urban flooding), yet the methodology that has been developed can be generically applied in all situations where a specific type of healthcare providers faces a sudden and unexpected increase, such as COVID-19 in the number of patients to be treated within a given time span.
4.2 Applying the resilience indicator-based approach
In the particular case, the resilience matrix (5 × 5) was applied taking into account the main issues shown below (per each dimension of the resilience matrix Fig. 2, Tables 1 and 2).
4.2.1 System/physical
-
Understand risks The physical dimension that is relevant for a resilience assessment of the healthcare system corresponds to a city-spanning network of different types of healthcare providers—from hospitals over physicians and medical specialists to pharmacies. In order to provide effective care for patients, multiple of these healthcare providers need to coordinate themselves in their treatments.
-
Anticipate/prepare In the normal mode of operation this system can be characterized by flows of patients between their homes or work places and through different types of providers. To understand risks for such a system means to understand how such these flows change under the particular scenario. Anticipation and preparation on this dimension means to adjust the densities of certain types of provider in specific regions such that the system has a sufficient capacity to provide for the population even in the case of adverse events.
-
Absorb/withstand and respond/recover In the case of emergency response this requires an effective system for triaging patients and routing them according to their level of urgency through the healthcare system following the rules implemented in a so-called patient guidance system.
-
Adapt/transform The procedures in this system need to be continuously adapted and adjusted in order to reflect the “lessons-learned” from past events.
4.2.2 Information/data
-
Understand risks For a quantitative and data-driven understanding of risks in a regional healthcare system, the implementation of a shared, nation-wide system for electronic healthcare records is necessary.
-
Anticipate/prepare This allows to anticipate and to prepare for adverse events through a moment-by-moment quantification of population health and the characterization of the status quo of the utilization of certain types of healthcare providers. From this it is possible to derive key performance indicators that are informative on where potential vulnerabilities exist in the system.
-
Absorb/withstand and respond/recover In the case of an event itself, a permanent monitoring of patient flows at the sites of individual healthcare provider, in particular those involved in emergency response, is key.
-
Adapt/transform These experiences can then be used to refine and update the performance indicator in order to have a “smart” and resilient healthcare system.
4.2.3 Organizational/business
-
Understand risks On an organizational level, such quantitative approaches to risk analysis need to be complemented by suitable qualitative approaches, in particular scenario analysis.
-
Anticipate/prepare In order to anticipate and prepare it is crucial to formulate a plan of action that clearly assigns roles, competences and also hierarchies to different organizations as well as key staff within these organizations. In case of an event the personnel need to follow the procedures set out in the corresponding plan of action.
-
Absorb/withstand In these plans, response measures are typically implemented through extensive checklists.
-
Respond/recover and adapt/transform Regular training and simulation exercises for the key staff are necessary for an adaptive and in this sense learning system.
4.2.4 Societal/political
-
Understand risks To ensure an efficient and suitable allocation of resources and investments in relevant infrastructures is fundamental in the societal/political dimension. An important characteristic of the healthcare system is that a large number of stakeholders are involved on this level (representatives of the inpatient and outpatient sector on a state and federal level, private companies, social security institutions, public and private carrier organizations for hospitals, and so on).
-
Anticipate/prepare In order to understand the risks and prepare plans of action accordingly it is therefore necessary to coordinate all these involved stakeholders.
-
Absorb/withstand and respond/recover In the case of an event and in its wake one of the main priorities for this dimension is to efficiently distribute information to the media, medical staff, but also to relatives.
-
Adapt/transform An adaptation and learning on this level can only be achieved through a redistribution of -mostly public- funds.
4.2.5 Cognitive/decision-making
-
Understand risks The first step in understanding risks is to note that there are crucial differences between the routine mode of operation in the healthcare system and procedures in the case of adverse events.
-
Anticipate/prepare In anticipating and preparing for such events this means to understand which types of mass casualties or disruptions in the operation of certain types of healthcare providers are to be expected.
-
Absorb/withstand In the case of an event the first priority is to identify the relevant threats and then follow the checklists and agreed-upon procedures.
-
Respond/recover and adapt/transform Increased adaptability and learning can be achieved through increasing the coordination between different healthcare provider and stakeholder organizations.
The approach was used in the Austrian federal state (Vorarlberg) with outpatient care provider placed at random locations within their districts (show on map in Fig. 10). The figure (a) shows for one selected provider its dependence relations to other providers as blue lines. The thickness of these blue lines gives estimates for how likely it is that services provided by the selected provider can be substituted by services from the linked providers (which is estimated from the data based on factors like geographic proximity, overlap in patients, type of services provided, etc.). A surge in the number of patients at this provider will overload its capacity and cause secondary effects for the other providers (b), where the levels of redness indicate how much of the initial shock each provider is expected to absorb. As a result, tertiary cascades might occur (c). This kind of assessment can either be done directly “by hand” in the healthcare assessment module developed within the project, or automatically for each doctor and district in Austria. A more detailed description of this stress test of a healthcare system can be found in Lo Sardo et al. (2019). The approach is comparable to those applied to other critical infrastructures (e.g. transportation, Ganin (2017) or epidemic outbreaks (Massaro et al. 2018)). For the inpatient setting, i.e. hospitals, we developed a different assessment module that is, however, based on the same functioning principles and the same indicators. As a concrete scenario here we consider an urban flooding event in Vienna. The initial event is a surge in the number of patients to be treated as an initial impact of the flood (in the current scenario, it was assumed that the subway system is flooded in the morning close to rush hour leading to the load of an entire subway train needing to be transported to the hospital). The assumed situation was further that the flood cuts off access to hospitals at the other side of the Danube, that only become accessible again later in the day, see also Fig. 11.

Test scenario for outpatient care providers: Schematic representation of patient displacement dynamics. a Doctors are represented as nodes (size represents the number of patients treated per year). They are linked if they share patients in the patient sharing network, a (black arrows). The colour represents their current capacity; green means that they have capacity, and red means that they can no longer accept new patients. b Doctor “a” retires at time step 1; his/her patients are distributed to other doctors according to the weights of the links from “a” to “b” and from “a” to “c” (yellow arrows). This, in turn, changes the capacity of the other doctors. c As c has reached its capacity limit (red), he/she must send patients to other doctors (blue arrows from “c” to “b” and “d”). This creates a cascade of patient displacements of size 2

Snapshot of the hospital assessment tool. Hospitals are shown as circles with colours that indicate their free numbers of beds. The shaded areas give regions of equal time to travel to one specific hospital. The tool allows one to simulate an event in a specific place (specified by the time of day, traffic conditions, and the number of injured people) and computes how long it takes to bring each of those people to a free hospital bed. Inset: example of how a scenario can be implemented. By clicking on a specific location and specifying the number of injured people there, the tool estimates the resulting changes in indicator levels for all hospitals
4.3 The exercise
A list of indicators that underlies the above exercise scenario have been developed over multiple workshops and bilateral meetings with key stakeholders in the Austrian healthcare system. During these interactions, the issues and conventional resilience indicators to be used were defined and evaluated, and also the "inner workings" of the healthcare assessment module of the tool assessed. This included the comparison of districts with respect to their Resilience Index Level as well as a more detailed investigation of changes in the functionality level of Vienna's hospital in the case of a large event (see the Functionality Level assessment).
For the development of the assessment module and a proper formulation of the indicators, an end-user driven approach was followed in a series of joint meetings and workshops. One of these specific characteristics of this exercise was the use of a GIS-based assessment module in order to compare all 122 Austrian districts with respect to their resilience levels in the inpatient and outpatient sectors. In particular, based on needs and requirements communicated by the end users, iterative versions of the assessment module were developed, including its underlying data sources, and respective issues and indicators. After an updated version was built, another meeting to discuss progress was set up and further expert input on how to refine the assessment module until a satisfactory state of the tool was achieved as a basis for the assessments. The final scenario was then selected in a table-top meeting exercise where the corresponding numerical simulations were carried out Fig. 12.

Snapshot of the hospital assessment tool. Simulates an event of three concentrations of an adverse event, roughly simultaneous and their impact on possible patient routing to healthcare providers, easily overcoming the normal capacity of the assigned providers
4.4 Main results of the exercise (general case)
The main result of the comparison of all districts of Vienna with respect to their Resilience Index Level is summarized in the Fig. 13. The Resilience Index Level for each district is colour coded on a scale from 0 to 5. Note that the 23 districts of Vienna have been aggregated into a single district for purposes of the visualization, the individual assessment reports of these districts can be accessed via the resilience dashboard. It is evident from the picture above that the resilience level is confounded by geographic proximity, i.e. districts that are close to each other tend to have comparable resilience levels. There is one outlier in terms of low resilience, which is a district in lower Austria with a comparably low healthcare coverage index (i.e. density of primary care provider) that is coupled with a sudden loss in accessibility of primary care services in case of an increased medical needs of the population.

Main result of the first exercise. For each district of Austria (the “tree” on the right side), the resulting score of the resilience assessment exercise is shown on the scale from 0 (red) to 5 (green)—“routine emergencies” (Table 1)
The indicators used include the "unsupervised", big- data-driven indicators that have been evaluated using the assessment modules described above. While a substantial amount of resources went into the exact formulation of these indicators, they have the advantage that they can easily be applied to all Austrian districts once their methodology has been fixed. In order to comprehensively quantify all relevant aspects of resilience as defined by the SmartResilience approach, these big data indicators where complemented with more conventional, "supervised" suitable indicators. Most of these indicators apply across all districts, as the healthcare infrastructure (in particular in the inpatient sector) is operated by a small set of carrier organizations. The most important regional variations however, such as healthcare coverage indicators, numbers of cases, number of available hospital beds, population density in affected areas and such are evaluated in an unsupervised way from big data sources. Only the results from one specific district (Vienna 9th district that contains the country's largest hospital, the General Hospital of Vienna), out of 122 evaluated districts are shown here (Fig. 14, 15). For the remaining districts, the assessment reports containing the data-driven indicators are available in the ResilienceTool.Footnote 5

The 122 evaluated districts in the healthcare system of Austria

One of the results of the stress-test (Sardo et al. 2019): Map of Austria showing the upper bound of the resilience indicator for all districts for a very challenging stress-test scenario. Districts coloured in green (red) have a particularly high (low) resilience: that is, critical removal fractions (Fig. 10)—the map shows significant change compared to the scenario in Fig. 13; note that the stress-test scenario was not of the scale of the COVID-19 one
A further study has been performed by Sardo et al. (2019) looking for the answer to the question, is there a point beyond which these pressures will severely impair the quality of care? Resilience captures how fast and the extent to which it is possible to deliver adequate healthcare services to the entire population in the wake of such an assumed shock (“stress-test”). The questions like the one above were, at the time of working at the study, the assumptions for hypothetical scenario, similar to the COVID-19 one. Although the assumptions for the stress-test were by far less severe than those of COVID-19, the results are showing quite a different picture than the one in Fig. 13.
4.5 Recommendations
The lowest indicator scores, i.e. the largest potential for improvement, can be identified in the use of real-time monitoring tools that aid decision-making, in particular in the response and recover phase. As already mentioned, the healthcare system is particularly robust with respect to the adoption of new technologies. In some areas in healthcare, paper-based record keeping is still the de facto standard, with digital data imputation only occurring as an afterthought in order to claim financial compensation from the social security institution. The consequence is a lack of real-time information on how the current "load" (numbers of patients at specific providers in a given region—a serious problem in COVID-19 pandemic) is distributed at any given time. Rather, one has to infer this knowledge in the simulations from historical data. The main conclusion of this exercise is therefore the need to reinforce investments into developing information flows to ensure that patient-level information is channelled efficiently to all necessary healthcare providers in order to improve the resilience of healthcare systems. This recommendation has been fully confirmed by COVID-19 in Austria.
As the Austrian healthcare system is undergoing a major restructuring, one of the incentives of which is the need to harmonize the provision of medical services across the country. This offers the opportunity to rethink the current processes of collecting and sharing data. In particular, it would be necessary to break up the currently existing silos of data and to enable a comprehensive real-time mapping of activities in the healthcare system. How many beds are right now free in department X within hospital Y? What is the waiting time for treatment Z in region U? While it is beyond doubt that such kind of information is vital to improve resilience of the healthcare system, it must at the same time be taken into account that healthcare data is highly sensitive and needs to be processed accordingly. It therefore requires a unique set of skills to be able to (i) appropriately handle the high-volume dynamic and sensitive data that healthcare systems produce and (ii) have the required domain knowledge to transform this data into actionable knowledge this can ultimately be used to improve population health. A new kind of institutional setup is therefore needed to simultaneously fulfil both needs, as current institutions either lack medical domain knowledge or the skills to handle large-scale dynamic data.
The stress-testing exercise clearly show that the resilience of healthcare systems cannot be described by trivial summary statistics, such as physician density. The resilience can be quantified, e.g. by set of appropriate indicators, and used to aid decisions on optimal allocations and how investments for the increase of regional primary (health)care provide (PCP) densities would be most beneficial. One can estimate the systemic relevance of individual providers and therefore, identify which providers it would be particularly important to keep in place or support immediately (e.g. in the case of COVID-19, the PCPs who have succumbed the infection.
Finally, the analysis confirms in the quantitative terms the common sense knowledge saying that current health systems are designed to deliver more of the “continuous service” than prevention and match for extreme events such as pandemic.
5 Comparing practices in the COVID-19 crisis by means of resilience indicators
5.1 Countries selected for comparison
The countries selected for the comparison were selected based on the importance of their situations, including precautionary and response measures, and based on the availability of dataFootnote 6—it is common knowledge that the numbers related to COVID-19 are collected in different ways and formats, and cannot be compared directly; these arrive with different time delays and all together, are yet to be consolidated for the full-scale scientific analysis. Hence, for the preliminary analysis performed here, the data were collected primarily from online sources, including media. For the sake of traceability, main sources of information are stored in the ResilienceTool (Jovanović et al. 2019a, b, Fig. 16).

Countries analysed by the ResilienceTool
5.2 Results per country
In the ResilienceTool, the countries are set up as one COVID-19 case study, following the project scenario. So far, all the countries (Fig. 17) follow the same scenario, while country specific variances may be set up in the future, as more information becomes available. For the selected scenario, a dynamic check list of 57 indicators was established. Again, as for the selection of countries, it was not always possible to use the most interesting indicators (e.g. number of doctors and medical staff affected or dead)—the data for the values of these were simply not available. The sources consulted were taken as available. The results are organized on several levels per country:
- Level 0:
-
RLI-based (resilience level indicator)—Fig. 17
Fig. 17 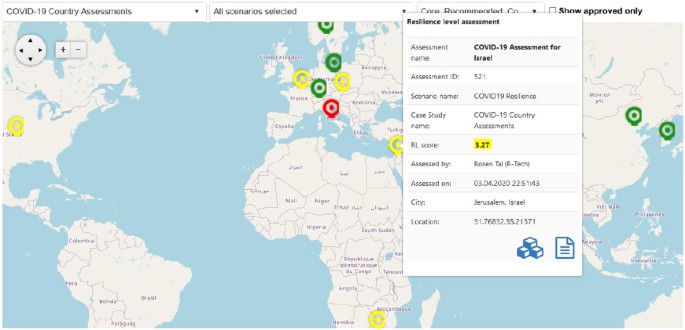
Countries covered by this resilience analysis (“level 0”)
- Level 1:
-
Resilience phase indicators based—Fig. 18
Fig. 18 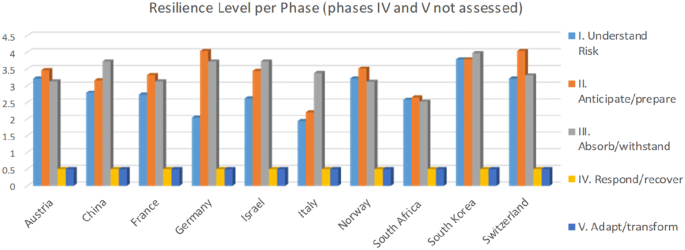
The resilience phase results (“level 1) per country
- Level 2:
-
Resilience matrix based—Table 3 and Annex 1
Table 3 Resilience matrix based (“level 2”) results per country (example of Austria, full report in Annex 1, the RLI is given in the matrix) - Level 3:
-
Detailed description Table 4 and Annex 2 (example China)
Table 4 An example of the summary report per country (“level 3 report”): example of two countries, two indicators, https://www.c19hsrm.org/searchandcompare.aspx - Level 4:
-
Full reports—Fig. 19 and Table 5
Fig. 19 
An example of sites putting together full-scale sources (e.g. full reports—“level4”) related to COVID-19 (here: the EU The Health System Response Monitor (HSRM) https://www.c19hsrm.org/searchandcompare.aspx)
Table 5 An example of the summary report per country (“level 3 report”: the list composed out of 57 indicators; no values for the indicators covering recovery and adaptation phases provided)


6 Identifying and understanding emerging risks related to COVID-19
COVID-19, as discussed in chapter 1.3, cannot be considered as a “pure breed” emerging risk. But as a phenomenon and cause of further emerging risks, it affects the global risk and resilience management by:
changing both the internal and external context,
exposing huge lack of valid relevant information and knowledge, the potential for established information to become invalid as the context changes and the possibility of misinformation becoming common in the new context,
causing impact that the new context may have on the control environment, specifically noting that an emerging risk may jeopardize the current control environment (e.g. the healthcare infrastructure in case COVID-19), or require new thinking in terms of controls that must be applied,
being systemic in its nature and multidisciplinary in its character, and
being of transnational or sector or system transgressing nature.
As a risk with low likelihood (frequency), but high impact on human health, safety security, the environment or the resilience of the society, and as summarized in Table 6, it fits the criteria specifying differences between a risk that is already subject to appropriate control and an emerging risk. The process of “maturation” of emerging risks shows that the organization should look at the emerging risks initially, looking at weak signals and giving due consideration to the potential for future impact and speed of change rather than fixate on current impact.
For an emerging risk, it is necessary to consider the main characteristics describing its emerging character: the accumulation of the available knowledge/information about it, i.e. its maturation with time. In most of the cases, the evidence collected will be heterogeneous and incomplete, often contradicting, and it is therefore necessary to ensure that each piece of evidence is stored in a structured manner, in order to obtain a meaningful and consistent picture of an emerging risk as soon as possible.
Practically, it is assumed that a risk “starts” as an emerging risk, when the first indication (e.g. a “weak signal”) is recorded for the first time. After that, any new evidence (notion), further early warnings, indications, signals, precursors, incidents, etc., recorded and processed will contribute to the process of maturation of an emerging risk.Footnote 7 This may lead to first anticipated scenarios, usually formulated by potentially involved stakeholders, who start to feel threatened by these scenarios. If these scenarios start to materialize more frequently, further development (maturation) might lead to the creation of interest groups leading to actions to clarify and/or prevent the emerging risk. Once this process leads to, e.g. new or changed regulation, legal decisions and similar, one can talk about fully emerged risk, fully included into the scope of known, and thus conventional, risks.
Although the maturation of an emerging risk does not necessarily need to have a constantly ascending character and the initial indication may end up by becoming false (e.g. no occurrences happen or counter evidence becomes available, the maturation process starts decaying and the emerging risk, eventually, disappears), the early identification of early warnings is extremely important. One way of capturing these early warnings, is the risk radar (Fig. 20), as applied to COVID-19. The COVID-19 related events should be monitored in order to ensure business continuity and the respective warnings properly aggregated, classified and visualized for the stakeholders. Thus, it enables stakeholders to discuss early on, what the intended and unintended effects of the developments may be.

Risk Radar tool applied to the Corona/COVID-19 issue: Web-semantics based analysis identifying the issues of interest and potential new risks, including main sources (on the right); the numbers indicate risks; the vicinity to the centre of the radar (Steinbeis 2020) corresponds to their importance; here the risks resulting from analysis of expert opinions extracted from the course on the risk
The Risk Radar tool has been applied to scan, monitor and visualize the ever-growing volume of online data on COVID-19. The tool utilizes a purely content-based methodology to rank a set of publicly available documents (news articles, blog posts, abstracts from scientific journals etc.) according to their potential to generate impact. The tool considers the textual data over a period of time for a given topic, uses this information to perform data analytics to rank the relevance or importance of the documents and related keywords based on document centrality. Centrality is a simple indicator for gauging the impact of the document that captures the frequency of the terms, but also how these terms are related to each other. The tool yields the Radar and a Network map. The former includes a list of risks-related keywords on a radar-like widget, along with the list of sources used for extracting and ranking these keywords. The position of the keywords (shown in yellow dots) on the radar indicates its importance where the closer to the centre the term is, the more “relevant” a keyword is in documents related to the COVID-19 coronavirus analysis. The Network map includes a short description of the topic (shown in green circle) connected to the most common keywords (shown in blue circles) and the articles (in colours of red, orange and yellow). The colour and size of the collected articles are designated based on their relevance; the larger circle has the highest applicability to the topic.
By looking at different sources (e.g. “science (Fig. 20), “media” and “public” (Fig. 21)) the system identifies the topics of interests in the information parsed (web pages, blogs, publications, reports…) and assigns them the respective risk scores according to the criteria set (e.g. sentiment, credibility of source, context, etc.). The early warning is identified on the basis of the relation of the terms in search, not on simple “word bagging”. The radar-like visualization is based on the semantic network in the background allowing user to drill-down to the initial source of information and obtain the background information (e.g. the full-text report). An example is shown in Fig. 22, accidentally showing the predictive character of the methodology and the tool: the screen shot made on March 30, 2020 was identifying as risk, which in fact materialized 7 days later.

Risk Radar tool applied to the Corona/COVID-19 issue: comparison between press and media (left) and public www sources (right)

Risk Radar tool applied to the Corona/COVID-19 issue: Web-semantics based analysis identifying the issues of interest and potential new risks, including their sources in www-snapshot made 7 days before Boris Johnson was hospitalized (Steinbeis 2020)
7 Interdependencies and scenarios: COVID-19, health, economy, society, acceptance…
As shown by Klimek et al. (2019) modern macro-economic theories can be of limited usability to predict the duration and the recovery rate of a crisis (Fig. 23). Predicting the outcomes and recovery from COVID-19 global crisis will be an even greater challenge.

Visualization of response curves. a An impulse shock of unit size is applied in year t = 2014 to every sector, i, in the USA. In response, the output of each sector is driven from its equilibrium value. b Every line corresponds to one of the 30 largest sectors, ordered according to their susceptibility to the shock (i.e. the area between the response curve and the dotted line that represents the equilibrium value). The sectors with the largest impact are public administration, real estate activities, human health, and wholesale trade. On the other end of the scale one finds the construction sector, that after the initial shock profits from the disruptive event. Depending on the sector, full economic recovery might take up to 6–10 years (Klimek et al. 2019)
This analysis has to focus on resilience as a non-equilibrium property of networked complex systems (example: the system looking simultaneously at health, economy/production and social acceptance) and develop a response model including all relevant factors, similarly to the framework based on the theory for input−output economics. In the example of such a model calibrating the framework to data from 56 industrial sectors in 43 countries between 2000 and 2014 (Fig. 23), it was possible to model the susceptibility of individual industrial sectors to economic shocks across countries, sectors, and time. In this work we proposed an analytic approach to compute the susceptibility of a given sector in a country to shocks from other countries and sectors. Predictions based on these susceptibilities outperformed thus, by far, standard macro-econometric time series models. They are analytically more rigorous, empirically more testable, and flexible enough to address even highly uncertain non-linear policy-relevant scenarios, as shown at the example of the impact of the, in 2019, imposed tariffs on US imports (steel and aluminium) on specific sectors across European countries. This clearly speaks for use of these methods also in the prediction of interdependencies (e.g. those among health, economy and society) in the prediction of the COVID-19 related recovery. In the same context, the recovery will obviously be part of the resilience cycle, involving the phases described in chapters 2 and 3. Applying the method described in chapter 3.2 and assuming the values of some of the (currently extremely volatile) indicators, one can model the scenarios and the interdependencies as shown in Fig. 24 and 25.

Functionality graphs for three representative aspects of Societal Resilience: Healthcare sector, Financial sector and Society-as-an-Infrastructure. The scenario estimates a time horizon of just over a year, similar to previous outbreaks in 2002 and 2009, and projects one reemergence of COVID-19, as a worst case, given the lack of current data on possible treatments. The GDP-data forecast is from German sources (Der Spiegel 15/2020). The Acceptance level indicates the estimated loss of functionality which is still considered tolerable by society, as defined by the state. Each functionality curve represents its segment as a whole, i.e. Financial systems, including stability indicators as well as debt, recovery programs, etc. Special note is given to Social Infrastructure as it relies often on perceptions and expectations that are not necessarily founded on facts

The “Resilience landscape” corresponding to the scenario in Fig. 24
In all scenarios and considerations, one will certainly have to take into account the acceptance levels (equalling to the limits in the stress-tests) and modelling these will be a challenge of its own. The acceptance analysis will have to take into account the risk perception aspects, as an issue playing an ever increasing role in all the considerations to COVID-19, too. The question remains: what is needed to make early warning and risk perception a better tool for disaster prevention? Or why do leaders, during an event, announce quickly that more investments are needed, but as the effects of the outbreak fade original plans fade as well.
Taking the example of Switzerland, each of its 26 Kantons is supposed to do disaster planning based on the risk report and the scenarios issued by the federal Bundesamt für Bevölkerungsschutz (BABS). Key elements to support the transition of risk analysis to disaster prevention is the risk dialogue among the involved parties on all the political level as well as on the expert and citizen level. Based on the risk analysis and the risk dialogue capacity planning, on the community, canton and state level, as well as on a company /SME level, should be conducted. Thereby the threat of a pandemic spread is one of the biggest risks, but by far not the only risk, that requires preparation. Therefore, each of the disaster prevention plans should be aligned with Safety policy and strategy of the Swiss Government. In the case of COVID-19, it is apparent that the virus does not stop at national boarders and joint multinational efforts are needed to generate the necessary capacities to prepare and fight the virus. But, all disaster prevention measures come at a price. In this context, the returns on safety investments are hard to quantify and most often do not generate a return within a short time frame. Creating /engineering more resilient systems, cities, societies, healthcare systems require a political discussion about how much safety does one want and how much is it going to cost.
8 International risk and resilience standards relevant for COVID-19 risk and crisis management
The main calling of the relevant ISO standards (ISO 31,000 series and 223xx series, Fig. 26) is to provide universal, yet meaningful guidance on developing new competencies and business models to create relevant and realistic recommendations in an ever-changing uncertain world. Risk enters every decision in life, but clearly some decisions need a structured approach and the more complex and uncertain the issues, the more an adaptive and comprehensive policy, framework and processes are required. Dealing with risk is part of governance and leadership. These considerations are at the heart of ISO 31,000, Risk management—Guidelines, which delivers a clearer, shorter and more concise guide that will help organizations use risk management principles to improve planning and make better decisions.

Managing risk and resilience under the umbrella of ISO
In the standard, risk is defined as the “effect of uncertainty on objectives”, which focuses on the effect of incomplete knowledge of events or circumstances on an organization’s decision-making. This requires a change in the traditional understanding of risk, forcing organizations to tailor risk management to their needs and objectives—a key benefit of the standard. The framework supports all activities, including decision-making across all levels of the organization. The ISO 31000 framework and its processes should be integrated with governance, strategy and management systems to ensure consistency and the effectiveness of management control across all areas of the organization. This includes strategy and planning, organizational resilience, IT, corporate governance, human resources, compliance, quality, health and safety, business continuity, crisis management and security. All of which are relevant to responding to a pandemic. Resilience is built on understanding current and emerging risk and building the adaptive and responsive elements of the organization to deal with the risk one knows and anticipate, through a resilience strategy to address both the known and unknown “Knowns” and the known and unknown “Unknown”. The application is supported by the methodologies available in IEC/ISO 31010 Risk Management—Risk assessment techniques, providing guidance on the selection and application of techniques for assessing risk in a wide range of situations.
With the new ISO 31050, currently under development, the decision makers will be better equipped to manage both known (ISO 31000) and emerging risks (ISO 31050). To this aim, ISO 31050 will deliver structured context (e.g. definitions, drivers, metrics, etc.), emerging risk management framework, the procedure, the guidance for common format(s) for interoperability and indicators. It will also deliver emerging risk application examples in the informative annexes of the standard. The recommendations of the standard should facilitate best practices, enhance resilience, promote agility, assist transformation, deliver insight, insure foresight, establish value and integrate resources—also for enhancing resilience of critical infrastructures. The standard is monitored by the ISO Technical Committees TC262 and TC292.
9 Conclusions—preparing for “COVID-2.0”
9.1 Will the “how” become more important than “what”?
As in the preceding cases of pandemics-like events and other disasters and shocks, also in the case COVID-19 crisis, the recommendations, related to future cases (“COVID-2.0”) for the future actions and measures start appearing in parallel to the crisis. But before looking for the new ones, for the “lessons learned” and “new agendas”, it might be useful to look at the inheritance from the past. Especially the organizations like UN (1994), WEF (2006, 2007, 2008, 2009, 2010, 2011, 2012, 2013, 2014, 2015, 2016, 2017, 2018, 2019, 2020), OECD, IRGC (2010, 2011) or WHO have provided a number of seminal documents of the kind, focused around the idea that the new threat of breakdown of essential systems. What needs to be done? Improve effective monitoring and communication of virus activities, coordination of response and mitigation by different countries, research and development for new vaccines, building capacity for vaccine production, improve supply chain readiness and cooperation, improve emergency communication, transport and treatment infrastructure and adjusting the coordination pf public and private resources to mitigate a pandemic. A simple check shows that the most of the recommendation made in the reports above, some of them almost two decades old, still fully apply (e.g. OECD 2003), as for instance, in the case of COVID-19:
- 1.
Adopt a broader view on risk
- a.
Enhance multidisciplinarity in risk assessment and management
- b.
Consider communication needs of different target groups as an integral part of risk management and provide a concing rationale for jutsifying levels of acceptance
- c.
Detect changes in the risk landscape early
- a.
- 2.
Examine the consistency of policy across risk areas… etc.
… but are not fully implemented, not only at the global, but also at the regional and national levels. Similarly, the results of the analysis covering over 25 years of experience in the area of pandemics (provided in OECD 2011b) are still far from being implemented. Hence, when talking about COVID-2.0 one should consider finding the reasons for non-implementation and look that known “whats” are accompanied by the respective realistic and implementable “hows”. The main “hows” proposed by this paper are.
- 1.
to focus more onto the extreme phases of the resilience cycle, namely onto
- a.
the phase of emerging risks and
- b.
the phase of adaptation and transformation
- a.
- 2.
to use more the resilience indicators as a part of
- a.
international benchmarking and
- b.
improved communication for facilitating consensis on accepctance levels and intervention points
- a.
- 3.
better align and standardize best practices globally, primarily
- a.
the approaches, principles and methods (e.g. by means of international standards) and
- b.
the tools and ways for dealing practically with practically with crises like COVID-19
- a.
9.2 Challenges
The list of challenges which preparation for the next round and implementation of the numerous lessons learned (the flood of which is certainly to be expected after COVID-19 crisis) will necessarily need to look at the issues such as.
-
Global management of resources
-
Global managing of the dynamic of pandemic (and other global shocks)—because the strategies based on time (e.g. postponing or flattening of curves) can be the only, albeit, almost “medieval” available strategy in face of completely new threats or new combinations of known threats (e.g. the 2020 combination of drought and COVID-19 in Chile)
-
New ethics of disaster management—questioning the principles embedded in traditional approaches
-
New understanding of established social categories likeun
Privacy vs. need for surveillance,Footnote 8 data protection, and related issues
Work and employment
Return on Safety Investment
(What is the value of ICU and excess ventilators in times of no epidemic/pandemic spreads?)
-
Appropriate narratives for communication targeted towards different cultures, societies and vlaue groups (global “emoticons” in crisis communication, such as black swans, grey rhinos, tigers & flies, etc., familiar in some parts of the world were hardly used or misunderstood elsewhere; the society relying always more on condensed information, might be needing more of these in the future)
-
Need to quantify and stress the unknown future (and be caught by surprise, Sechrist 2019)
-
Focus on functionality, not assets or infrastructures (CISA 2019)
-
Fight misinformation and misuse of disaster related information for political or similar purposes
-
Actively work on the agility of the society as a whole—especially on hyper-long and extremely complex supply chains, global infrastructures (infrastructures-of-infrastructures) exposed to complex systemic risks
9.3 Use of indicators
The analysis in the paper is largely based on indicators and the paper shows how such an approach can be used in a case like COVID-19. But when using this approach, one should be always aware of the limitations linked to the indicators and approaches based on them. This should be a part of the subsequent analysis, but already so far, the above analysis has faced a number of non-trivial issues, the main (“top 5”) of which should be mentioned here:
- a.
The 57 indicators used in the sample analysis were, were hardly giving a complete picture of COVID-19 related the complex situation in the respective countries;
- b.
The definitions of these indicators in different countries were by large not the same (e.g. the definition of an “intensive care unit bed”—e.g. including the ventilation capacity or not);
- c.
The acquired values of indicators (cf. Figure 5 and Fig. 7) were acquired in different ways (e.g. the number of deaths—including the care home deaths or not—leading to large differences in the UKFootnote 9) and are, generally, more difficult to obtain for the indicators being most interesting;
- d.
The values of indicators in a check list, no matter the effort, are practically always referring to different points in time and are often different in character (e.g. interval vs. cumulative)
- e.
The (perceptual, cognitive and contextual) salience of indicators, their efficiency, as well as their independence of each other and capacity to discriminate differences (e.g. among countries in COVID-19 crisis), remain to be explored in future research.
The above issues are, obviously, not COVID-19 specific. But, in this analysis, it came as a surprise to see how readily these issues were forgotten in comments and discussions taking place during the COVID-19 crisis: the (generally few) available ones were readily used.
9.4 COVID-2.0 as a case of both risk and resilience consideration
COVID-19 was foreseen: WEF published various articles about pandemic risk estimating the impact, always in the range of more than one million deaths and a likelihood of occurrence between 1 and 10% (see reports in the last decade). Uncertainty about the nature of a potential outbreak persisted.
In the Global Risk Report 2010 the situation remained similar, indicating lack of preparedness for pandemics on international and on state and corporate levels. In the 2013 Global Risks Report, the focus was put on the danger of on human hubris on health. Despite the big successes in the management of new diseases and the containment of recent pandemic (SARS, Avian Flu, Swine Flu) we still face rising rates of chronic illnesses killing millions of people each year and we are “never far from the edge of a catastrophe, as new biological mutations will eventually overcome a prior human innovation”. In the subsequent year, Global Risks Report was reporting that pandemic spreads could lead to decreased social stability and dysfunctional cities. Considering the fact that over 3 billion people are living in the world major cities, communicable disease may spread faster and our healthcare systems might be heavily overloaded. Interestingly the most recent reports WEF mentions the risk that global supply chains might be too lean and that they are vulnerable to systemic risks e.g. to a pandemic.
Similarly, in 2015 The Swiss Government issued the report “National Risk Analysis of Disasters and Emergencies in Switzerland” (Swiss Federal Office for Civil Protection, Brem 2015). The Risk Report provide a Risk Analysis, methodology and hazard catalogue with hazard files. As one of the top risks, actually the 2nd highest, “Pandemic” was identified. But these and other numerous warnings have led to few practical actions, both globally and locally and globally—COVID-19, when it came, has been generally perceived as surprise.
The above blurs the hope that there will be to many “lessons learned” from COVID-19 for “future COVID’s”. On the contrary, many side-phenomena, such as flood of fake news, wide spread of conspiracy theories, and/or use of the crisis for “politicking”, are probably here to stay. The same applies the lasting consequences of some of the solutions applied during the crisis. The quarantine enforcement will certainly stop once the crisis is over, but people’s contact tracing, flow modelling, social-graph making and other and tools applied in the crisis will probably not. These are likely to have deep and lasting impact on civil liberties on all scales, especially when combined creeping changes in change in ethics, caused by the enforced choosing among the patients to be treated (or not) in the peaks of the crisis.
The research performed here, although based on very scattered and largely preliminary unverified (manly online) data, has as the main goal to show the validity of the approach applied, the approach based on.
improved management emerging risks
broad use of resilience indicators
new way of analysis of interdependencies and
relying on international standards
will help to prepare better for future crises (“COVID-2.0”). The research was looking primarily at the health infrastructure, but is has.
partly tackled also the economy/financial infrastructure and
(in the area of indicators used) the societal/political one.
These are areas where future research is certainly needed and, when made, will bring new insights clearly needed. Nevertheless, research has, however, indicated some of surprising sides of the COVID-19 crises: at least as of April 2020, the world has shown a surprising level of resilience—serious difficulties, yes, but no collapses of the health infrastructure. Some political disturbances were recorded, but no social unrest (possibly looming for the time of the economic ripple effect of the health crisis). The rather optimistic self-assessments of own performance were rather the rule then exception (see Annexes) and the expectations that the world will overcome the COVID-19 crises were high. But for overcoming COVID-2.0 of tomorrow, one will probably need more: the threats are going to become more sophisticated and the complexity of the society and its vulnerability increase.
Notes
The development of the standard is assigned to the Joint Work Group ISO/TC 262/JWG 01 "Joint ISO/TC 262—ISO/TC 292 WG; Managing emerging risk" of the Technical Committees TC262 and TC292. The work started in June 2018, taking DIN SPEC 91299 (CWA 16649, 2013), the work of the ISO TC292 (ISO 223xx standards, especially 22300 and 22316) and the works of organizations such as OECD, SRA, WEF and EU (projects iNTeg-Risk, SmartResilience and ResiStand) as main references.
An interesting point could be if the availability of data in itself is an indicator of how resilient the country might be to pandemic, reflecting the state of healthcare informatics accuracy and flow?
References
Barzelay U, et al (2018) SmartResilience D3.5: interactive visualization as support to indicator-based decision making. EU project SmartResilience, Project Nr. 700621 (2016–2019), IBM Research, Haifa, Israel
Brem S, Hohl M (2015) The National Risk Analysis of Disasters and Emergencies in Switzerland. Federal Office for Civil Protection, Bern, Switzerland https://www.babs.admin.ch/en/aufgabenbabs/gefaehrdrisiken/natgefaehrdanalyse.html
Caillard B, et al (2019) SmartResilience D7.5: final technical, financial and societal impact report. EU project SmartResilience, Project Nr. 700621 (2016–2019), EU-VRi, Stuttgart, Germany
CISA (2019) Stakeholder risk assessment and mitigation. Washington DC. https://www.cisa.gov/stakeholder-risk-assessment-and-mitigation
Davis C, et al (2018) SmartResilience D5.9: resilience joint evaluation and test report (JET report) for the case study "SmartResilience Project: GOLF: Cork City, EU project SmartResilience, Project Nr. 700621 (2016–2019), Cork City Council, Cork, Ireland.
Der Spiegel (2020) Issue 15/2020 “Das Corona Domino” p 8
DIN CWA 16649 D / DIN SPEC 91299: Managing emerging technology-related risks; English version CWA 16649 (2013)
Fisher RE, Bassett GW, Buehring WA, Collins MJ, Dickinson DC, Eaton LK, Peerenboom JP (2010) Constructing a resilience index for the enhanced critical infrastructure protection program. Argonne National Laboratory, Decision and Information Sciences Division, ANL/DIS-10–9, Argonne, IL, USA. https://www.ipd.anl.gov/anlpubs/2010/09/67823.pdf
Fox-Lent C, Bates ME, Linkov I (2015) A matrix approach to community resilience assessment: an illustrative case at Rockaway Peninsula. Environ Syst Decisi 35:209–218
Fox-Lent C, Linkov I (2018) Resilience matrix for comprehensive urban resilience planning. In: Resilience-oriented urban planning. Springer, Cham, pp 29–47
Ganin et al (2017) Resilience and efficiency in transportation networks. Sci Adv 3(12):e1701079
iNTeg-risk early recognition, monitoring and integrated management of emerging, new technology related risks (Risk Radar), EU FP7 project Nr. 213345. https://www.integrisk.eu-vri.eu/
IRGC (2010) Emerging risks: sources. Drivers and Governance Issues, Geneva. https://doi.org/10.5075/epfl-irgc-228190
IRGC (2011) Improving the management of emerging risks: risks from new technologies, system interactions and unforeseen or changing circumstances, 2nd edition. Geneva. https://irgc.org/wp-content/uploads/2018/09/irgc_er2conceptnote_2011.pdf
ISO 22300: Security and resilience—Vocabulary
ISO 22301: Societal security—Business continuity management systems—Requirements
ISO 22313: Societal security—Business continuity management systems—Guidance
ISO 22316: Security and resilience—Guidelines for organizational resilience
ISO 27000: Information technology—Security techniques—Information security management systems—Overview and vocabulary
ISO 31000: Risk management guidelines. https://www.iso.org/iso-31000-risk-management.html
ISO/IEC 31010*IEC/ISO 31010: Risk management—risk assessment techniques
Jovanović A, et al (2016) SmartResilience D1.2: analysis of existing assessment resilience approaches, indicators and data sources: usability and limitations of existing indicators for assessing, predicting and monitoring critical infrastructure resilience, EU project SmartResilience. https://www.smartresilience.eu-vri.eu, Project No. 700621 (2016–2019), EU-VRi, Stuttgart, Germany.
Jovanović A, Bellini E (eds) (2017) Aligning the resilience-related research efforts in the EU-DRS projects, Joint Workshop DRS-7&14 projects, Brussels, Steinbeis Edition, Stuttgart, Germany. ISBN 978-3-95663-143-6 2017, p 165
Jovanović A, et al (2018a) SmartResilience D3.3: modeling the impact of an adverse event on the "absorb" and "recover" capacity of a smart critical infrastructure, based on resilience indicators. EU project SmartResilience, Project Nr. 700621 (2016–2019), Contact: EU-VRi, Stuttgart, Germany
Jovanović A, et al (2018b) SmartResilience D3.4: monitoring resilience and optimizing the resilience-oriented multi-criteria decision-making (MCDM), EU project SmartResilience, Project Nr. 700621 (2016–2019), Contact: EU-VRi, Stuttgart, Germany
Jovanović A, et al (2018c) SmartResilience D3.8: assessing resilience level of smart critical infrastructures based on indicators. EU project SmartResilience, Project Nr. 700621 (2016–2019), EU-VRi, Stuttgart, Germany
Jovanović A, Jelic M, Rosen T, Klimek P, Macika S, Øien K (2019a) SmartResilience D3.7: "The resiliencetool" of the smart-resilience project. EU project SmartResilience, Project No. 700621. https://www.smartresilience.eu-vri.eu/sites/default/files/publications/SmartResD3.7.pdf
Jovanović A, et al (2019b) SmartResilience D3.7: the ResilienceTool" of the SmartResilience project (T3.7). EU project SmartResilience, Project Nr. 700621 (2016–2019), EU-VRi, Stuttgart, Germany
Klimek P, et al (2018) SmartResilience D5.5: resilience joint evaluation and test report (JET report) for the case study SmartResilience Project: CHARLIE: Healthcare system. EU project SmartResilience, Project Nr. 700621. https://smartresilience.eu-vri.eu/sites/default/files/publications/SmartResD5.5.pdf
Klimek P, Poledna S, Thurner S (2019) Quantifying economic resilience from input–output susceptibility to improve predictions of economic growth and recovery. Nat Commun 10:1677. https://doi.org/10.1038/s41467-019-09357-w
Klimek P, et al (2018) SmartResilience D2.3: report on interdependencies and cascading effects of smart city infrastructures. EU project SmartResilience, Project Nr. 700621 (2016–2019), EU-VRi, Stuttgart, Germany.
Linkov I et al (2014) Changing the resilience paradigm. Nat Clim Change 4:407–409
Linkov I et al (2018) Tiered approach to resilience assessment. Risk Anal 38(9):1772–1780
Massaro E, Ganin A, Perra N, Linkov I, Vespignani A (2018) Resilience management during large-scale epidemic outbreaks. Sci Rep 8(1):1859
NAS National Academy of Science (2012) Disaster resilience: a national imperative disaster resilience: a national imperative committee on increasing national resilience to hazards and disasters. The National Academies Press, Washington, DC. http://www.nap.edu/catalog.php?record_id=13457
OECD (2003) Emerging systemic risks in the 21st Century, Paris. ISBN 92-64-19947-0 https://www.oecd.org/governance/risk/37944611.pdf
OECD (2011a) OECD Reviews of risk management policies; future global shocks, improving risk governance, Paris. https://www.oecd.org/governance/48329024.pdf
OECD (2011b) OECD reviews of risk management policies; future global shocks, “pandemics”. IFP/WKP/FGS(2011)2, Paris. https://www.oecd.org/fr/gouvernance/risques/Pandemics.pdf
Øien K, Massaiu S, Tinmannsvik RK (2012) Guideline for implementing the REWI method. Resilience based early warning indicators. SINTEF report A22026. https://www.sintef.no/globalassets/upload/teknologi_og_samfunn/sikkerhet-og-palitelighet/sintef-a22026-guideline-for-implementing-the-rewi-method.pdf
Øien K, Massaiu S, Tinmannsvik R K, Størseth F (2010) Development of early warning indicators based on resilience engineering. Paper presented at the international conference on probabilistic safety assessment and management (PSAM10), Seattle, USA, 7–11 June 2010
Øien K, et al (2017) SmartResilience D3.2: assessing resilience of SCIs based on indicators. EU project SmartResilience, Project Nr. 700621 (2016–2019), EU-VRi, Stuttgart, Germany
Øien K, et al (2018) SmartResilience D3.6: guideline for assessing, predicting and monitoring resilience of smart critical infrastructures (SCIs). EU project SmartResilience, Project Nr. 700621 (2016–2019), EU-VRi, Stuttgart, Germany.
ResiStand: Increasing disaster resilience by establishing a sustainable process to support standardisation of technologies and services. EU H2020 project Nr. 700389. https://www.resistand.eu/
Russoa D, Ciancarinia P (2016) A proposal for an antifragile software manifesto. In: Shakshuki E (ed) Procedia computer science, vol 83, pp 982–987. https://doi.org/10.1016/j.procs.2016.04.196
Sardo DRL, Thurner S, Sorgerb J, Duftschmide G, Endelf G, Klimek P (2019) Quantification of the resilience of primary care. PNAS 116(48):23930–23935. https://doi.org/10.1073/pnas.1904826116
Sechrist M (2019) Predict and prepare for tomorrow’s threats. Paper presented at the flavor & extract manufacturers association annual leadership conference, Naples, USA, 6 May 2019. https://www.femaflavor.org/convention/2019annual/schedule/
SmartResilience: Smart resilience indicators for smart critical infrastructures. EU H2020 project Nr. 700621. https://www.smartresilience.eu-vri.eu/
Steinbeis (2020) Risk radar tool (A Jovanović, M Jelic, S Chakravarty, B Caillard). https://www.risk-technologies.com/home.aspx?lan=230&tab=1&itm=1&pag=12. Accessed March 31, 2020
United Nations Development Programme (1994) United Nations Human Development report, 5th edn. New-York. ISBN: 0-19-509170*1 https://hdr.undp.org/sites/default/files/reports/255/hdr_1994_en_complete_nostats.pdf
Vollmer M, et al (2016) SmartResilience D1.1: initial framework for resilience assessment. EU project SmartResilience, Project Nr. 700621 (2016–2019). EU-VRi, Stuttgart, Germany.
World Economic Forum Global Risks Report (2006) The global risks report, 1st edn, Geneva. https://www3.weforum.org/docs/WEF_Global_Risks_Report_2006.pdf
World Economic Forum Global Risks Report (2007) The global risks report. 2nd edn, Geneva. https://www3.weforum.org/docs/WEF_Global_Risks_Report_2007.pdf
World Economic Forum Global Risks Report (2008) The global risks report, 3rd edn, Geneva. https://www3.weforum.org/docs/WEF_Global_Risks_Report_2008.pdf
World Economic Forum Global Risks Report (2009) The global risks report, 4th edn, Geneva. ISBN 92-95044-15-0 https://www3.weforum.org/docs/WEF_Global_Risks_Report_2010.pdf
World Economic Forum Global Risks Report (2010) The global risks report, 5th edn, Geneva. ISBN 92-95044-31-2 https://www3.weforum.org/docs/WEF_Global_Risks_Report_2010.pdf
World Economic Forum Global Risks Report (2011) The global risks report, 6th edn, Geneva. ISBN 92-95044-47-9 https://www3.weforum.org/docs/WEF_Global_Risks_Report_2011.pdf
World Economic Forum Global Risks Report (2012) The global risks report, 7th edn, Geneva. ISBN 92-95044-35-5 https://www3.weforum.org/docs/WEF_GlobalRisks_Report_2012.pdf
World Economic Forum Global Risks Report (2013) The global risks report, 8th edn, Geneva. ISBN 92-95044-50-9 https://www3.weforum.org/docs/WEF_GlobalRisks_Report_2013.pdf
World Economic Forum Global Risks Report (2014) The global risks report, 9th edn, Geneva. ISBN 978-92-95044-60-9 https://www3.weforum.org/docs/WEF_Global_Risks_2015_Report15.pdf
World Economic Forum Global Risks Report (2015) The global risks report, 10th edn, Geneva. https://www3.weforum.org/docs/WEF_Global_Risks_2015_Report15.pdf
World Economic Forum Global Risks Report (2016) The global risks report, 11th edn, Geneva. https://www3.weforum.org/docs/GRR17_Report_web.pdf
World Economic Forum Global Risks Report (2017) The global risks report, 12th edn, Geneva. ISBN 978-1-944835-07-1 https://www3.weforum.org/docs/GRR17_Report_web.pdf
World Economic Forum Global Risks Report (2018) The global risks report, 13th edn, Geneva. ISBN 978-1-944835-15-6 https://www3.weforum.org/docs/WEF_GRR18_Report.pdf
World Economic Forum Global Risks Report (2019) The global risks report, 14th edn, Geneva. ISBN 978-1-944835-15-6 https://www3.weforum.org/docs/WEF_Global_Risks_Report_2019.pdf
World Economic Forum Global Risks Report (2020) The global risks report, 15th edn, Geneva. https://www3.weforum.org/docs/WEF_Global_Risk_Report_2020.pdf
Acknowledgements
A part of the research leading to results presented in this paper has received funding from the European Union’s Horizon 2020 Research and Innovation Programme, under the Grant Agreement No 700621. The views and opinions in related to this research are solely those of the authors and contributors, not those of the European Commission.
The standardization related results presented are related and refer to the work taking place in the JWG1 of the ISO technical committees TC262 and TC 292.
The work owns a lot to the great collaboration with partners in several EU and other international projects (such as iNTeg-Risk, SmartResilience, ResiStand, InfraStress and others), as well as the support of the Steinbeis R-Tech and EU-VRi current and ex-colleagues.
Author information
Authors and Affiliations
Corresponding author
Ethics declarations
Conflict of interest
The authors declare that they have no conflict of interest.
Annexes
Annexes
1.1 Annex 1: Second level reports of the countries analysed


1.2 Annex 2: Prevention and control measures for COVID-19 epidemic: main apps and functions of epidemic prevention and control in China

Rights and permissions
About this article

Cite this article
Jovanović, A., Klimek, P., Renn, O. et al. Assessing resilience of healthcare infrastructure exposed to COVID-19: emerging risks, resilience indicators, interdependencies and international standards. Environ Syst Decis 40, 252–286 (2020). https://doi.org/10.1007/s10669-020-09779-8
Published:
Issue Date:
DOI: https://doi.org/10.1007/s10669-020-09779-8