
Abstract
Farmers submit claims to insurance providers when affected by sowing/planting risk, standing crop risk, post-harvest risk, and localized calamities risk. Decision making for settlement of claims submitted by farmers has been observed to comprise of type-I and type-II errors. The existence of these errors reduces confidence on agri-insurance providers and government in general as it fails to serve the needy farmers (type-I error) and sometimes serve the ineligible farmers (type-II error). The gaps in currently used underlying data, methods and timelines including anomalies in locational data used in crop sampling, inclusion of invalid data points in computation, estimation of crop yield, and determination of the total sown area create barriers in executing the indemnity payments for small and marginal farmers in India. In this paper, we present a satellite big data analytics based case study in a region in India and explain how the anomalies in the legacy processes were addressed to minimize type-I and type-II errors and thereby make ethical decisions while approving farmer claims. Our study demonstrates what big data analytics can offer to increase the ethicality of the decisions and the confidence at which the decision is made, especially when the beneficiaries of the decision are poor and powerless.
1 Introduction
Small and marginal farmers are operating under risk and uncertainty due to the rainfed dependence of agriculture in India. Crop insurance is a tool that has been widely utilized to reduce financial risks for small and marginal farmers (Gill and Singh 2006). Given the rainfed dependence of agriculture in India, managing risk and uncertainty are quintessential features of architecting any such insurance measures. The Government of India has instituted crop insurance as a tool to mitigate the risk of indebtedness against the threat of natural calamities to cultivators. These include prevented sowing or germination risk due to adverse seasonal effects and weather conditions including deficit rainfall, standing crop risk due to non-preventable risks such as droughts, floods, inundation, pests/disease attacks, landslides, natural fires, lightening, storm, hailstorm and cyclone from the period of sowing to harvesting, and post-harvest risk due to natural calamities and attack by wild animals (Ministry of Agriculture & Farmers Welfare 2016).
The challenge is not in the coverage of the risks but in the settlement of claims, which is reported to be delayed by nine to twelve months or more due to inertia in the collection of data for underwriting (Nair 2010). Further, poor quality of the collected data for the underwriting process adds to the lack of trust (Gulati et al. 2018). Lack of timeliness and trust questions the ability of the process adopted to differentiate a farmer who has actually suffered losses from another farmer who has not. These issues in the execution of the indemnity calculations and payments question the ethicality of the decision made as these decisions have immediate real world consequences by restricting farmers from gaining access to formal credit for financing their next subsequent crop cycles (Mahul et al. 2012).
Research in normative ethics provides us a basis to review decision making which in a simple model can be described as studying the interactions between intentions driving actions which lead to consequences (Harrison 2005). While the intentions are positive in the case of trying to use crop insurance as a tool to support small and marginal farmers in covering the risks they face, the loop holes in decision making have unintended consequences. We believe that creating efficiency in the process of settling crop indemnity will contribute to better ethical decision making by bridging the gap between good intentions leading to unintended consequences for small and marginal farmers. Within the context of this study, the ethical aspects in decision making mainly are of concern when the farmers who have lost yield are not served (type-I error) while the farmers who have not lost yield are served (type-II error). The source of type-I and type-II errors in India’s crop insurance sector arises from the loopholes in the data gathered to administer the insurance.
India has adopted area yield as a metric for insurance where the basis risk for the farmers depend on the size and heterogeneity of the unit of area chosen. Area yield is an estimated measure of the total crop yield over a geographic area. Presently, the metric is determined by manually harvesting crops in randomly chosen locations through a process called Crop Cutting Experiment (CCE) (sampling process by which crop yields are statistically estimated in each insurance unit) (Sinha 2004). The assumption behind this type of assessment is that annual average crop yield of a given area is agro-climatically homogeneous, that is spatially equivalent with that of its adjacent areas due to common weather conditions and geological features (Dandekar 1976). However, due to the assumption of homogeneity, the basis risk used in area yield creates a mismatch between claim payments and losses incurred (Rao 2010).
In addition, CCEs are the single source of data used for determining the average yield of a given unit area. But, CCE based sampling process is prone to several inaccuracies. According to a report by the government’s own task force on enhancing technology use in agriculture insurance (Aggarwal et al. 2016), the CCE data used as the basis for underwriting crop insurance has issues with credibility owing to complexities, human bias, measuring errors, and high labor, time and cost intensive design. CCE data also has limitations in covering spatial and temporal basis risks, and objective monitoring, reporting and verification processes (Aggarwal et al. 2016). Simply put, the indemnity payouts being homogenized to a unit area based on CCE data creates a lack of checks and balances leading to the moral hazard of providing grievance to ineligible cultivators (type II error) with the needy farmers staring at long latencies for redressal (type I error). This forms the basis to provide attention to ethical decision making in the underwriting process.
Using methods that are prone to corruption to compute individual farmer’s losses is an impediment to develop trust among the stakeholders servicing them. These not only bear direct effects of exposing farmers to a residual risk that creates a probability of not being indemnified even when losses occur but also create indirect effects of lack of trust for the uptake of crop insurance itself (Elabed and Carter 2015). The use of spatial data to architecting effective decision making has been showcased in developing countries (Gomes and Lins 2002) and provide timely responses in decision making (Liu and Yi 2018a). We believe technologies such as big data analytics carry such approaches forward and can solve challenging problems by managing data complexity (complex types, complex structures, and complex patterns make the perception, representation, understanding and computation challenging), processing complexity (multi-sources, huge volume, and fast-changing) and system complexity (high computational complexity, long duty cycle, and real-time requirements) (Jin et al. 2015). Within the ethics context, the open and independent availability of the data sources (i.e. several satellites from various providers can independently map areas of interest and make it available to everyone) creates possibilities for multiple independent assessments. We capture how this ‘democratic access’ to data (availability of open and independent sources) can improve the consciousness in the process of farm insurance claims settlement by addressing the below-stated research question:
RQ:How can satellite big data analytics potentially assist ethical decision making in farm insurance claims settlement process by avoiding type I and type II errors?
This paper is organized as follows. The challenges in the operating environment of a small and marginal farmer in India is described with the support of evidence from research in socio-economics of Indian agriculture. We then review the risks involved in decision making in the administration of crop insurance and discuss the social effects of the current operating environment. This foundation allows us to project the current challenges in ethical decision making which includes a review of the current method being used to collect, collate and disseminate data in administering crop insurance. We highlight the case for why the use of analytics has been challenging so far and how it could be leveraged to achieve ethical decision making. We then utilize the case of Sirsa, a region from the state of Haryana in India, which predominantly has cotton farmers to systematically discuss the mistrust among stakeholders involved in administering crop insurance and their ethical implications on the overall socio-economic landscape. We provide an overview of the underlying metrics and mechanics which create bottlenecks for ethical decision making and how satellite big data analytics can resolve them. We conclude our research by analyzing the broader role that satellite data analytics can play in ethical decision making in the administration of the crop insurance and moving forward, how it can be scaled to achieve trust among stakeholders.
2 Literature review
Understanding the socio-economic status of Indian farmers becomes an important precedent to understanding the need for crop insurance and the importance of effectively administering it. According to the latest data, an average farm household in India makes Rs. 6426 per month (~ $100) with over half of agricultural families indebted with an average loan outstanding per household being Rs. 47,000 (~ $725) (Datta et al. 2018). This is in the context where two-thirds of the farm households in India are cultivating in farms measuring less than or equal to one hectare (Birthal et al. 2015) with the average annual income generated from one hectare of net cultivated area touted to be Rs. 80,800 ($1250) to a farmer (Saxena et al. 2015, pp. 2011–2012). The poor financial state of farmers in India is highlighted by the fact that growth in farm income after 2011–2012 is only 1% with research suggesting that this low growth rate is associated with the increase in agrarian distress (Saxena et al. 2015, pp. 2011–2012). Essentially, the number of farmers’ suicides have increased during this period of low growth and is expected to decrease if farm income increases at a higher rate.
Several studies have indicated dexterously architected and administered index insurance for shock coping in agriculture can positively affect its adoption at the bottom of the pyramid in developing countries to deliver higher productivity and minimize risk to small and marginal farmers (Miranda and Farrin 2012; Lensink et al. 2016; Mahul and Charles 2010). Given the various threats from natural calamities to a successful harvest, crop insurance is used as one of the tools to alleviate financial risk for farmers (Vyas 2004) by providing cover to natural calamities and farming associated risks.
The latest drive by the Government of India is the Pradhan Mantri Fasal Bima Yojana (PMFBY), a comprehensive scheme positioned as a farmer’s maximum financial protection against non-preventable natural risks that include prevented sowing due to inclement weather, mid-season adversities due to floods, drought spell, unseasonal rains, etc., localized calamities such as hailstorm, inundation and landslides, and coverage for post-harvest losses (Press Information Bureau 2017). According to latest media reports, of the 8,100,000 farmers said to have registered under the PMFBY for the 2017 Kharif (monsoon) season, 4,500,000 are estimated to have made claims to the indemnities. However, only 8% of them received indemnity payouts with an estimated 3-month delay (Kakodkar 2018).
The delay in indemnity payments has real world consequences for small and marginal farmers. This can be understood by reviewing the credit side constraints. Strong evidence exists from developing countries that formal credit institutions providing access to finance have a bearing on the ability of the farmers to procure farm inputs (such as fertilizers, tractors, etc.) (Narayanan 2016). A study based on a survey done with farm households indicate that 74% of Chinese households and 78% of Indian households experience credit constraints resulting in a reduction of agricultural inputs, which lead to lost productivity and a positive shadow price for credit (Kumar et al. 2013). In addition, the risk perceived by formal credit institutions in India are high due to the fact that 40% of the food grains produced in India are being rainfed.
Garnering success in the agriculture sector for any institutional financial service is heavily dependent on having a reliable foundation to check for adverse selection and moral hazard. Seasonality, external production risks and volatility of managing the risk structure creates a negative perception towards agricultural businesses and introduces resistance to participate in financial services industries (de Nicola 2015). The information asymmetry in agriculture is due to the lack of ability to measure risks and collect data for monitoring producer behaviour (Mahul and Charles 2010).
The information collection and decision making in administering crop insurance in India is based on the involvement of the States in data collection with the co-observation of the insurers. The joint participation and consultations of the State with insurers come to a conclusion on the indemnity levels of high, moderate and low-risk level for notified crops and areas. The indemnity levels are derived on the basis of comparing the average yield of the current season with the historical yield of the crop called the threshold yield. The threshold yield of the crop is calculated based on the average yield of the crop for the past seven years (excluding up to two declared calamity years). Average yield is generated by conducting CCEs at the level of unit area in locations generated using stratified multi-stage random sampling (Mahul et al. 2012). CCEs based yield estimation is a manual process of harvesting crops in a 5 m × 5 m (25 sq. m) area selected based on the random sampling.
Given the fact that it is too expensive and time-consuming to have CCEs conducted on each and every individual farm, the crop insurance in India adopts of what is referred to as an ‘area-based approach’, which is accepted to mitigate adverse selection and moral hazard problems (Halcrow 1949). The area-based approach works on the premise that geo-climatic conditions in adjacent farms are similar (similar soil and weather conditions prevail in adjacent farms) and therefore CCEs done in blocks of ‘similar areas’ (a collection of farms in a village) are clubbed together to provide a reasonable estimate of the yield of a crop that can be used as the basis for average yield per farm (Nair 2010). The current mandate by the government in India is to conduct at least 4 CCEs per insurance unit (village level) (Ministry of Agriculture & Farmers Welfare 2016). Upon the collation of the CCE data collected at all the insurance units, the extent of indemnity payments are computed on the basis of the average yield of the historically available data and the average yield of the year in question for the given insurance unit. Therefore, the accuracy of the average yield (of the latest season as well as historical) drives the decision making in paying out the indemnities to the affected farmers.
Government of India’s own task force acknowledges the fact that CCEs create the basis for several discrepancies (Aggarwal et al. 2016) which needs to be addressed. Within the context of this study, we describe four different bottlenecks created for ethical decision making below:
-
Cost-based bottleneck: With at least four CCEs per crop to be conducted at the insurable unit level, the total number of CCEs to be conducted for covering the entire agrarian land in India as a part of the General Crop Estimation Survey (GCES) stands over 900,000. This represents 230,000 such units (representative of total villages) where CCEs need to conduct with the estimated minimum cost of $16 (Rs. 1000) per CCE. Apart from the laborious process involved, the incentives for the manpower involved in conducting CCEs are based on the volume. This may skew the results as the goal is not to be accurate to earn more rather it is to conduct more CCEs.
-
Sample-based bottleneck: Researchers have assessed that the prescribed four CCEs per crop per village does not capture the scale and diversity of crop loss with farmers expressing concern that the actual loss does not reflect the CCE derived loss (Bhushan and Kumar 2017). The ambiguity in the data may lead to situations where farmers affected fields don’t fall in the selected four samples in the village which will lead to no one in that particular village being eligible for any claim.
-
Location-based bottleneck: There are reports of cases where the location of the CCE generated by random sampling is not accessible to the officials due to lack of infrastructure. In such situations, although government asks its officers to conduct CCEs in locations generated by random sampling (Government of Telengana 2017), the practical difficulty push the officials to a completely different location (however reported as conducted in the prescribed location) or having data reported by not conducting CCEs at all.
-
Time-based bottleneck: The window to conduct CCEs is highly constrained by the harvest season with the recommended time period to be about two weeks before the harvest (Directorate of Economics & Statistics 2017). The state task force and insurers have reported the non-availability of trained manpower and co-observers respectively to be the bottleneck in conducting the CCEs to the extent to cover all geographies. The constrained timelines to conduct CCEs and the lack of ability to have co-observers by the insurer for all the CCEs conducted by the state introduces trust deficit in the data collected.
Due to the above-listed bottlenecks, integrity of data collected through CCE sits on top of human bias and measurement errors. Apart from these bottlenecks, there are other inherent challenges to ethical decision making such as the entire process is vulnerable to corruption leading to reporting of bogus CCEs (Currie 2000), conducting eye-estimation based assessments (Banik 2007) and treating the process intended as just formalities on paper.
The information asymmetry not only creates type-I and type-II errors but also festers an opportunity for exploitation causing ripple effects. For example, a study on the role of financial institutions in agriculture discusses how pressure from political vested interest to appease vote banks add to further weakening of the quality and sustainability of the financial institutions (Akoijam 2012). Similarly, a study on access to credit during elections in India indicates a 5–10% increase in lending from public sector banks and at the same time loan write-offs to be linked with electoral success by the winning party (Cole 2009). The 5–10% growth in agricultural credit from public sector banks observed during the election year is substantially higher than the average annual growth rate in non-election years. At the same time, the decisions on write-offs in districts of electoral success is not a phenomenon experienced prior to elections. Clearly, the ethical problems that arise out of the information asymmetry also go beyond just the type-I and type-II errors within the crop indemnity settlement process. Therefore, addressing the foundation of the information asymmetry causing type-I and type-II errors has value beyond the crop indemnity settlement process discussed in this paper.
3 Methodology, data and analysis
Our research deals with studying the real-life problems faced due to type-I and type-II errors which are bearing negative effects in the lives of small and marginal farmers in India. These challenges primarily arise from the use of handcrafted resource-intensive models currently being used in the crop indemnity settlement process. In order to set the boundary conditions to studying the problems in ethical decision making, we choose to focus the lens on a single real-life instance experienced by small and marginal farmers in India. This allows us to arduously study and comprehensively analyze the effects of information asymmetry of the legacy approach and capture the need for satellite big data analytics to achieve ethical decision making.
We find that the works of Eisenhardt (1989) and Yin (1994) provide us the methodological foundations to be able to conduct such a study and allow us to use the single real-life instance to assess the potential of satellite big data analytics in addressing the ethical challenges by minimizing the type-I and type-II errors arising out of the current crop indemnity claims settlement process used in India. Kaplan and Duchon (1988) argue that despite normative nature of such research, the case study approach nevertheless provides the grounds to rigorously study the effect of information systems on users, organizations or the society. In their review of ethics in operations management and management science, Brans and Gallo (2007) call for taking viewpoints of people affected in the process of decision making and call to use decision aids which can address unforeseen influences taking place. In our case study research, we study the utility of satellite big data analytics to understand how it can contribute to answering the research question on the minimization of type-I and type-II errors and thereby address the ethical challenges currently being faced (Siggelkow 2007).
Our choice of a single-case study to address the research question allows us to tackle different forms of arguments such as “how”, “what” and “why” through which we are able to sustain evidence for the current operational challenges in ethical decision making and minimize type-I and type-II errors. In discussing the operationalization of the satellite big data analytics, there are several technicalities to the algorithms in processing the openly available satellite dataFootnote 1 used within this research. We intentionally do not focus on describing the engineering technicalities of each of the processes adopted to extract the information from the satellite images. However, we have provided a nominal scientific brief to the process involved in extraction of the information relevant in the confines of this study. Within the purview of the research question raised, we believe it is more meaningful to discuss as to how the results of the satellite data analytics post such technicalities is operationalized in the decision-making process to remove the barriers faced by the stakeholders highlighted in the paper.
3.1 Exploratory case study methodology
The present case study is based on the experience of cotton cultivators in the district of Sirsa (area: 4277 sq. km.; population: 1,295,189; villages: 329Footnote 2) in the state of Haryana in India. Cotton is one of the major crops in Haryana with rice and bajra (pearl millet) being the other major crop (Sethi 2011). As a cash crop, cotton is a popular choice in Haryana with media reports suggesting a record sowing of cotton in 2017 of 630,000 ha, which is over a quarter more than the 500,000 ha of the sown area of 2016 (Jayan 2017). The cotton yield for the district of Sirsa was reported lower than expected for the Kharif (monsoon) season of 2017. We are presenting a case of dissection of the lower yield claims made in the case of Sirsa from the perspective of the farmers and the insurers under the lens of ethical decision making.
3.2 Satellite data and analysis
Big data analytics has emerged to be established as a part of decision making in supply chains (Liu and Yi 2018b). The use of satellites as a source for big data has been enabled by the evolution of Moore’s law in achieving better resolutions (smaller patches of land being mapped), increasing number and quality of sensors, better data rates for storage and transmission, and creating a big data ecosystem for applications in sectors such as agriculture (Nagendra and Segert 2017). Satellite data analytics is primarily enabled by the emergence of satellite constellations that provide the capacity to generate imagery on a daily basis for the entire globe (Houborg and McCabe 2016). The development of satellite data analytics is fundamentally driven by satellites providing volume, velocity, veracity and variety of imagery data alongside the slash in prices and increased computational power (Toth and Jóźków 2016). The alignment of drivers of cost, computational power and access to the data has led to variety of applications development through the adoption of satellite big data analytics in a range of industries. Researchers have recently highlighted examples across industries such as correlation studies for disease outbreaks in healthcare sector (Bauhoff and Busch 2018), site assessment of solar photovoltaic projects (Nagendra et al. 2020a), humanitarian relief operations (Nagendra et al. 2020b), monitoring of critical energy networks in power sector (Downey et al. 2017), monitoring of the revegetation of oil sands exploration well pads in oil and gas sector (Dacre et al. 2017), and enabling new algorithms/methods to assess climate change (Manogaran and Lopez 2018). Within the agriculture context, researchers have indicated the potential that use of such algorithmic applications based on data analytics is maturing (Devalkar et al. 2017) and there is potential to use models built on the basis of scientific data such as satellite imagery (Rembold et al. 2013) and weather (temperature, pressure, humidity, etc.) (Römer and Musshoff 2017). In the case of Sirsa, data from European and American optical mapping satellites Sentinel-2B and Landsat 8, which are carrying high-resolution multispectral cameras and providing open access to the imagery, is used to predict crop yields and acreage.
The satellite imagery between June to November of 2016–2017 is procured based on the Region of Interest (ROI) and time of interest which in this case is based on Sentinel 2B and Landsat-8 satellite imagery for the Sirsa region. Satellite imagery from Landsat 8 allows mapping the location of the CCEs conducted to start with basic checks such as presence of crops in that location and absence of settlements, roads, and barren lands. This cross-checking helps in confirming the authenticity of the CCE data reported for a particular location. Once the location of the CCE data is confirmed, the satellite imagery from Sentinel 2B is used to calculate the crop area and the yield estimate.
The calculation of the area of the vegetation of the crop and its yield is based on the estimation of Normalized Difference Vegetation Index (NDVI). NDVI is arrived at using the equation NDVI = (NIR − RED)/(NIR + RED), where the Near-Infrared (NIR) and the RED are derived based on the light reflected from vegetation, which is gathered through the satellite imagery (Reed et al. 1994). Essentially satellites capture the light reflected from the surface of the vegetation. Crops which are healthy tend to absorb a major part of visible light and reflect a large part of near-infrared light and crops that are unhealthy or if the vegetation is scarce then such an area typically reflects visible light and a lesser part of near-infrared light. Very simply put, the satellite data from Sentinel 2B is used to calculate the NDVI (characteristic of the chlorophyll of the crops). NDVI can be used to compute the acreage and crop yield, which can be keyed in for estimating losses and settling claims. The NDVI derived from satellite data is used to arrive at an independent assessment of the crop area and yield status, which can then be compared to the data provided by the government to capture the nature of type-I and type-II errors.
4 Results and discussion
In order to clearly understand the potential of satellite big data analytics in removing type-I and type-II errors, we would like to discuss the results by comparing the decision making on the crop indemnity as pre-analytics claim settlement outcomes and analytics-based assessment of claim settlement outcomes. This allows us to narrate how satellite big data analytics can be leveraged to create mitigation strategies in removing type-I and type-II errors.
4.1 Pre-analytics claim settlement outcomes
In the present case, the points of contention that restrict insurer from decision making are:
-
(a)
Reporting of lower yield: The CCE data published for the district of Sirsa indicate that 825 CCEs were conducted for the cotton planted in Kharif 2017. Of these, less than 10% of CCEs were co-witnessed by the representatives of the insurer and the final reports indicate a lower crop yield even with favorable climatic conditions (monsoon rains) reported during the season. The lower yield across all blocks within the district of Sirsa despite favorable conditions for a good harvest is a cause for concern of the integrity of the underlying data. The exact locations of the CCEs were not captured through robust sources such as smartphone geo-location which would have alleviated concerns among the insurers despite their officials not being present to witness the CCE process. Therefore, the validity of the reported yield figures has come under the lens of speculation.
-
(b)
Reporting of higher crop acreage: Determination of the total crop acreage of every season is an important metric since the indemnity payouts are based on per acre basis. The government has reported an estimate of 198,800 ha of planted area for cotton in Sirsa. The process of determining the total crop acreage is conducted based on physical surveys conducted by the government officials. The total crop acreage based on historical trends seemed to have been reported to be significantly higher for Kharif 2017, which calls for an independent analysis on assessing the estimated acreage. Given that the total yield estimates were already seen as contentious, the claims on the higher crop acreage also seem accentuated to the insurers.
To understand these points of contention in detail, the nature of the data, its basis and the processes involved in collecting and collating them have to be studied. The aberrations in the reported estimates above are not just in the case of Sirsa. Independent researchers from the Centre for Science and Environment (Bhushan and Kumar 2017) have reported several cases of anomalies that are created due to the holes in the proper execution of the CCE process. The anomalies include non-reportage of CCEs leading to no indemnity claims, improper reportage of CCEs even though losses were evident, change in the insurance unit leading to confusion in insurers, and bottlenecks in the ability to conduct CCEs leading to incomplete datasets, whose details are documented in Table 1.
4.2 Analytics based assessment of claim settlement outcomes
The key points of contention for decision making in the case of Sirsa that were confirmed using satellite big data analytics include:
-
(a)
Anomaly in locational data used in calculation of average yield: As the satellite imagery was procured and a reverse analysis of plotting the CCE locations and average yield prescribed by official data was conducted, it was noticed that locational coordinates provided by the official data had eleven of the CCE points used in the determination of the average yield fall outside the boundary of Sirsa district (Fig. 1).
Fig. 1 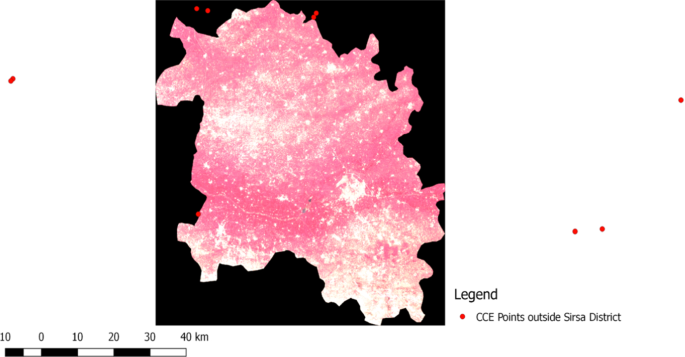
CCE coordinates falling outside of area of interest
-
Outcome: As the sample contained CCEs from a different population, it creates an anomaly in the eventual declaration of average yield for the blocks that consider these locational coordinates. A fault in location of a lower yield reported included in the calculation of indemnity payments mean a type-I error and the reverse is a type-II error. Similarly, the converse is also true for a higher yield used in calculation based on a fault in location. In simple terms, a farmer who lost crop but got reported as having higher yield stands to lose and a farmer who had higher yield but gets reported to have reaped a lower yield stands to gain. Therefore, faults in CCE locations can cause both type-I and type-II errors depending on the reported data for the CCEs.
-
Mitigation: The insurer can take a decision to carry forward the unbiased data into the underwriting process and at the same time request the concerned officials to accept a recalculation of the average yield for the affected blocks. This assures that the process of underwriting is not completely halted for the entire district and only the blocks affected by the error are revisited. More importantly, adopting satellite big data analytics solutions can completely eliminate the need for conducing CCEs in each and every village to estimate average yield. Given that satellite images capture location data into which farms can be embedded, it will give complete confidence to all the stakeholders on the validity of the yield estimated for different locations.
-
-
(b)
Invalid CCE points reported in yield estimation: Satellite data allows to check individual CCE points and confirm the crop and its status. Satellite data was used to conduct an analysis on CCE points where cotton was reported to be sown. It was found that 47 CCE points were not lying on the cotton crop classified fields with many of these CCE points being over human settlements, barren land, or roads (Fig. 2). Therefore, a total of 58 CCE points provided by the government were found to be faux data.
Fig. 2 
Human settlements, barren lands or roads reported as cotton sown areas
-
Outcome: This discrepancy is a cause for concern of the authenticity of the underlying CCE data. The deviations reported lead to both type-I and type-II errors depending on the value reported at the location causing potential losses to either the farmer or the insurer. Here again, the discrepancy in the CCE data leads to a farmer who lost crop but got reported as having higher yield stands to lose and a farmer who had higher yield but gets reported to have reaped a lower yield stands to gain. Such errors noticed by underwriters introduce a bottleneck in the underwriting process until there is suitable remedy or explanations derived for the discrepancy in the data.
-
Mitigation: A simple week on week time series analysis using satellites images performed over the locations of the areas of interest can provide the basis to challenge the reported data. The time series analysis will reveal the entire crop cycle starting from the planting to the harvest period and therefore provides an opportunity to identify the reason for the deviation. This again provides the opportunity for the insurer to carry forward the underwriting process for those blocks where there are no concerns in the crop being sown and deviations are deemed acceptable and non-anomalous.
-
-
(c)
Estimation of crop yield: The NDVI indicators using the satellite big data analytics need to show a correlation between the crop productivity estimated using the CCE data at the village level in order to corroborate the accuracy of the data collected in the CCE process. The government reported estimates suggests that there are a significant number of villages that have lower yield. One of the ways to verify these claims is to compare the NDVI at peak bloom of cotton crop at village scale with the yield values provided by the government for the year before. The deviation between change in NDVI values in the Kharif seasons of 2016 and 2017 and the change in the reported cotton yield values during the same period were inconsistent for Sirsa (Fig. 3). The variation in NDVI (crop condition indicator) determined by the analytics process against that of the CCEs data lacked correlation. It can be attributed to the incorrectly reported CCE cotton yield in these blocks.
Fig. 3 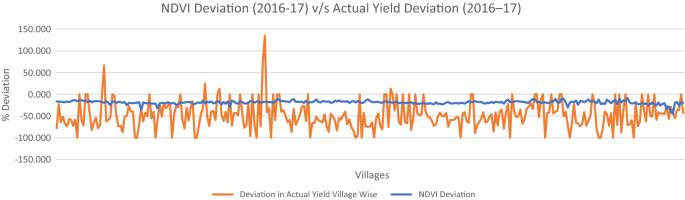
NDVI deviation (2016-17) v/s Actual yield deviation (2016–17)
-
Outcome: Using CCEs as the basis of calculating the average yield includes a significant opportunity to generate single points of failure since every CCE conducted has a bearing on the result of average yield of a block. Without the bandwidth for the insurer to co-observe every CCE conducted, the trust gap only widens when the collated results considering the historical performance and information of the season in question point to having no reason for any significant drop in productivity.
-
Mitigation: Satellite big data analytics can act as a tool to determine the causal link for the change in crop health and productivity over the season. This goes beyond the traditional means of depending on simple weather reports, land-based surveys, or media reports as the basis for assessing the productivity of a harvest. Satellite big data analytics provide the possibility of localization of crop yield to the level of an individual farm level which translates to having the ability to avoid both type-I and type-II errors by analyzing the plausible source of crop damage and its extent suggesting lower yield. This provides the basis for decision making by undertaking the indemnity process for the rest of the villages where the insurer does not want to challenge the CCE data and at the same time provides the impetus for a faster claims’ clearance process for the affected farmers in the subset of these villages.
-
-
(d)
Determination of the total sown area: The appropriate estimation of the total sown area of the crop in question is important since the metric for indemnity payments are based on average yield as well as total sown area of the crop. The total sown area being determined by physical land surveys by government officials reported 198,900 in 2017. The satellite big data analytics based computation of cotton acreage for 2017 was estimated at 163,226 ha (Table 2). The difference in the cotton sown area estimates computed using NDVI (with the government claiming higher crop acreage) stand at 17% (Table 3).
Table 2 Total disputed land acreage for 2017 Table 3 Block-wise disputed land acreage for 2017 -
Outcome: A block-wise analysis performed shows the negative deviations (larger sown area reported) in at least three blocks to be over 25%. These directly indicate a type-II error where farmers who have technically not sown cotton stand to benefit from indemnity payments. At the same time, one block was observed to have a positive deviation (with the government claiming lower crop acreage) which indicates a type-I error where farmers are not being compensated to the extent of the damage occurred.
-
Mitigation: The ambiguity over the increase in total sown area by relying on single source of data again creates a gap in trust and thereby delays decision making by the insurer. The satellite big data analytics provides the insurer with a tool to not only challenge the government to possibly reconsider the estimation of the cotton sown area data but also provides an opportunity to the insurer to fast-track the underwriting process for the blocks where the deviation is at acceptable margins. The insurer can choose to process the indemnity claims in a two-step process where the underwriting process for the claims of crop acreage verified by satellite big data analytics can be settled and the underwriting process for the disputed acreage can be performed post deliberations with the government. This allows avoidance of both type-I and type-II errors while the process followed ensures timely relief for the farm community by releasing indemnity payments allowing them to carry forward planning their next harvest.
-


Based on the results presented above, it is evident that the stakeholders involved in the agri-financial services supporting the farmers have a lack of trust in the entire process of data collection, collation and dissemination. This introduces serious operational bottlenecks which ultimately affect the small and marginal farmers. The adoption of satellite big data analytics has immense potential to bridge this gap as satellite imagery is a completely democratized data source. The nature of the democratization arises due to the fact that satellite data is originating from an independent source and it also allows equal access to the data to all the stakeholders in the value chain.
Further, satellite big data analytics allows a clear time series analysis where snapshots of the entire season (e.g. week on week analysis) can be carried out to build up a transparent ground reality of the entire harvest. This can completely eliminate the dependency on one-off efforts to rush to assess the yield and acreage using traditional method of CCEs and also save valuable resources of all the stakeholders (government and the insurers) in deriving such estimates. It is often observed that such radical transitions at large scales may not occur due to the vested infrastructure and interests in the legacy approaches. Even in this case, satellite big data analytics can act as an alternative source of truth to hold the legacy data collection, collation and dissemination approach accountable and create moral and ethical barriers for the stakeholders involved in administration of the crop insurance.
Transparency created through the satellite big data analytics not only monitors the actions of the stakeholders responsible for the administration of the crop insurance but also the small and marginal farmers themselves. For example, recent media reports from India have indicated that farmers are willfully defaulting on loans in the hope of waivers (The Times of India 2017). This is not only a problem of creating an environment for opportunism by exploiting moral hazards through politicizing the underlying issues but any rise in delinquency rates due to intentional defaulting have severe implications on the overall health of the economy in a country like India which heavily depends on farm income (Iyer 2019). The use of satellite data analytics has the potential to also hold the stakeholders who are being served equally accountable for their actions since they provide independent evidence on the performance of the farmers themselves.
Timing in claims settlement also becomes a key challenge to be addressed since access to financial services for small and marginal farmers is a major challenge due to the stringent processes followed to establish creditworthiness (Gouri and Mahajan 2017). The lack of data to establish a credit history and the necessary capabilities to access the information of creditworthiness of low-income families in emerging economies is a barrier to the expansion of access to financial services (Kshetri 2014). This opens the door to informal lenders who can harass small and marginal farmers with very high interest rates. Over 40% of agricultural credit in major farming states such as Punjab in India are coming from the informal lending sector (Gill 2016). The interplay of the forcefulness of the creditors in repayment is one of the biggest factors in farmer suicides. A study of the suicide scenario in Maharashtra indicated that 44% of the farmers were harassed for repayment of the loan with the creditor insisting on immediate repayment in 33% of those cases (Mishra 2006). Given the credit crunch, the timing of the payment of indemnities from crop insurance play a critical role in recovering losses of a previous season and provisioning finances for the most basic inputs (e.g. seeds, fertilizers) for the next season. Here again the use of satellite data analytics has the potential to serve the needy farmers with timely settlement of indemnities to not suffer credit crunch for following seasons.
We would also want to highlight an important aspect of the utility of satellite big data analytics in its ability to transform other immediate adjacent ethical problems within the agriculture context. For example, complexity in decision making starts as information available to financial institutions reduce, reducing the ability to undertake any risk in lending to farmers. A study conducted in China indicates that the lack of creditworthiness of low-income families are merely because banks and financial institutions have information opacity and face high transaction costs to assess the creditworthiness of low-income families (Kshetri 2016). The ability to screen borrowers with a high degree of accuracy face bottlenecks due to information asymmetry and transaction costs in developing countries, which ultimately plays to the advantage of informal lenders who can then use the leverage to impose their own terms (e.g. high interest rates) (Pal 2015). The lack of a credit history and repayment record may force formal credit institutions to use indeterminate variables such as household expenditure, owned land and agricultural machinery which directly creates the possibility of wealthier households receiving credit, even though they may have little need for it (Foltz 2004). The foundation of using analytics in decision making is the ability to move away from unreliable or not sufficient information sources towards using independent and democratized sources. This can help create trust in the ability of the data to reveal the ground truth and enable modeling and analysis to develop a structured approach for decision making (Jagadish et al. 2014). Therefore, the utility of satellite data analytics stands to improve the basis for ethical decision making significantly not just in one part of the value chain but across the board.
5 Conclusions
Providing crop insurance as a tool to mitigate the risk of indebtedness against the threat of natural calamities to cultivators in developing countries such as India is essential to the socio-economic well-being of its cultivators. Our case study highlights the ethical challenge arising in the execution of such welfare schemes. The gaps in currently used underlying data, methods and timelines including anomalies in locational data used in crop sampling, inclusion of invalid data points, estimation of crop yield, and determination of the total sown area create barriers in executing the indemnity payments for small and marginal farmers in India. Manual and legacy methods such as CCEs not only form the basis of ethical problems in decision-making but also have tremendous real-world costs to farmers. This not only bear direct effects of exposing the cultivators to a residual risk that creates a probability of not being indemnified even when losses occur, but also create indirect effects of lack of trust for the uptake of crop insurance itself. The use of satellite data analytics has the potential to improve the basis for ethical decision making by creating transparency through democratized data sources and scientifically verifiable methods.
5.1 Research implications
Management researchers have recently highlighted the potential use of data science in agri-supply chains for timely information to farmers, traders, and policymakers (Devalkar et al. 2017). Similarly, researchers have corroborated the application of satellite big data in the longitudinal assessment of crop yield, health (Azzari et al. 2017) and evaluated the possibility for development of financial products aimed at small and marginal farmers in developing countries (Burke and Lobell 2017).
We have observed that research focused on the use of analytics and its ethics related implications often turns to capturing insights from the perspective of criticizing the developers of analytics for various end user applications. The ethics discussion in such research is based on the immediate consequences of analytics (Danna and Gandy 2002), rather than the use of analytics in solving existing ethical conflicts. For example, a recent paper continues to pursue this line of research by assessing the smartphone application development ecosystem and then debates the various ethical aspects of the technical development settings in interplay between the application makers and the mobile platform hosts (Shilton and Greene 2019). Our study can be treated as an inverse of these types of studies (i.e. ethical issues of analytics) where a ‘real world’ example is used to debate the potential of using analytics in solving a persistent ethical problem. In this paper, we are questioning if big data analytics (i.e. satellite data) can assist ethical decision making by avoiding type I and type II error.
There is tremendous potential for the use of information systems to provide a better basis for ethical decision support (Mathieson 2007) to avoid type I and type II errors in crop insurance claim settlement. The avoidance of type I and type II errors have a direct bearing on addressing the reasonable needs of the distressed. Such errors also need to be addressed to enable the greater adoption of crop insurance, which is likely to increase in response to climate change (Falco et al. 2014). Moreover, the avoidance of type I and type II errors has the potential to trickle back to the credit side which suffers from providing only 20% of the loans in agriculture in India without using land as collateral (Krishnan and Panchapagesan 2016).
5.2 Practice implications
In the case of Sirsa, satellite big data analytics has provided sufficient grounds to overcome the challenges posed by the CCE data which then translates to overcoming type-I and type-II errors. The metric of average yield as collected and collated from the CCE data provides the basis for the determination of the extent of losses or deviation in the yield for the season (considering the historical performance of the farms). Given that the calculation of indemnity payments depend on the threshold yield determined by a moving average of the average yields for the last 7 years, any anomaly in the underlying data of average yield for a season stands to affect the future decision making on indemnity payments. Similarly, the total crop acreage as determined by land-based physical surveys inevitably lead to type-II error and affects the performance of the insurer in the process. The avoidance of the type-II error becomes crucial for the financial institutions to gain more confidence in the reliability of underlying data to then increase their commitment to expansion of their activities.
By tackling these errors, satellite big data analytics provide support to the voice of the suppressed marginal farmers in the matters of agri-financial services. The legacy processes that involve manual and laborious processes create severe bottlenecks in the operational efficiency, which lead to gap in trust between the stakeholders involved. The case study in this research illustrates how the stakeholders can now engage with digital platforms that use several sensors (e.g. smartphones, satellites, Internet of Things) to make confident decisions without questioning the reliability of the underlying data.
Application of satellite big data has the potential to not only replace the currently used CCEs as the basis of data for deriving the average yield in designated insurance units, but provide an opportunity to leapfrog the basis risk towards individual farms using a biomass index (Rao 2010). Further, circling back the analytics to the creditors who form another important part of the agri-financial industry will allow smoothening of decision making in credit services. The products of analytics holds the potential to influence decision making by policy makers towards achieving better sustainability, food security as small and marginal farmers will need to adapt and adopt climate-smart agriculture (Wolfert et al. 2017).
5.3 Limitations
The case study presented here is localized to a limited geography of a district in India and utilizes open source satellite data which are limited in numbers. The scaling effects to decision making by capturing an entire State or the landmass of India can pose some challenges including possible input costs of commercial satellite imagery due to unavailability of open-source imagery, scaling of algorithms, and computing cost and complexities. As the solution gets adopted and scaled, a focused empirical study on the scaling effects shall uncover its impact on decision making.
There may be several ethical challenges posed by the use of big data analytics as it may create harmful effects of value destruction and diminished rights for stakeholders (Martin 2015). Research scholars with an interest in the intersection of big data and agriculture have already indicated possible cultural, political, ecological and material complexities with data ownership stimulating further inequity between agri-value chain players (Bronson and Knezevic 2016). Our research limits to capturing the positive effects of utilizing big data for ethical decision making. However, we hope that the big data community would address these gaps in the future.
5.4 Future research
There are several inherent challenges to scaling the cover of the crop insurance such as only a few major crops (e.g. cereals, pulses and oilseeds) are being covered, subsidizing premiums for better adoption, and inability of states to move down to the lower insurance units (villages) as a measure to reduce basis risk (Nair 2010). There is scope to study the ability of satellite big data analytics to support the expansion of the crop insurance into lower land units as well as larger number of crops.
More interestingly, there is tremendous scope to further study the adoption of satellite data analytics for ethical decision making in other parts of the agriculture value chain. One example of this is addressing the problems in the access to credit for small and marginal farmers. Researchers have found that caste, class and their location effects has a bearing on the social interactions in the matters of credit availability for rural agriculture (Guérin et al. 2013). The impact of caste and class discrimination is found to be not limited to accessing informal lending, but extends to agriculture credit provided by formal institutions as well (Kumar 2013). The foundation of this discrimination is the ability of creditors to trust lenders with increased quantity of credit and a perceived reduced default due to cultural complexity (Fisman et al. 2017). This dependency on such alternative methods to establish trust between creditors and farmers is mainly due to the existing information bottlenecks in the ability of creditors to establish creditworthiness and conduct risk management. We believe that satellite big data analytics has the potential to resolve the information asymmetry on credit history and performance, and therefore can support ethical decision making for improving the contracting outcomes between loan offices and the small and marginal farmers.
Notes
Sentinal open satellite data portal available at https://sentinel.esa.int/web/sentinel/sentinel-data-access (last accessed on 9 August 2020).
Accessed from Government of Haryana’s website for District Sirsa. Available at https://sirsa.gov.in/ (lastaccessed on 15 July 2020).
References
Aggarwal, P. K., Chand, R., Bhutani, A., Kumar, V., Goel, S. K., Rao, K. N., et al. (2016). Report of the Task Force on Enhancing technology use in agriculture insurance. Monograph. http://eprints.cmfri.org.in/12312/. Accessed 16 June 2018.
Akoijam, S. L. S. (2012). Rural credit: A source of sustainable livelihood of rural India. International Journal of Social Economics, 40(1), 83–97. https://doi.org/10.1108/03068291311283454.
Azzari, G., Jain, M., & Lobell, D. B. (2017). Towards fine resolution global maps of crop yields: Testing multiple methods and satellites in three countries. Remote Sensing of Environment, 202, 129–141. https://doi.org/10.1016/j.rse.2017.04.014.
Banik, D. (2007). Starvation and India’s democracy. London: Routledge.
Bauhoff, S., & Busch, J. (2018). Does deforestation increase malaria prevalence? Evidence from satellite data and health surveys (SSRN Scholarly Paper No. ID 3149887). Rochester, NY: Social Science Research Network. https://papers.ssrn.com/abstract=3149887. Accessed 17 June 2018.
Bhushan, C., & Kumar, V. (2017). Pradhan Mantri Fasal Bima Yojana—An assessment. New Delhi: Centre for Science and Environment. http://cdn.cseindia.org/attachments/0.99958400_1505369720_Pradhan-Mantri-Fasal-Bima-Yojana-Report.pdf. Accessed 16 June 2018.
Birthal, P. S., Roy, D., & Negi, D. S. (2015). Assessing the impact of crop diversification on farm poverty in India. World Development, 72, 70–92. https://doi.org/10.1016/j.worlddev.2015.02.015.
Brans, J.-P., & Gallo, G. (2007). Ethics in OR/MS: Past, present and future. Annals of Operations Research, 153(1), 165–178. https://doi.org/10.1007/s10479-007-0177-1.
Bronson, K., & Knezevic, I. (2016). Big Data in food and agriculture, Big Data in food and agriculture. Big Data & Society, 3(1), 2053951716648174. https://doi.org/10.1177/2053951716648174.
Burke, M., & Lobell, D. B. (2017). Satellite-based assessment of yield variation and its determinants in smallholder African systems. Proceedings of the National Academy of Sciences, 114(9), 2189–2194. https://doi.org/10.1073/pnas.1616919114.
Cole, S. (2009). Fixing market failures or fixing elections? Agricultural credit in India. American Economic Journal: Applied Economics, 1(1), 219–250. https://doi.org/10.1257/app.1.1.219.
Currie, B. (2000). The politics of Hunger in India: A study of democracy, governance and Kalahandi’s poverty. Berlin: Springer.
Dacre, C. K., Palandro, D. A., Oldak, A., Ireland, A. W., & Mercer, S. M. (2017). High-resolution satellite imagery applied to monitoring revegetation of oil-sands-exploration well pads. Environmental Geosciences, 24(4), 167–182. https://doi.org/10.1306/eg.07071717001.
Dandekar, V. M. (1976). Crop insurance in India. Economic and Political Weekly, 11(26), A61–A80.
Danna, A., & Gandy, O. H. (2002). All that glitters is not gold: Digging beneath the surface of data mining. Journal of Business Ethics, 40(4), 373–386. https://doi.org/10.1023/A:1020845814009.
Datta, S., Tiwari, A. K., & Shylajan, C. S. (2018). An empirical analysis of nature, magnitude and determinants of farmers’ indebtedness in India. International Journal of Social Economics, 45(6), 888–908. https://doi.org/10.1108/IJSE-11-2016-0319.
de Nicola, F. (2015). Handling the weather: Insurance, savings, and credit in West Africa. Washington: The World Bank. https://doi.org/10.1596/1813-9450-7187.
Devalkar, S. K., Seshadri, S., Ghosh, C., & Mathias, A. (2017). Data science applications in Indian agriculture. Production and Operations Management. https://doi.org/10.1111/poms.12834.
Directorate of Economics & Statistics. (2017). Manual on Crop Estimation Survey (Crop Cutting Experiment). Government of Meghalaya. http://megplanning.gov.in/statistics/Manual%20of%20Crop%20Cutting%20Experiment.PDF. Accessed 15 July 2018.
Downey, I., Segovia, M., & Harrison, C. D. (2017). Opportunities to use satellite technologies for asset condition monitoring of power networks under the European Space Agency’s Integrated Applications Promotion programme. CIRED - Open Access Proceedings Journal, 2017(1), 376–379. https://doi.org/10.1049/oap-cired.2017.0835.
Eisenhardt, K. M. (1989). Building theories from case study research. Academy of Management Review, 14(4), 532–550. https://doi.org/10.5465/amr.1989.4308385.
Elabed, G., & Carter, M. R. (2015). Compound-risk aversion, ambiguity and the willingness to pay for microinsurance. Journal of Economic Behavior & Organization, 118, 150–166. https://doi.org/10.1016/j.jebo.2015.03.002.
Falco, S. D., Adinolfi, F., Bozzola, M., & Capitanio, F. (2014). Crop insurance as a strategy for adapting to climate change. Journal of Agricultural Economics, 65(2), 485–504. https://doi.org/10.1111/1477-9552.12053.
Fisman, R., Paravisini, D., & Vig, V. (2017). Cultural proximity and loan outcomes. American Economic Review, 107(2), 457–492. https://doi.org/10.1257/aer.20120942.
Foltz, J. D. (2004). Credit market access and profitability in Tunisian agriculture. Agricultural Economics, 30(3), 229–240. https://doi.org/10.1016/j.agecon.2002.12.003.
Gill, A. (2016). Agricultural credit in Punjab: Have policy initiatives made a dent in informal credit markets? In Economic Transformation of a Developing Economy (pp. 165–182). Springer, Singapore. https://doi.org/10.1007/978-981-10-0197-0_8
Gill, A., & Singh, L. (2006). Farmers’ suicides and response of public policy: Evidence, diagnosis and alternatives from Punjab. Economic and Political Weekly, 41(26), 2762–2768.
Gomes, E. G., & Lins, M. P. E. (2002). Integrating geographical information systems and multi-criteria methods: A case study. Annals of Operations Research, 116(1), 243–269. https://doi.org/10.1023/A:1021344700828.
Gouri, K. V., & Mahajan, V. (2017). Different models of financing small farmers’ agricultural value chains. In Financing agriculture value chains in india (pp. 33–53). Springer, Singapore. https://doi.org/10.1007/978-981-10-5957-5_3
Government of Telengana. (2017). Crop estimation surveys on food and non-food crops. Government of Telengana. http://ecostat.telangana.gov.in/PDF/ACT_Manual/CS.PDF. Accessed 1 August 2018.
Guérin, I., D’Espallier, B., & Venkatasubramanian, G. (2013). Debt in rural South India: Fragmentation, social regulation and discrimination. The Journal of Development Studies, 49(9), 1155–1171. https://doi.org/10.1080/00220388.2012.720365.
Gulati, A., Terway, P., & Hussain, S. (2018). Crop insurance in India: Key issues and way forward (Working Paper No. 352). Working Paper. https://www.econstor.eu/handle/10419/176379. Accessed 16 June 2018.
Halcrow, H. G. (1949). Actuarial structures for crop insurance. American Journal of Agricultural Economics, 31(3), 418–443. https://doi.org/10.2307/1232330.
Harrison, M. (2005). An introduction to business and management ethics. London: Macmillan International Higher Education.
Houborg, R., & McCabe, M. F. (2016). High-resolution NDVI from Planet’s constellation of earth observing nano-satellites: A new data source for precision agriculture. Remote Sensing, 8(9), 768. https://doi.org/10.3390/rs8090768.
Iyer, A. (2019). Farm loan defaults rise as banks brace for big write-offs. Livemint. https://www.livemint.com/Money/zGCwqSp6LUfw8rP6Vg48SO/Agriculture-loan-defaults-increase-as-banks-brace-for-big-wr.html. Accessed 18 April 2019.
Jagadish, H. V., Gehrke, J., Labrinidis, A., Papakonstantinou, Y., Patel, J. M., Ramakrishnan, R., et al. (2014). Big data and its technical challenges. Communications of the ACM, 57(7), 86–94. https://doi.org/10.1145/2611567.
Jayan, T. V. (2017). Why cotton sowing is surging in Haryana. The Hindu Business Line. Sirsa. https://www.thehindubusinessline.com/economy/agri-business/why-cotton-sowing-is-surging-in-haryana/article9747237.ece. Accessed 31 July 2018.
Jin, X., Wah, B. W., Cheng, X., & Wang, Y. (2015). Significance and challenges of big data research. Big Data Research, 2(2), 59–64. https://doi.org/10.1016/j.bdr.2015.01.006.
Kakodkar, P. (2018). Only 7% insurance claims for 2017 kharif crop paid in Maharashtra. The Times of India. Mumbai. https://timesofindia.indiatimes.com/city/mumbai/only-7-insurance-claims-for-2017-kharif-crop-paid-in-maha/articleshow/64337029.cms. Accessed 20 July 2018.
Kaplan, B., & Duchon, D. (1988). Combining qualitative and quantitative methods in information systems research: A case study. MIS Quarterly, 12(4), 571–586. https://doi.org/10.2307/249133.
Krishnan, K. P., & Panchapagesan, V. (2016). Distortions in land markets and their implications for credit generation in India (Working Paper). Indian Institute of Management Bangalore. http://research.iimb.ernet.in/handle/123456789/7781. Accessed 30 July 2018.
Kshetri, N. (2014). The emerging role of Big Data in key development issues: Opportunities, challenges, and concerns. Big Data & Society, 1(2), 2053951714564227. https://doi.org/10.1177/2053951714564227.
Kshetri, N. (2016). Big data’s role in expanding access to financial services in China. International Journal of Information Management, 36(3), 297–308. https://doi.org/10.1016/j.ijinfomgt.2015.11.014.
Kumar, S. M. (2013). Does access to formal agricultural credit depend on caste? World Development, 43, 315–328. https://doi.org/10.1016/j.worlddev.2012.11.001.
Kumar, C. S., Turvey, C. G., & Kropp, J. D. (2013). The impact of credit constraints on farm households: Survey results from India and China. Applied Economic Perspectives and Policy, 35(3), 508–527. https://doi.org/10.1093/aepp/ppt002.
Lensink, R., Winkel, A., Bulte, E., Marr, A., & van Asseldonk, M. (2016). Adoption and impact of index-insurance and credit for smallholder farmers in developing countries: A systematic review. Agricultural Finance Review, 76(1), 94–118. https://doi.org/10.1108/AFR-11-2015-0050.
Liu, P., & Yi, S. (2018a). A study on supply chain investment decision-making and coordination in the Big Data environment. Annals of Operations Research, 270(1), 235–253. https://doi.org/10.1007/s10479-017-2424-4.
Liu, P., & Yi, S. (2018b). Investment decision-making and coordination of a three-stage supply chain considering Data Company in the Big Data era. Annals of Operations Research, 270(1), 255–271. https://doi.org/10.1007/s10479-018-2783-5.
Mahul, O. S., & Charles, J. (2010). Government support to agricultural insurance. Washington: The World Bank. https://doi.org/10.1596/978-0-8213-8217-2.
Mahul, O., Verma, N., & Clarke, D. J. (2012). Improving Farmers’ Access to Agricultural Insurance in India. Washington: The World Bank. https://doi.org/10.1596/1813-9450-5987.
Manogaran, G., & Lopez, D. (2018). Spatial cumulative sum algorithm with big data analytics for climate change detection. Computers & Electrical Engineering, 65, 207–221. https://doi.org/10.1016/j.compeleceng.2017.04.006.
Martin, K. E. (2015). Ethical Issues in the Big Data Industry (SSRN Scholarly Paper No. ID 2598956). Rochester, NY: Social Science Research Network. https://papers.ssrn.com/abstract=2598956. Accessed 27 July 2018.
Mathieson, K. (2007). Towards a design science of ethical decision support. Journal of Business Ethics, 76(3), 269–292. https://doi.org/10.1007/s10551-006-9281-4.
Ministry of Agriculture & Farmers Welfare. (2016). Operational guidelines of “Pradhan Mantri Fasal Bima Yojana” (PMFBY). Department of Agriculture, Cooperation and Farmers Welfare. http://www.agri-insurance.gov.in/PMFBY.aspx. Accessed 6 July 2018.
Miranda, M. J., & Farrin, K. (2012). Index insurance for developing countries. Applied Economic Perspectives and Policy, 34(3), 391–427. https://doi.org/10.1093/aepp/pps031.
Mishra, S. (2006). Farmers’ suicides in Maharashtra. Economic and Political Weekly, 41(16), 1538–1545.
Nagendra, N. P., Narayanamurthy, G., & Moser, R. (2020b). Management of humanitarian relief operations using satellite big data analytics: The case of Kerala floods. Annals of Operations Research. https://doi.org/10.1007/s10479-020-03593-w.
Nagendra, N. P., Narayanamurthy, G., Moser, R., & Singh, A. (2020a). Open innovation using satellite imagery for initial site assessment of solar photovoltaic projects. IEEE Transactions on Engineering Management. https://doi.org/10.1109/TEM.2019.2955315.
Nagendra, N. P., & Segert, T. (2017). Challenges for NewSpace commercial earth observation small satellites. New Space, 5(4), 238–243. https://doi.org/10.1089/space.2017.0014.
Nair, R. (2010). Crop insurance in India: Changes and challenges. Economic and Political Weekly, 45(6), 19–22.
Narayanan, S. (2016). The productivity of agricultural credit in India. Agricultural Economics, 47(4), 399–409. https://doi.org/10.1111/agec.12239.
Pal, D. (2015). Linking credit with other markets: A review of the issues in rural economies. Forum for Development Studies, 42(1), 159–178. https://doi.org/10.1080/08039410.2014.974666.
Press Information Bureau. (2017). Benefits of new Crop Insurance Schemes. Government of India - Ministry of Agriculture & Farmers Welfare. http://pib.nic.in/newsite/PrintRelease.aspx?relid=169927. Accessed 20 July 2018.
Rao, K. N. (2010). Index based crop insurance. Agriculture and Agricultural Science Procedia, 1, 193–203. https://doi.org/10.1016/j.aaspro.2010.09.024.
Reed, B. C., Brown, J. F., VanderZee, D., Loveland, T. R., Merchant, J. W., & Ohlen, D. O. (1994). Measuring phenological variability from satellite imagery. Journal of Vegetation Science, 5(5), 703–714. https://doi.org/10.2307/3235884.
Rembold, F., Atzberger, C., Savin, I., & Rojas, O. (2013). Using low resolution satellite imagery for yield prediction and yield anomaly detection. Remote Sensing, 5(4), 1704–1733. https://doi.org/10.3390/rs5041704.
Römer, U., & Musshoff, O. (2017). Can agricultural credit scoring for microfinance institutions be implemented and improved by weather data? Agricultural Finance Review, 78(1), 83–97. https://doi.org/10.1108/AFR-11-2016-0082.
Saxena, R., Chand, R., & Rana, S. (2015). Estimates and Analysis of Farm Income in India, 1983–84 to 2011–12. Economic and Political Weekly, 50(22). https://www.epw.in/journal/2015/22/special-articles/estimates-and-analysis-farm-income-india-1983-84-2011-12.html. Accessed 4 August 2018.
Sethi, R. M. (2011). Socio-economic Profile of Rural India (series II): North and central India (Punjab, Haryana, Himachal Pradesh and Madhya Pradesh). Delhi: Concept Publishing Company.
Shilton, K., & Greene, D. (2019). Linking platforms, practices, and developer ethics: Levers for privacy discourse in mobile application development. Journal of Business Ethics, 155(1), 131–146. https://doi.org/10.1007/s10551-017-3504-8.
Siggelkow, N. (2007). Persuasion with case studies. Academy of Management Journal, 50(1), 20–24. https://doi.org/10.5465/amj.2007.24160882.
Sinha, S. (2004). Agriculture insurance in India: Scope for participation of private insurers. Economic and Political Weekly, 39(25), 2605–2612.
The Times of India. (2017). farmers loan waiver: Farmers wilfully defaulting on loans in hope of waiver. The Times of India. https://timesofindia.indiatimes.com/india/farmers-wilfully-defaulting-on-loans-in-hope-of-waiver/articleshow/59117193.cms. Accessed 18 April 2019.
Toth, C., & Jóźków, G. (2016). Remote s ensing platforms and sensors: A survey. ISPRS Journal of Photogrammetry a nd Remote Sensing, 115, 22–36.
Vyas, V. S. (2004). Agrarian distress: Strategies to protect vulnerable sections. Economic and Political Weekly, 39(52), 5576–5582.
Wolfert, S., Ge, L., Verdouw, C., & Bogaardt, M.-J. (2017). Big data in smart farming—A review. Agricultural Systems, 153, 69–80. https://doi.org/10.1016/j.agsy.2017.01.023.
Yin, R. K. (1994). Case study research: Design and methods. Thousand Oaks: Sage Publications.
Acknowledgements
We authors would like to thank the firm `SatSure' for allowing us to access the big data analytics cloud platform and interact with their employees. Thorough observations of the team which built and deployed the technology platform for agri-insurance providers were conducted. We appreciate the efforts of Mr. Prateep Basu in explaining the underlying data structure and technicalities involved.
Author information
Authors and Affiliations
Corresponding author
Additional information
Publisher's Note
Springer Nature remains neutral with regard to jurisdictional claims in published maps and institutional affiliations.
Rights and permissions
Open Access This article is licensed under a Creative Commons Attribution 4.0 International License, which permits use, sharing, adaptation, distribution and reproduction in any medium or format, as long as you give appropriate credit to the original author(s) and the source, provide a link to the Creative Commons licence, and indicate if changes were made. The images or other third party material in this article are included in the article's Creative Commons licence, unless indicated otherwise in a credit line to the material. If material is not included in the article's Creative Commons licence and your intended use is not permitted by statutory regulation or exceeds the permitted use, you will need to obtain permission directly from the copyright holder. To view a copy of this licence, visit http://creativecommons.org/licenses/by/4.0/.
About this article

Cite this article
Nagendra, N.P., Narayanamurthy, G. & Moser, R. Satellite big data analytics for ethical decision making in farmer’s insurance claim settlement: minimization of type-I and type-II errors. Ann Oper Res 315, 1061–1082 (2022). https://doi.org/10.1007/s10479-020-03793-4
Accepted:
Published:
Issue Date:
DOI: https://doi.org/10.1007/s10479-020-03793-4