
Abstract
Azaspiracids (AZAs) are secondary metabolites of Azadinium spinosum that can accumulate in shellfish and cause food poisoning when consumed. We describe here an analytical procedure for the determination of AZAs in cultures of A. spinosum with a focus on the formation of AZA methyl esters as artefacts during extraction and sample pre-treatment. A. spinosum cells were collected from bioreactor cultures using centrifugation or filtration. Different extraction procedures were evaluated for formation of methyl ester artefacts, yield, and matrix effects. Filtration of cultures using glass-fibre filters led to increased formation of methyl esters, and centrifugation is recommended for recovery of cells. The extraction solvent (methanol (MeOH), acetone, and acetonitrile (MeCN)) did not significantly affect the yield of AZAs as long as the organic content was 80% or higher. However, the use of MeOH as extraction solvent led to increased formation of methyl esters. AZA1 recovery over two successive extractions was 100% at the 95% confidence level for acetone and MeOH. In standard-addition experiments, no significant matrix effects were observed in extracts of A. spinosum or Azadinium obesum up to a sample size of 4.5 × 109 μm3. Moreover, experiments carried out to clarify the formation and structure of methylated AZA analogues led to the description of two AZA methyl esters and to the correction of the chemical structures of AZAs29–32.
Introduction
Harmful algal blooms are widespread throughout the world, frequently causing problems to public health through consumption of contaminated shellfish and, amongst these, azaspiracid shellfish poisoning is the most recently identified syndrome. In 1995, human intoxication occurred in the Netherlands after consumption of mussels from Ireland (Killary Harbour), with symptoms typical for diarrhetic shellfish poisoning. The incident caused diarrhea, nausea, vomiting and stomach cramps in consumers; however, only very low levels of OA-group toxins were found in mussels [1]. A new toxin named azaspiracid (AZA; now referred to as Azaspiracid-1 (AZA1) (Fig. 1)) was identified 3 years later [2], with its structure being revised after synthetic studies [3]. AZAs4–5 were subsequently isolated from contaminated mussels and their structures established using mass spectrometry and NMR spectroscopy [4,5]. Additional AZAs have since been identified and structures proposed based on mass spectrometry, and the group now comprises 32 analogues, including several hypothetical compounds and artefacts [6,7]. Since their initial discovery, AZAs have been found in Europe, Africa, and more lately in America and in Japan [8–14].

Structures of AZAs1 and 2 and their methyl and (9-anthryl)methyl derivatives
Even though consumption of AZA-contaminated shellfish has caused public health problems since 1995, it was not until 2003 that AZAs were detected in plankton, namely in the dinoflagellate Protoperidinium crassipes [15]. However, a question rapidly arose over whether this organism was an actual AZA producer or whether it was a predator which accumulated the toxin from another organism [16,17]. As P. crassipes is a heterotrophic dinoflagellate [18] capable of accumulating phycotoxins [19], and since culturing did not result in AZA production (Tillmann and Krock, unpublished data in Ref. [20]), research focussed on possible prey of this species. During a cruise in 2007, a dinoflagellate source of AZAs (strain 3D9), was discovered [21]. This organism was found to contain AZAs1 and 2 in the field, and produced de novo AZAs1 and 2 in axenic culture [20,22]. The organism, a small (12–16 μm length and 7–11 μm width) peridinin-containing photosynthetic dinoflagellate with a thin theca, was formally described by Tillmann et al. [20] and named Azadinium spinosum. This species was the type-species for a new genus and was soon joined by two non-AZA-producing species: Azadinium obesum (2E10) [23], a somewhat larger organism (13–18 μm length and 10–14 μm width), and Azadinium poporum, which is similar in size to A. spinosum but has a slightly lower mean cell length/width ratio (11–16 μm length and 8–12 μm width) [24]. Interestingly, since the morphological description of A. spinosum, strains of this organism have also been reported from Mexico [25], Argentina [26], Italy, and France (personal communication, Siano and Nézan, Ifremer, France) and, as to be expected, from Ireland [27]. As the organism appears to be widespread in many oceans and since AZAs have been reported from many locations, azaspiracid poisoning should be considered of global concern. We have therefore cultivated this organism to better understand the ecophysiology of Azadinium, its toxin production and the kinetics of AZA accumulation in shellfish. Finally, quantitative knowledge of the AZA production by A. spinosum is also essential information for the sustainable production of toxins for toxicology experiments and instrument calibration.
In previous studies, the cellular quota of AZAs was highly variable, ranging from 5 to 40 fg cell−1 [20,27] while in our own studies we found up to 100 fg cell−1. Such differences may arise from differences in either culture conditions or in analytical procedures, including extraction, recovery in sample pre-treatment, or matrix effects in the final determination using liquid chromatography coupled to tandem mass spectrometry (LC-MS/MS). Consequently, studies on environmental and nutritional factors affecting A. spinosum growth and toxicity will require standardised analysis of cells and culture media for their toxin content. Therefore, we decided to investigate the analysis of AZAs from cultures of A. spinosum.
Like other lipophilic toxins, AZAs are typically extracted from phytoplankton or contaminated bivalves with organic solvents [28]. Historically, acetone has been used to extract lipophilic toxins from shellfish for the mouse bioassay, whereas methanol (MeOH) and mixtures of MeOH–water have been used for extraction prior to LC-MS/MS analysis [16,29]. These procedures result in crude extracts that typically cause matrix effects (signal enhancement or reduction) in LC-MS/MS analysis [30]. Matrix effects have been reported in quantitation of AZAs in mussels by LC-MS/MS using different technical approaches [31], and possible solutions were proposed [32,33]. Therefore, matrix effects also need to be evaluated in analytical procedures for quantitation of AZAs in phytoplankton.
A novel AZA analogue observed by Krock et al. [22], and provisionally denoted as ‘AZAX’, was detected in methanolic extracts of Azadinium cultures, and possessed a molecular ion corresponding to that of AZA1 methyl ester. However, the relative retention time of AZAX did not appear to match that originally reported for AZA1 methyl ester [34] (denoted as AZA30 by these authors). Therefore, clarification of the structures and mechanisms of formation of methylated AZA artefacts was required.
The determination of AZA metabolites, and the identification of artefacts formed during analytical procedures, is important for the subsequent assessment of metabolism in shellfish, other aquatic organisms, and mammalian systems. Thus, the present study describes the development of a quantitative analytical method for the determination of AZAs in cultures of A. spinosum, clarifies the structures of methylated derivatives of AZAs, and explains the formation of AZA methyl esters as artefacts from the extraction of A. spinosum cells with MeOH, and of AZA methyl ketals as artefacts of storage in MeOH.
Materials and methods
Culture condition and cell count
Two species of Azadinium were used: the producer of AZAs1 and 2, A. spinosum (clone 3D9) and the non-AZA-producing species A. obesum (clone 2E10). Both strains were grown using K modified medium [35], without NH4Cl and with Na2SeO3 (10−8 M), at 18 °C with a photon flux density of 200 μmol m−2 s−1 and a photoperiod of 16 h of light and 8 h of dark, in a 2.5- or 100-L chemostat. Algae were sampled at steady state in continuous culture. Cell densities and cellular volume were determined using a particle counter (Multisizer 3 Coulter counter, Beckman).
Reagents
MeOH, acetone, acetonitrile (MeCN), ethanol (EtOH), and dichloromethane (DCM) were obtained as HPLC grade solvents from JT Baker and Sigma Aldrich. Formic acid (Puriss quality), ammonium formate (Purity for MS), methanol-d4 (99.8%), N-methyl-N-nitroso-p-toluenesulfonamide, di(ethylene glycol)ethyl ether and 9-anthraldehyde were obtained from Sigma-Aldrich. Milli-Q water for HPLC was produced in-house using a Milli-Q integral 3 system (Millipore).
Spiking experiments were carried out using AZA1 purified by Hess in collaboration with Satake in Japan (2001), according to published procedures [5]. AZA1 calibrants for LC-MS/MS analysis were dilutions of either certified AZA1 (CRM-AZA1, National Research Council Canada (NRCC), Halifax, Canada), or using the above AZA1 purified in Japan (calibrated against CRM-AZA1).
LC-MS/MS analysis
The samples were analysed by LC-MS/MS using an Agilent 1100 LC coupled to a triple quadrupole mass spectrometer (API 2000, Applied Biosystems), a UFLCxr (Shimadzu) coupled to a triple quadrupole hybrid mass spectrometer Q-trap (API 4000QTRAP, Applied Biosystems), and an Agilent 1200 HPLC coupled to an Agilent 6540 QTOF instrument equipped with an electrospray ionization source for quantitation and accurate mass spectral analysis of AZAs.
Liquid chromatography
HPLC was carried out using BDS-Hypersil C8 (50 × 2 mm, 3 μm and 150 × 2.1 mm, 3 μm), MOS-Hyperclone C8 (50 × 2 mm, 3 μm) and Hypersil-Gold C18 (50 × 2 mm (i.d.), 2 μm) silica-based reversed phase columns (Thermo Scientific). Injection volumes were 5 μL. The A and B mobile phases were 100% water and acetonitrile/water (95:5, v/v) respectively, both containing 2-mM ammonium formate and 50-mM formic acid.
The 50-mm BDS-Hypersil column was eluted isocratically at 250 μL min−1 (75% B) at 20 °C for 5–10 min, depending on which analogues were analysed. The MOS-Hyperclone C8 column was used in gradient elution mode (200 μL min−1 at 20 °C) starting with 70% B rising to 100% B at 2.5 min, held for 4.5 min, decreasing to 70% B over 6 min, and held for 5 min until the next run.
The 150-mm BDS-Hypersil C8 column was used in gradient elution mode (200 μL min−1 at 30 °C) for acquisition of accurate mass data, starting with 25% B rising to 100% B at 12 min, held for 8 min, decreasing to 25% B over 1 min, and held for 10 min until the next run.
The Hypersil Gold C18 column was eluted with a gradient for determination of AZAs and AZA ADAM derivatives, starting with 62.5% B rising to 100% B at 4 min, held for 5 min, decreasing to 62.5% B over 0.5 min, and held for 5 min until the next run.
Mass spectrometry
Multiple reaction monitoring (MRM) and fragmentation experiments were performed in positive ion mode under the conditions given in Table 1. Selected ion monitoring (SIM) was performed in negative mode. The following MRM transitions were monitored: AZA1, m/z 842.5→824.5, 842.5→672.5; AZAs2 and 1 methyl ester, m/z 856.5→838.5, 856.5→672.5; AZA2 methyl ester, m/z 870.5→852.5, 870.5→672.5; AZA1 d 3-methyl ester, m/z 859.5→841.5, 859.5→672.5; AZA2 d 3-methyl ester, m/z 873.5→855.5, 873.5→672.5; AZA1 methyl ketal (AZA30), m/z 856.5→824.5; 856.5→672.5; AZA2 methyl ketal (AZA32), m/z 870.5→838.5; 870.5→672.5; AZA1 (9-anthryl)methyl ester, m/z 1032.6→672.5; AZA2 (9-anthryl)methyl ester and AZA1 methyl ketal (9-anthryl)methyl ester, m/z 1046.6→672.5; and AZA2 methyl ketal (9-anthryl)methyl ester, m/z 1050.6→672.5. The following [M−H]− ions were monitored in SIM mode: AZA1, m/z 840.5; AZA2, AZA1 methyl ester and AZA1 methyl ketal, m/z 854.5; AZA2 methyl ester m/z 868.5. Quantitation was carried out using external calibration against AZA1, with Analyst 1.5 software (Applied Biosystems).
Accurate mass data were acquired on an Agilent 6540 QTOF operated in positive mode, with full-scan analysis over m/z 100–1,000 at one scan/s and targeted MS/MS analysis at five scans/s. Capillary and fragmentor voltages were 4,000 and 220 V, respectively. The Jet Stream Technology source was set at 300 °C with a drying gas flow at 8 L/min and a sheath gas flow of 12 L/min at 400 °C. Three collision energies (30, 50 and 70 V) were applied to the precursor ions to study fragmentation pathways.
Identification of AZAs1 and 2 methyl esters and structure confirmation
-
(a)
The effect of heat treatment of the filters containing A. spinosum samples on the formation of AZA methyl esters was tested to determine whether their formation was enzyme-catalysed. Triplicate aliquots of A. spinosum culture (10 mL) were filtered using GF/C filters and the filters (with cells) were placed in a 1.5 mL Eppendorf tubes. Two types of heat treatment were tested to suppress enzymatic activity: (1) microwaving for 2 min at 800 W, or (2) placing in a water bath at 100 °C for 30 min. A control, without heat treatment, was prepared in parallel. Each sample was then extracted with MeOH (5 × 0.5 mL; described below).
-
(b)
The formation of AZA methyl esters was studied during extraction and reconstitution with MeOH and deuterated MeOH (CD3OD). The procedure in Fig. 2 was used with the following solvents: (a) extraction with MeOH, reconstitution with MeOH; (b) extraction with MeOH, reconstitution with CD3OD; and (c) extraction with CD3OD, reconstitution with CD3OD.
Fig. 2 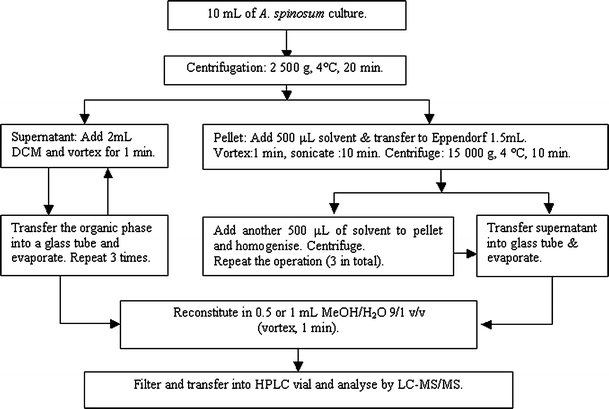
Sample preparation scheme for extraction of AZAs from A. spinosum
-
(c)
Treatment with diazomethane, which derivatises carboxylic acids as their methyl esters, was used to synthesise AZAs1 and 2 methyl esters. A methanolic extract from A. spinosum (0.5 mL) containing AZAs1 and 2 was added to the outside tube of an Aldrich diazomethane generator with System 45 connection, and 1 mL MeOH and 1.5 mL Et2O were added. Diazomethane was generated in the inner tube of the apparatus and allowed to react in situ with the extract, following the manufacturer’s protocol [36]. After reacting for 45 min at 0 °C with occasional swirling, the extract was transferred to a glass vial, evaporated to dryness under a stream of N2, and the residue dissolved in MeOH (1 mL) for LC-MS analysis.
-
(d)
A sample containing AZAs30 and 32 was obtained from an experiment studying storage of AZAs1 and 2 standards in MeOH (NRCC).
-
(e)
Samples containing AZAs1 and 2 methyl esters, and AZAs30, and 32 (AZAs1 and 2 methyl ketals), were treated with sodium periodate as described by Rehmann et al. [7], then analysed by LC-MS/MS or by LC-MS in negative ion SIM mode. The same samples were also derivatised with 9-anthryldiazomethane, which derivatises carboxylic acids as their (9-anthryl) methyl esters, and analysed by LC-MS in positive ion MRM mode as described by McCarron et al. [37].

Protocols for the determination of extra- and intra-cellular portion of AZAs
Procedures for AZA extraction evaluated in this study were based on the following standard protocols.
Samples (10 mL) were collected from A. spinosum cultures and centrifuged (2,500×g, 20 min, 4 °C) in 15-mL centrifuge tubes. The culture supernatant was collected for liquid–liquid extraction as described below, and the pellet was re-suspended in 500 μL of solvent and bath-sonicated (10 min) after transferring to a 1.5-mL Eppendorf tube. After sonication, the aliquot was centrifuged (15,000×g, 10 min, 4 °C). The supernatant was transferred to a 5 mL glass tube and gently evaporated under nitrogen on a heating block at 35 °C. This process was repeated so that the pellet was extracted three times in total (the number of repetitions varied as a function of the experiment, but three successive extractions were generally used) and, following evaporation of the combined supernatants from each step, the residue was reconstituted in 500 or 1,000 μL MeOH–H2O (9:1, v/v). Subsequently, the sample was filtered with a NANOSEP MF centrifugal device (PALL, 0.2 μm, 1.5-mL vial with filter insert; 15,000×g, 5 min, 4 °C) and transferred to an HPLC vial with insert (Fig. 2).
The supernatant from centrifugation of the algal culture was transferred to a 15-mL tube and 2 mL of DCM added. The mixture was homogenised (1 min vortexing), centrifuged (2,500×g, 10 min, 4 °C), and the organic phase transferred to a 15-mL glass tube. The supernatant was extracted three times in this manner, the resulting DCM extract evaporated under nitrogen on a heating block at 35 °C, and the residue was reconstituted and filtered as above (Fig. 2).
The above extraction protocol was used to evaluate the following aspects of A. spinosum extraction:
-
(a)
Effect of sample size, and residence time of A. spinosum in a 15-mL centrifuge tube prior analysis, on intra- an extra-cellular AZA content. The aliquots were preserved with neutral Lugol and immediately observed using a Nageotte cell-counting chamber. During the experiment, the aliquots were maintained at room temperature (18 ± 2 °C).
-
(b)
Influence of procedures for separation of algal cells from the culture medium (filtration and centrifugation) on intra- and extra-cellular AZA content.
-
(c)
Effect of extraction solvent on yield and artefact formation.
-
(d)
Effect of algal matrix on recovery on the standard procedure.
Matrix effects in LC-MS/MS analyses of culture extracts
Matrix effects were evaluated using the following approaches:
-
(a)
AZA1 addition to a constant amount of algal matrix. A. obesum culture medium (10 mL) was extracted using the standard procedure (Fig. 2) with MeOH–H2O (9:1) or acetone–H2O (9:1, v/v). Reconstitution was carried out in triplicate using an AZA1 solution and MeOH, to obtain AZA1 concentrations ranging from 5.3 to 213 ng mL−1.
-
(b)
The same extraction was applied as for (a) above, but with A. spinosum culture medium.
-
(c)
Matrix addition to a constant AZA concentration. Samples of a culture of A. obesum (58,000 ± 1,000 cells mL−1, 83.3 × 106 μm3 mL−1; 0.62, 3.1, 6.2, 10, 21, and 50 mL) were extracted in triplicate (Fig. 2) using MeOH–H2O (9:1) or acetone–H2O (9:1, v/v) and reconstituted with 40 μL of AZA1 solution and 460 μL of MeOH–H2O (9:1, v/v) to give an AZA1 concentration of 42.7 ng mL−1.
Statistical analysis
All data are expressed as mean ± standard deviation. Depending on the data, statistical analyses consisted either of multifactorial analysis of variance, one-way analysis of variance (ANOVA), or a Kruskal–Wallis test, followed, when necessary, by a Fisher’s least significant difference procedure or a box-and-whisker plot. Differences were considered significant at p < 0.05. Statistical analyses were carried out using Statgraphics Centurion XV.I (StatPoint Technologies, Inc.). Before each ANOVA analysis or Kruskal–Wallis test, normality and equality of variance were tested to decide which tests were going to be used.
Results and discussion
Identification of AZAs1 and 2 methyl esters and structure confirmation
A late-eluting LC-MS peak in A. spinosum extracts, provisionally denoted as AZAX, was previously identified as a possible isomer of AZA2 (or a methylated AZA1 analogue), based on retention time and mass [20,21]. The present work demonstrated the artefactual formation of methylated derivatives of AZAs1 and 2 during extraction of A. spinosum cultures, and procedures that reduce their formation. However, the mechanism of formation and identities of these analogues were unclear.
Enzymatic activity can modify the chemical structure of toxins when extracting phytoplankton [38]. To test whether this might be the case for AZAs, the filters containing A. spinosum were heated in a water bath or microwave before extraction. Neither procedure reduced the formation of methylated analogues of AZA1 nor 2, indicating that enzymatic activity of the alga is not responsible for the formation of the methylated analogues.
Brondz et al. [39] reported that extractions of natural products with MeOH may produce methyl esters of fatty acids or other molecules with a carboxylic acid groups. Methyl esters of AZAs (now known to be methyl ketals, see below) have also been reported as storage artefacts [7], and the proportion of these was reduced when acetone, MeCN or DCM were used (Tables 2 and 3).
To confirm that the two methylated analogues (subsequently identified as AZA1 and 2 methyl esters) were artefacts of the extraction/reconstitution process, and to determine at which stage formation occurred, extraction and reconstitution were carried out using MeOH or CD3OD. The formation of methylated analogues took place mainly during extraction but also, to a lesser degree, during reconstitution (Fig. 3). Therefore, these two analogues were now clearly identified as artefacts from extraction with MeOH, and were suspected to be AZA1 and -2 methyl esters. Methyl esters of AZAs1–3 and 6, denoted as AZAs29–32, were reported by Rehmann et al. and were identified as artefacts of storage in MeOH [7]. Specimens containing AZAs30 and 32 as artefacts of long-term storage in MeOH from NRCC were analysed by LC-MS/MS (Figs. 4, 5, and 6). The retention times and mass spectra (API-4000, linear ion trap and Agilent 6540 QTOF) of AZAs30 and 32 were different to those of the two methylated AZA-extraction artefacts observed in the present study (Figs. 4 and 6). High-resolution mass spectrometry was consistent with the chemical formulae of the molecular structures and fragments (Table 4; Electronic supplementary material). The observation that the methylated extraction artefacts from the present study had identical retention times and mass spectra to semisynthetic AZAs1 and 2 methyl esters (produced by treatment with diazomethane) unambiguously identified these artefacts as the methyl esters (Figs. 4 and 5).

Percentages of AZA analogues from A. spinosum using centrifugation after: a extraction and reconstitution with MeOH, b extraction with MeOH and reconstitution with CD3OD, and c after extraction and reconstitution with CD3OD

High resolution mass spectra of: a AZA1, b AZA1 methyl ester of AZA1 obtained through extraction from A. spinosum, c semi-synthetic AZA1 methyl ester, and d AZA30 (AZA1 methyl ketal) obtained as an artefact of storage of AZA1 in MeOH

Structure and m/z for [M + H]+ ions of AZA1, AZA1 methyl ketal, AZA1 methyl ester, AZA1 bismethyl ketal ester, and MS/MS fragmentation with indicated groups

LC-MS chromatograms of AZAs obtained with an isocratic elution: a A. spinosum after extraction with acetone, b A. spinosum after extraction with MeOH, c semi-synthetic AZAs1 and 2 methyl esters produced with diazomethane, d AZA1 standard after long-term storage in MeOH, and e AZA2 standard after long-term storage in MeOH
Thus, AZAs30 and 32 are methylated derivatives of AZAs1 and 2, respectively, but are not methyl esters. Rehmann et al. [7] reported an initial loss of 32 amu in the mass spectra of AZAs30 and 32, suggesting the loss of MeOH. However, we observed only initial loss of 18 amu (H2O) in the mass spectra of authentic AZAs1 and 2 methyl esters (Table 4; Electronic supplementary material). A plausible hypothesis is that AZAs30 and 32 are 21-methyl ketals formed by exchange at the 21-OH hemi ketal of AZAs1 and 2, respectively, with MeOH. This proposal is consistent with the observed initial losses of H2O from AZAs1 and 2 and their methyl esters, and of CH3OH from the corresponding methyl ketals (Figs. 4 and 7). To test this hypothesis, samples containing AZAs1 and 2, their methyl esters, and AZAs30 and 32 were treated with periodate, which oxidatively cleaves the 20,21-diol in AZAs to form a lactone derivative (Fig. 7) under mild conditions [7,40]. LC-MS/MS analysis showed complete conversion of AZAs1 and 2, and of their methyl esters, to the lactone, whereas no detectable reaction occurred with AZAs30 and 32, indicating that the latter compounds have been modified in the 20,21-diol moiety (Fig. 7).

Fate of AZA1 and its methylated derivatives when treated with sodium periodate, which oxidatively cleaves the 20,21-diol group present in natural AZAs
LC-MS analysis in negative ion SIM mode [5] established the presence of a free carboxyl in AZAs30 and 32, and the absence of a free carboxyl in AZAs1 and 2 methyl esters. Only AZAs with free carboxylic acid groups would be negatively ionised in electrospray MS, and it was found that no signal was obtained for AZAs1 and 2 methyl esters while AZAs1, 2, 30, and 32 were detected (Electronic supplementary material). Additionally, derivatization with ADAM produced (9-anthryl)methyl ester derivatives of AZAs1, 2, 30, and 32 (yields, >98%), whereas the methyl esters of AZAs1 and 2 were unaffected (Fig. 1; Electronic supplementary material). These results strongly support the hypothesis that AZAs30 and 32 are the methyl ketals of AZAs1 and 2, respectively, and are not methyl esters as originally reported by Rehmann et al. [7], and it seems likely that this is also the case for AZAs29 and 31 (reported as methyl esters of AZAs3 and 6 by Rehmann et al. [7]). The methylation artefacts from extraction of A. spinosum cultures are unambiguously identified as AZAs1 and 2 methyl esters, and the ‘AZAX’ observed in methanolic extracts by Krock et al. [22] appears to be confirmed as AZA1 methyl ester (‘AZAX’ mass spectrum observed by Krock et al. is presented in the Electronic supplementary material).
Evaluation of extraction protocols of azaspiracid from A. spinosum
Particulate and dissolved toxins
After the aliquots were sampled from the bioreactor, intra- and extra-cellular toxin contents were determined in triplicate immediately or after resting periods, with different solvents, with an aliquot of culture (10 mL) taken to assess morphological changes for each of the resting periods.
In laboratory culture, AZAs produced by A. spinosum were clearly intra-cellular. When cells were gently separated from the culture medium either by filtration or centrifugation (no cells were detected under the inverted microscope in the filtrate or supernatant), the majority of toxins were found in the particulate fraction (95%). A significant loss of intra-cellular AZAs, with a concomitant increase in extra-cellular AZAs, was observed with increasing time between sampling and centrifugation. Apparently, increased residence time of cells in medium outside the bioreactor led to handling stress of the cells, which in turn resulted in a substantial loss of cell bound toxins to the dissolved phase (Electronic supplementary material). A significant loss of intra-cellular toxins (>10%) occurred when cells were stressed for more than 60 min, and a maximum proportion of extra-cellular toxins of 24% was observed after 5 h. Therefore, it is recommended that samples are centrifuged immediately when the cell quota of AZAs is being determined.
Microscopical observation showed that, under these stress conditions, an increasing number of cells without theca occurred, although cells generally kept their integrity (Electronic supplementary material). It is a common reaction among dinoflagellates to adverse conditions that cells leave their theca (ecdysis), which is often connected with the formation of temporary cysts [41]. This type of dinoflagellate cyst normally is round and surrounded by a cell wall. However, this has not yet been observed for A. spinosum. The reason for the increase in extra-cellular toxins is not clear; shedding of the cells outer layer including thecal plates and their membrane vesicles might be associated with a pulsed toxin loss or extruded protoplasts may have a higher exudation rate. However, the possibility that total disintegration of a small portion of the cells contributed to the increase of extra-cellular toxins cannot be excluded.
Effect of centrifugation and filtration on toxin recovery and profile
An initial experiment was carried out in triplicate with MeOH as extraction solvent to evaluate AZA yield after filtration of 10 mL of A. spinosum culture on GF/C glass microfiber filters (25-mm diameter), or after centrifugation (2,500×g, 4 °C, 20 min). Both filtrate and supernatant were kept for liquid–liquid extraction with DCM (Fig. 2). Five successive extractions were carried out on each filter or pellet, to ensure complete toxin recovery. A second trial was carried out under the same conditions using either MeOH or acetone as extraction solvent using three successive extractions.
The total amount of AZAs obtained after five successive extractions using MeOH was not significantly different when using either filtration or centrifugation as a method to separate cells from culture medium. If only three extractions with either MeOH or acetone were carried out, the yield was significantly lower (p < 0.05) when using filtration. Moreover, the AZA ratios were different for filtration compared with centrifugation (Table 2). High levels of AZAs1 and 2 methyl esters were obtained with filtration. Glass microfiber filters contain silica and are known to catalyse some reactions, which may possibly explain the methylation of AZAs1 and 2 observed in these experiments. If filtration is necessary, it is recommended to study other types of filters with A. spinosum (i.e. polycarbonate filters).
Influence of extraction solvent composition
To determine the procedure with the best extraction yield and minimal formation of artefacts (methylated AZAs), the extraction procedure described in Fig. 2 was applied using a variety of solvents and solvent compositions. Four experiments were carried out: (a) 100% MeOH, acetone, MeCN, EtOH, or DCM, (b) MeOH–H2O, 10:0, 9:1, 8:2, 7:3, and 6:4 (v/v), (c) acetone–H2O, 10:0, 9:1, 8:2, and 7:3 (v/v), (d) MeCN–H2O, acetone-H2O, and MeOH-H2O (10:0, 9:1 (v/v) each).
Between MeOH, acetone, MeCN, EtOH and DCM, no significant differences were observed on AZAs1 and 2 and total AZA contents. Nonetheless, significant differences were observed in the content of AZA1 methyl ester (Table 3), with increased formation of this derivative when extracting with MeOH or EtOH (in the following order MeOH = EtOH > acetone > MeCN > DCM). No ethyl analogue was observed when extracting with EtOH. It is not entirely clear how this methyl analogue formation occurs.
The formation of the methyl esters of AZAs1 and 2 was variable from one experiment to the next and concentrations of AZA1 methyl ester may range from 3% to 15% (Tables 2 and 3 and data not shown) when using MeOH as extraction solvent and centrifugation as separation technique.
As expected, the formation of AZA1 methyl ester is significantly reduced when extracting with acetone, MeCN and DCM, however, detectable traces are still formed with these solvents used in extraction. This observation led us to hypothesise that reconstitution in MeOH by itself may lead to formation of AZA methyl esters. This hypothesis has been confirmed using deuterated MeOH (see previous section).
It is common to add some water to an organic solvent to increase the extraction yield or to minimise the extraction of lipids which could lead to matrix effects [29]. However, in the present study, no statistical differences were observed between 100%, 90%, and 80% MeOH or acetone. Nonetheless, below a ratio of 7:3 organic solvent–H2O, the yield decreased and was significantly lower than with MeOH.
Extraction with acetone was considered to be most appropriate, as it reduces the formation of AZA methyl esters and is easier to handle thanks to its ease of evaporation and low toxicity. However, acetone extracts may also result in more complex crude extracts, as acetone is a good solvent for extracting lipids and pigments [42]. This was an additional reason to evaluate matrix effects in further trials.
Effect of sample size
The effect of sample size on the extraction yield was studied following the standard extraction procedure (Fig. 2) using acetone–H2O (9:1, v/v) as extraction solvent. The A. spinosum culture used for this experiment had a cell concentration of 161,000 ± 1,000 cells mL−1, corresponding to a biovolume of 92.6 × 106 μm3 mL−1. The following sample volumes were used: 0.62, 3.1, 6.2, 10, 31, and 50 mL.
The extraction yield differed significantly as a function of sample size. Yields were somewhat higher in the middle of the studied range (3.1–31 mL). More extraction cycles or higher solvent-to-sample ratios could potentially be used to increase AZA yield for the large sample size (50 mL). However, the procedure was not suitable for small amounts of biomass (<1–2 mL), potentially reflecting that small losses become significant when handling low amounts of toxin. Alternative protocols may need to be developed for samples below 200,000 cells, such as the procedure described during the identification of A. spinosum [20].
Recovery and yield after successive extractions in presence or absence of matrix
Extraction yield and recovery were tested following the standard procedure with one to five successive extractions with either MeOH–H2O or acetone–H2O (9:1, v/v), with or without matrix as follows:
-
(a)
Without matrix: AZA1 (40 μL) solution (0.53 μg mL−1) was transferred into 15-mL centrifuge tubes, and extracted with 500 μL of organic solvent water mixtures. The extract was reconstituted in 500 μL MeOH–H2O (9:1, v/v). A control in triplicate with 40 μL of AZA1 solution and 460 μL of MeOH–H2O (9/1, v/v) was used to estimate the recovery.
-
(b)
With algal matrix: aliquots (10 mL) of A. obesum culture (50,000 ± 2,000 cells mL−1, 65.2 × 106 μm3 mL−1) were centrifuged in 15-mL centrifuge tubes. After decanting the supernatant, AZA1 (40 μL) solution was added to the pellet, extracted as described above. The extract was reconstituted in 500 μL MeOH–H2O (9:1, v/v). For controls, A. obesum culture (10 mL) was extracted using MeOH–H2O or acetone–H2O (9:1, v/v) in triplicate (Fig. 2). The control extracts were evaporated to dryness and subsequently taken up with 460 μL MeOH–H2O (9:1, v/v) and 40 μL of AZA1 solution.
Two successive extractions were sufficient in all cases (100% of recovery at 95% confidence level) while three consecutive extractions reduced the deviations observed for triplicate samples. The presence of matrix did influence recovery. Without matrix, one extraction was almost sufficient to recover all AZA, whereas two successive extractions were necessary when A. obesum matrix was present. No significant differences were observed between acetone and MeOH on AZA recovery in the presence, or absence, of matrix when two or three successive extraction cycles were carried out.
Evaluation of matrix effects on LC-MS/MS analysis
Matrix effects were assessed for AZA1 using MeOH and acetone extracts of A. obesum (Fig. 8a, b, respectively), applying the standard addition method as described in Fux et al. [31]. Negligible effect (+1.4%) was observed when using MeOH, and more significant signal suppression (−8.4%) was observed with acetone. For A. spinosum, suppression effects of −7.7% and −6.4% were measured for MeOH and acetone extracts, respectively (Fig. 8c, d).

Slopes, intercepts, correlation coefficients for quantitation of AZA1 in methanolic or acetone extracts of A. obesum and A. spinosum spiked with standards (a–d) and as a function of the sample size (e) using LC-MS/MS with isocratic elution. Lines represent the least-squares correlation for quadruplicate injections of spiked matrix-free solutions (a–d) (dashed lines) and triplicate injection of spiked solutions with matrix (a–d) (solid lines). The solid lines in (e) represent the 95% confidence interval obtained from triplicate injection of spiked matrix-free MeOH solutions (notice initial response difference between (c) and (d) was due to different sampling day)
Following the approach used by Fux et al. [31] matrix effects were also assessed by varying matrix strength while maintaining a constant AZA1 concentration (Fig. 8e). No significant matrix effects were detected with different amounts of biomass, as all values measured were within the precision of the experiment.
Previously, matrix effects were considered significant at values greater than 10% enhancement or suppression [31,43], due to the repeatability of an analytical method with LC-MS/MS. Following this arbitrary limit of significance, the effects observed here for A. spinosum analysis can be considered insignificant. It should be stressed that the analysis of AZAs from A. spinosum at this scale typically deals with much less matrix content compared with shellfish. From large-scale extraction experiments (data not shown), it is estimated that the strongest matrix crude extract using MeOH in our study contained ca. 2 mg mL−1, which is at the lowest value of the range evaluated for a shellfish matrix by Fux et al. [31].
Conclusions
These results highlight the importance of carefully studying sample preparation, extraction procedures and solvent choice for assessing the recovery of the method and possible matrix effects.
Based on the results of this study, the following procedures are recommended for the analysis of AZAs1 and 2 in A. spinosum:
-
Sample and immediately separate the cells from the culture medium by centrifugation.
-
Extract AZAs with acetone or MeCN; acetone is most appropriate as it reduces both the formation of methyl analogues and is easy to handle thanks to its ease of evaporation and low toxicity. MeOH is inappropriate due to possible artefact formation.
-
Two to three successive extractions are suggested to ensure high extraction yield.
-
No significant matrix effects were observed during LC-MS/MS analysis with acetone or MeOH under the conditions tested.
This work clarifies the formation of AZA artefacts during extraction of A. spinosum, describes mass spectral fragmentation of two AZA methyl esters, and corrects the chemical structures of AZAs29–32. Furthermore, the procedure developed allows quantitation of AZAs in algal cultures and thus will facilitate the optimisation of processes aimed at the preparative isolation of AZAs required for the sustainable supply of AZAs for instrument calibration.
References
McMahon T, Silke J (1996) West coast of Ireland winter toxicity of unknown aetiology in mussels. Harmful Algae News 14:2
Satake M, Ofuji K, Naoki H, James KJ, Furey A, McMahon T, Silke J, Yasumoto T (1998) Azaspiracid, a new marine toxin having unique spiro ring assemblies, isolated from Irish mussels, Mytilus edulis. J Am Chem Soc 120:9967–9968
Nicolaou KC, Koftis TV, Vyskocil S, Petrovic G, Tang WJ, Frederick MO, Chen DYK, Li YW, Ling TT, Yamada YMA (2006) Total synthesis and structural elucidation of azaspiracid-1. Final assignment and total synthesis of the correct structure of azaspiracid-1. J Am Chem Soc 128:2859–2872
Ofuji K, Satake M, McMahon T, James KJ, Naoki H, Oshima Y, Yasumoto T (2001) Structures of azaspiracid analogs, azaspiracid-4 and azaspiracid-5, causative toxins of azaspiracid poisoning in Europe. Biosci Biotechnol Biochem 65:740–742
Ofuji K, Satake M, McMahon T, Silke J, James KJ, Naoki H, Oshima Y, Yasumoto T (1999) Two analogs of azaspiracid isolated from mussels, Mytilus edulis, involved in human intoxication in Ireland. Nat Toxins 7:99–102
James KJ, Sierra MD, Lehane M, Magdalena AB, Furey A (2003) Detection of five new hydroxyl analogues of azaspiracids in shellfish using multiple tandem mass spectrometry. Toxicon 41:277–283
Rehmann N, Hess P, Quilliam MA (2008) Discovery of new analogs of the marine biotoxin azaspiracid in blue mussels (Mytilus edulis) by ultra-performance liquid chromatography/tandem mass spectrometry. Rapid Commun Mass Spectrom 22:549–558
Amzil Z, Sibat M, Royer F, Savar V (2008) First report on azaspiracid and yessotoxin groups detection in French shellfish. Toxicon 52:39–48
Furey A, O’Doherty S, O’Callaghan K, Lehane M, James KJ (2010) Azaspiracid poisoning (AZP) toxins in shellfish: toxicological and health considerations. Toxicon 56:173–190
Ueoka R, Ito A, Izumikawa M, Maeda S, Takagi M, Shin-Ya K, Yoshida M, van Soest RWM, Matsunaga S (2009) Isolation of azaspiracid-2 from a marine sponge Echinoclathria sp as a potent cytotoxin. Toxicon 53:680–684
Magdalena AB, Lehane M, Krys S, Fernandez ML, Furey A, James KJ (2003) The first identification of azaspiracids in shellfish from France and Spain. Toxicon 42:105–108
Alvarez G, Uribe E, Avalos P, Marino C, Blanco J (2010) First identification of azaspiracid and spirolides in Mesodesma donacium and Mulinia edulis from Northern Chile. Toxicon 55:638–641
Taleb H, Vale P, Amanhir R, Benhadouch A, Sagou R, Chafik A (2006) First detection of azaspiracids in mussels in north west Africa. J Shellfish Res 25:1067–1070
Twiner MJ, Rehmann N, Hess P, Doucette GJ (2008) Azaspiracid shellfish poisoning: a review on the chemistry, ecology, and toxicology with an emphasis on human health impacts. Marine Drugs 6:39–72
James KJ, Moroney C, Roden C, Satake M, Yasumoto T, Lehane M, Furey A (2003) Ubiquitous ‘benign’ alga emerges as the cause of shellfish contamination responsible for the human toxic syndrome, azaspiracid poisoning. Toxicon 41:145–151
Hess P, Nguyen L, Aasen J, Keogh M, Kilcoyne J, McCarron P, Aune T (2005) Tissue distribution, effects of cooking and parameters affecting the extraction of azaspiracids from mussels, Mytilus edulis, prior to analysis by liquid chromatography coupled to mass spectrometry. Toxicon 46:62–71
Miles CO, Wilkins AL, Samdal IA, Sandvik M, Petersen D, Quilliam MA, Naustvoll LJ, Rundberget T, Torgersen T, Hovgaard P, Jensen DJ, Cooney JM (2004) A novel pectenotoxin, PTX-12, in Dinophysis spp. and shellfish from Norway. Chem Res Toxicol 17:1423–1433
Gribble KE, Anderson DM (2006) Molecular phylogeny of the heterotrophic dinoflagellates, Protoperidinium, Diplopsalis and Preperidinium (Dinophyceae), inferred from large subunit rDNA. J Phycol 42:1081–1095
Miles CO, Wilkins AL, Munday R, Dines MH, Hawkes AD, Briggs LR, Sandvik M, Jensen DJ, Cooney JM, Holland PT, Quilliam MA, MacKenzie AL, Beuzenberg V, Towers NR (2004) Isolation of pectenotoxin-2 from Dinophysis acuta and its conversion to pectenotoxin-2 seco acid, and preliminary assessment of their acute toxicities. Toxicon 43:1–9
Tillmann U, Elbrachter M, Krock B, John U, Cembella A (2009) Azadinium spinosum gen. et sp nov (Dinophyceae) identified as a primary producer of azaspiracid toxins. Eur J Phycol 44:63–79
Krock B, Tillmann U, John U, Cembella A (2008) LC-MS-MS aboard ship: tandem mass spectrometry in the search for phycotoxins and novel toxigenic plankton from the North Sea. Anal Bioanal Chem 392:797–803
Krock B, Tillmann U, John U, Cembella AD (2009) Characterization of azaspiracids in plankton size-fractions and isolation of an azaspiracid-producing dinoflagellate from the North Sea. Harmful Algae 8:254–263
Tillmann U, Elbrachter M, John U, Krock B, Cembella A (2010) Azadinium obesum (Dinophyceae), a new nontoxic species in the genus that can produce azaspiracid toxins. Phycologia 49:169–182
Tillmann U, Elbrachter M, John U, Krock B (2011) A new non-toxic species in the dinoflagellate genus Azadinium: A. poporum sp. nov. Eur J Phycol 46:74–87
Hernandez-Becerril DU, Escobae-Morales S, Morreno-Gutiérez, SP, Baron-Campis SA (2010) Two new records of potentially toxic phytoplankton species from the Mexican Pacific. Abstract book of the 14th International conference on harmful algae, Hersonissos, p 137
Akselman R, Negri MR (2010) Azadinium spinosum Elbrätchter et Tillmann (Dinophyceae) is present and also caused blooms at the south western Atlantic. Abstract book of the 14th International conference on harmful algae, Hersonissos, p 132
Salas R, Tillmann U, John U, Kilcoyne J, Burson A, Cantwell C, Hess P, Jauffrais T, Silke J (2011) The role of Azadinium spinosum (Dinophyceae) in the production of azaspiracid shellfish poisoning in mussels. Harmful Algae 10:774–783
Quilliam MA (2003) In: Hallegraef GM, Anderson DM, Cembella AD (eds) Manual on harmful marine microalgae. UNESCO, Saint-Berthevin
McNabb P, Selwood AI, Holland PT (2005) Multiresidue method for determination of algal toxins in shellfish: single-laboratory validation and interlaboratory study. J AOAC Int 88:761–772
King R, Bonfiglio R, Fernandez-Metzler C, Miller-Stein C, Olah T (2000) Mechanistic investigation of ionization suppression in electrospray ionization. J Am Soc Mass Spectrom 11:942–950
Fux E, Rode D, Bire R, Hess P (2008) Approaches to the evaluation of matrix effects in the liquid chromatography-mass spectrometry (LC-MS) analysis of three regulated lipophilic toxin groups in mussel matrix (Mytilus edulis). Food Addit Contam Part A 25:1024–1032
Kilcoyne J, Fux E (2010) Strategies for the elimination of matrix effects in the liquid chromatography tandem mass spectrometry analysis of the lipophilic toxins okadaic acid and azaspiracid-1 in molluscan shellfish. J Chromatogr A 1217:7123–7130
McCarron P, Giddings SD, Quilliam MA (2011) A mussel tissue certified reference material for multiple phycotoxins. Part 2: liquid chromatography-mass spectrometry, sample extraction and quantitation procedures. Anal Bioanal Chem 400:835–846
Rehmann N (2008) Preparative isolation and purification of azaspiracids and related toxins from blue mussels and characterisation of new toxin analogs. Ph.D. thesis, University College Dublin, Dublin
Keller MD, Selvin RC, Claus W, Guillard RRL (1987) Media for the culture of oceanic ultraphytoplankton. J Phycol 23:633–638
Sigma-Aldrich (2007) Technical Bulletin AL-180: diazald and diazomethane generators, 6 pp. Available from: http://www.sigmaaldrich.com/etc/medialib/docs/Aldrich/Bulletin/al_techbull_al180.Par.0001.File.tmp/al_techbull_al180.pdf. Accessed 25 July 2011
McCarron P, Giddings SD, Miles CO, Quilliam MA (2011) Derivatization of azaspiracid biotoxins for analysis by liquid chromatography with fluorescence detection. J Chromatogr A 1218:8089–8096
Quilliam MA, Hardstaff WR, Ishida N, MacLachlan JL, Reeves AR, Ross NW, Windust AJ (1996) In: Yasumoto T, Oshima Y, Fukuyo Y (eds) Harmful and Toxic Algal Blooms. UNESCO and Tohoku University, Sendai
Brondz I, Ekeberg D, Hoiland K, Bell DS, Annino AR (2007) The real nature of the indole alkaloids in Cortinarius infractus: evaluation of artifact formation through solvent extraction method development. J Chromatogr A 1148:1–7
McCarron P, Kilcoyne J, Miles CO, Hess P (2009) Formation of azaspiracids-3, -4, -6, and -9 via decarboxylation of carboxyazaspiracid metabolites from shellfish. J Agric Food Chem 57:160–169
Pfiester LA, Anderson DM (1987) Dinoflagellate reproduction. In: Taylor FJR (ed) The biology of dinoflagellates. Botanical monograph vol 21. Blackwell, Oxford
Lorenzen CJ (1967) Determination of chlorophyll and pheo-pigments—spectrographic equations. Limnol Oceanogr 12:343–346
Fux E (2008) Development and evaluation of passive sampling and LC-MS based techniques for the detection and monitoring of lipophilic marine toxins in mesocosm and field studies. Ph.D. thesis, Dublin Institute of Technology
Acknowledgements
This study was carried out under the Sea Change strategy with the support of the Marine Institute and the Marine Research Sub-Programme of the National Development Plan 2007–2013, co-financed by the European Regional Development Fund (ASTOX2). Further funding was obtained through Ifremer from the French Ministry of Education, Research and Technology through Programme 187 of the National Finance Law. The authors would like to thank John Lee and Dr. Thomas Glauner of Agilent Technologies for their collaboration on Q-TOF Technology. The authors would also like to thank all the members of the laboratory EMP/PHYC at the Atlantic Centre of Ifremer for their help and technical advice during this study.
Author information
Authors and Affiliations
Corresponding authors
Electronic supplementary material
Below is the link to the electronic supplementary material.
ESM 1
(PDF 306 kb)
Rights and permissions
About this article
Cite this article
Jauffrais, T., Herrenknecht, C., Séchet, V. et al. Quantitative analysis of azaspiracids in Azadinium spinosum cultures. Anal Bioanal Chem 403, 833–846 (2012). https://doi.org/10.1007/s00216-012-5849-2
Received:
Revised:
Accepted:
Published:
Issue Date:
DOI: https://doi.org/10.1007/s00216-012-5849-2