
Abstract
The aim of the following paper was to present the geomatic process of transforming low-level aerial imagery obtained with unmanned aerial vehicles (UAV) into a digital terrain model (DTM) and implementing the model into a virtual reality system (VR). The object of the study was a natural aggretage heap of an irregular shape and denivelations up to 11 m. Based on the obtained photos, three point clouds (varying in the level of detail) were generated for the 20,000-m2-area. For further analyses, the researchers selected the point cloud with the best ratio of accuracy to output file size. This choice was made based on seven control points of the heap surveyed in the field and the corresponding points in the generated 3D model. The obtained several-centimetre differences between the control points in the field and the ones from the model might testify to the usefulness of the described algorithm for creating large-scale DTMs for engineering purposes. Finally, the chosen model was implemented into the VR system, which enables the most lifelike exploration of 3D terrain plasticity in real time, thanks to the first person view mode (FPV). In this mode, the user observes an object with the aid of a Head- mounted display (HMD), experiencing the geovisualisation from the inside, and virtually analysing the terrain as a direct animator of the observations.
1 Introduction
Land relief is a key feature determining human activities in the field of space management. Its accurate representation, analysis, and visualisation in the digital environment makes it possible to identify the factors which may influence landscape and urban planning more precisely. Hence the importance of obtaining precise DTMs, which form a fundamental data-set in many applications, especially in geographic information systems (GIS). Unfortunately, the quality of these DTMs is rarely communicated to GIS users (Wood and Fisher 1993; Kraus et al. 2006). This may result in inaccurate geovisualisations of the analysed area, which do not correctly reflect spatial relations. A possible solution to this problem is to create DTMs on the basis of UAV-obtained data. This type of data might serve to create a DTM with centimetre-level accuracy, which may then be implemented into geovisualisations in the virtual reality (VR) system.
Unmanned aerial vehicles (UAVs) have played a significant role in the military for some time (Watts et al. 2012). They have been used, for example, in military activities such as intelligence, environmental surveillance, sea surveillance, and mine removal activities (Eisenbeiss 2004). It was this connection with the military sector that led to the significant development of unmanned aerial platforms and their wide use in the years 1960–1980 (Ahmad 2011). Nowadays, unmanned aerial vehicles are not only used for military purposes—their use in the civil sector is also expanding. In 2007, the European Commission published a report on the developing UAV technology in which the civil and commercial sectors were divided into six application segments: government; firefighting; energy; agriculture, forestry, and fisheries; Earth observation and remote sensing; communications and broadcasting (European Commission 2007). On the basis of the report, it might be concluded that unmanned aerial vehicles are a versatile tool for obtaining data on various aspects of everyday life. As explained by Mill et al. (2011, 2014), UAV-obtained imagery is used, among other things, in topographic surveying, land management, organization of road infrastructure, works connected with monitoring construction processes, technical inspection of engineering infrastructure, soil mass measurements, precise agriculture, and work connected with natural disasters. A detailed description of the development of UAV technology and its possible applications was given by Colomina and Molina (2014). In addition, Liu et al. (2014) focused on the usefulness of unmanned platforms in the field of land engineering, while Nex and Remondino (2014), on UAV-aided 3D mapping.
The possibility of using the UAV technology to monitor open pit mines, especially with the purpose of tracking the occurring changes and making cubature calculations on the basis of the point cloud, has been described, among others, by Esposito et al. (2017) based on the example of Sa Pigada Bianda in Sardinia. Due to the technological development of the miniaturisation process and the decreasing production costs of the components used in UAV construction, the vehicles are becoming more and more popular as surveying platforms in geophysical research. Their versatile use in geophysics, geodesy, and spatial planning has been described by Lin (2008), Remondino et al. (2012), Siebert and Teizer (2014), Li et al. (2016), Kršák et al. (2016) and Torres et al. (2016). The research material obtained with UAVs, in the form of images or point clouds (Axelsson 2000), can provide the basis for many analyses, such as analyses of visibility.
Horbiński and Medyńska-Gulij (2017) pointed out three main ways of visualising the state of natural aggregate pits and the changes affecting them: static two-dimensional (where the product is a traditional paper map), surface three-dimensional (a surface three-dimensional model of a single open pit), and interactive—created in an Internet browser. A new medium that may aid the process of visual terrain analysis in real time without the need to perform GIS analyses is the VR system. In the proposed reality–virtuality diagram, Milgram and Kishino (1994) defined several possible states such as: the real world, augmented reality, and virtual reality. The VR system might be seen as the opposite of the real world. This is connected with the fact that VR systems combine fast computer graphics systems with head-mounted display (HMD) and interface devices that provide the effect of immersion in an interactive virtual three-dimensional environment in which the objects have spatial presence (Bryson 1995). VR systems allow real-time user feedback on landscape and urban planning. They enable users to manipulate the time dimension and discover spatial variation and patterns; they enable planners to experiment with objects irreversible in the real world; and they allow investigation of the interactions between multiple objectives (Orland et al. 2001). Sherman and Judkins (1992) have identified five characteristics essential to a VR system: Illustrative, Immersive, Interactive, Intensive, and Intuitive. Movement in VR in most cases is similar to movement in the real world (first-person view, FPV) and should result in a minimum of disorientation because humans on a daily basis navigate through three-dimensional space. That is why the VR system might aid the process of visual analysis, transporting the user directly into the analysed area and enabling its observation in the most natural way for a human, i.e., from the pedestrian perspective.
The main aim and contribution of the following paper was to present the geomatic process of transforming low-level aerial imagery obtained with unmanned aerial vehicles (UAV) into a digital terrain model (DTM) and implementing the model into a virtual reality system (VR). We verified the functionality of this process on the basis of one anthropogenically transformed landform (natural aggregate heap) generated from low-level aerial imagery. A subsequent aim was to verify the accuracy of the produced 3D model, i.e., to check whether the actual linear and angular dimensions between the control points were precisely represented in the 3D model. This was accomplished by comparing the coordinates of the control points in the 3D model with the results of those points’ GNSS RTK measurements. The study was conducted using the geomatic method, combining a range of digital activities and calculations (carried out both in the office and in the field) which so far had been used separately in traditional geodesy, cartography, and photogrammetry.
2 Study Area
The study was conducted in the western part of Poland, in the Greater Poland Voivodeship: Poznań County. The selected area of study features a great number of open gravel mining pits which significantly contribute to changes in land relief. The object chosen for the study was a 6500-m2 heap of natural aggregate, located in the natural aggregate mine “Gołuń”. The spatial extent of the aggregate mine is shown in Fig. 1, and the coordinates of its main border points (I, II, III, IV) are shown in Table 1. The selected heap had an irregular shape, with numerous hollows and protuberances. The difference in elevation between the highest and the lowest point of the heap was over 11 m.

Location of the studied area (background layer orthophotomap from national geoportal www.geoportal.gov.pl)
3 Methods and Materials
3.1 Equipment and Software
The equipment used to obtain low-level aerial imagery included a multirotor unmanned aerial platform Tarot X6, equipped with a Panasonic DMC-GH4 camera with a 16.1 Mpx matrix and a DJI Zenmuse X5 lens (Fig. 2). The obtained images were processed using the Agisoft Lens and PhotoScan software, and the geovisualisation in the VR system was created with the aid of the Unity 3D software, which is a 3D game engine.

Unmanned aerial platform Tarot X6
3.2 Research Procedure
Creating a geovisualisation in the VR system entails a sequence of activities. The complexity of the conducted study required us to devise a specially designed geomatic workflow of the research process, illustrating the various research stages (Fig. 3). The individual components of the workflow will be described in more detail in later parts of the paper.

The workflow for the geomatic process of transforming low-level aerial imagery obtained with a UAV into a DTM uploaded into the VR system
3.2.1 Planning the UAV Flight
At the office stage of planning the flight, an important role is played by cartometric map bases, which are helpful in the situational orientation of the studied area (Kędzierski et al. 2014). Moreover, in order to define the area of the flight and the ground control station, it is a good idea to use satellite photographs of the studied area (Ostrowski and Hanus 2016). During the office stage of flight planning, we designed the path of the UAV flight over the studied natural aggregate pit (Fig. 4). Based on the analysis of the area and the studied object, we decided to take oblique photographs of the pit from its every side (west, east, north, south) as well as vertical photographs from directly above it. The object was divided into five observation sides: northern, southern, eastern, western, and vertical. Eight oblique observation posts were defined for the UAV’s flight around the object (two for each side) as well as two vertical observation posts. A flight conducted in such a way would yield a series of overlapping photographs of the studied object from every aspect.

UAV flight path
In the conducted study, we used a cartometric map base as well as orthophotomaps downloaded from the national geoportal, which served to identify potential spots for establishing ground control. While planning the photogrammetric flight, it was decided that in order to obtain a model representing the relief with a sub-centimetre accuracy, photogrammetric control would be established in the area—a necessary step for conducting the georeferencing process, and eventually generating a numerical terrain model (Uysal et al. 2015). In addition, an intermediate aim of this paper was to conduct an independent check of the situational and height accuracy of the photogrammetric model obtained in the georeference process. That was why additional check points were established in the area of the study, constituting an independent control network (Gonçalves and Henriques 2015). It was assumed that the check of the obtained photogrammetric model would consist in comparing the coordinates of the afore-mentioned control points measured with the Global Navigation Satellite System Real Time Kinematic (GNSS RTK) technique with the coordinates of the same points obtained from the numerical terrain model.
3.2.2 Establishing Ground Control
During the surveying activities performed with the help of UAVs, what is important is not only the proper design of the flight itself, but also the network of points constituting ground control (Nex and Remondino 2014). In a situation when the unmanned platform used in the flight is not equipped with an inertial measurement unit (IMU), or when the received satellite signal is interrupted, establishing ground control is a necessity, even at the office stage of planning the flight (Anai et al. 2012; Barazzetti et al. 2010; Eugster and Nebiker 2008; Wang et al. 2008). The process is especially necessary when the aim is to generate a cartometric terrain model. Ground control should be established using geodetic techniques such as satellite observation or tacheometry. It is believed, however, that nowadays the best and most effective measurement method is to conduct satellite observations in real time, which also contributes to reducing image distortions (de Kock and Gallacher 2016).
In the study in hand, ground control points (GCPs) were established using the GNSS RTK technique, with the aid of the Trimble R4 Model 3 receiver. Taking into consideration the surveying technique used and the planar coordinate system EPSG:2177 (the one applicable in Poland, used in geodetic works) (Bosy 2014), it was decided that all the measurements made would be defined in this system for practical reasons. Due to the fact that UAV-obtained images are often oblique, it is recommended that a great number of control points be established in the surveyed area (Ruzgienė et al. 2015). Taking into account the size of the studied object and the planned altitude of the flight, four targeted GCPs were established (Fig. 5). They were located on every side of the observed aggregate heap. The ground control points were established in the field with the use of wooden poles, additionally marked with fluorescent orange paint so they could be easily identified in the photographs (Siebert and Teizer 2014). Additionally, in order to perform a situational and height accuracy check of the obtained photogrammetric model, seven independent check points (ICPs) were established in the studied area and labelled with numbers from 1 to 7 (Fig. 5). The decision to establish seven independent check points (ICP) was motivated by several factors:

The location of ground control points (red dots) and independent check points (yellow dots) in the studied area
-
(a)
Viewing the heap as a three-dimensional object, one might notice that (1) in terms of its vertical structure it consists of a foot and a summit. Hence, there should be points established in both those parts; (2) from the north, the object is shaded; from the south—lit by sunlight. Hence, establishing a single control point on each of those sides could be insufficient. Consequently, two points were established on each side (the shaded and the sunlit one). Two additional control points were established on the summit.
-
(b)
One of the objectives of the study was to check whether for the applied research methodology, increasing the distance from which the photograph was taken would affect the accuracy of the obtained 3D model. To this end, one additional point (a third one) was established on the southern side, as photographs of this side were taken from a greater distance than those of the northern side (Fig. 6).
Fig. 6 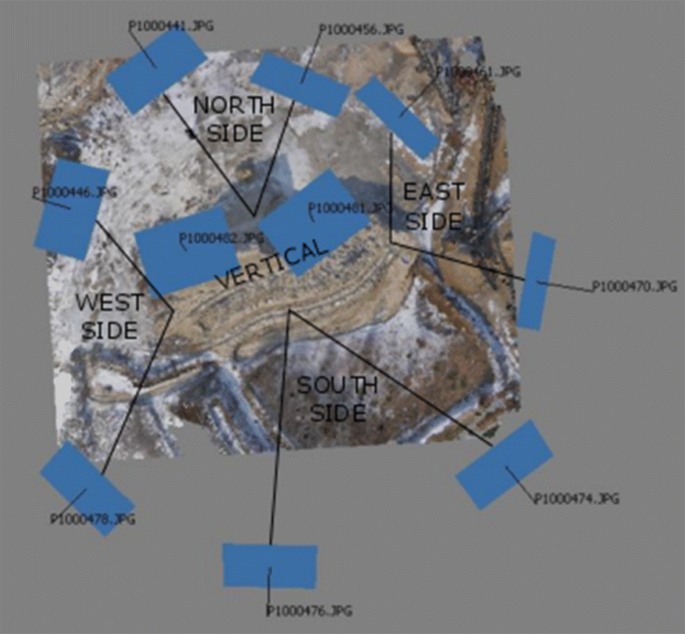
Location of 10 selected images for further analysis

ICPs were not used in the process of georeferencing the images (Toutin and Chénier 2004).
3.2.3 Conducting the Flight
The platform used in the study was equipped with an inertial measurement unit (IMU) and a GPS receiver; however, the coordinates were only used to stabilize the flight in the GPS mode and on the basis of available research (Gonçalves and Henriques 2015). It was assumed that the currently attainable accuracy levels are not sufficient for photogrammetric purposes. Hence, the flight was carried out in the manual mode, thus acquiring photographs on the basis of image obtained in real time. Taking into account the size of the studied object and the legal restrictions in Poland related to UAV flights, we decided that a sufficient elevation of the flight would be 100 m AGL (above ground level) and that the photographs for further analysis would be taken from all sides of the object. In accordance with the currently binding regulations in Poland (Regulation of the Minister of Infrastructure and Construction, Dz. U. 2016, Item 1993), carrying out UAV flights with a platform not exceeding 25 kg of take-off weight is allowed up to an altitude of 100 m above ground level (AGL) and at a distance of more than 6 km away from the nearest airport.
The weather conditions during the flight were favourable: wind speed approximately 3 m/s and a clear sky. During the 30-min flight, a total of 103 images of the object were obtained. The given time of the flight included 10 min taken to prepare the platform for flight and run a checklist ensuring flight safety.
3.2.4 Manual Selection of the Images for Further Analysis
Before proceeding to further stages of the study, the researchers performed a manual harmonisation of the obtained set of images, reducing their number while making sure to retain the ones which presented the studied object in the best possible way. As a result of this stage, ten photographs were chosen for further analysis—two images from every direction and two vertical images presenting the natural aggregate heap (Fig. 6).
3.2.5 Georeferencing the Selected Images
The next stage consisted in georeferencing the chosen images into a metric coordinate system. The first step towards georeferencing them into a coordinate system, identical to the one in which the ground control points had been defined, was to recreate their relative internal orientation. This process was performed on the basis of the EXIF file containing metadata about the photographs which made it possible to estimate the location of the images in space. Owing to the necessity of generating a cartometric DTM, the next stage was to recreate the relative orientation of the points, but already on the basis of the established GCPs. The task was completed using Agisoft PhotoScan Professional software. This programme is especially useful for processing UAV-obtained images, as it enables its user to generate a DTM or an orthophotomap in any chosen coordinate system.
It must be added, however, that before the calculation process was performed in the above mentioned software, a twin programme, Agisoft Lens, had been used to calibrate the camera used during the UAV flight. Brown’s distortion model implemented in this software made it possible to determine and factor into further calculations the radial and tangential distortion of the images.
After performing the georeferencing process on the basis of the established ground control, the RMSE (root-mean-square error) was calculated—a value specifying the deviation of the original tie-up points from the corresponding points calculated on the basis of the generated model. For calculating the RMSE, the following formula was used (Smaczynski and Medynska-Gulij 2017):
where X/Y/Zi,in—the actual value of a particular coordinate, X/Y/Zi,est—the estimated value of this coordinate.
On the basis of the obtained results, it was concluded that the ground control point whose total error of georeferencing had the lowest value was point D, and the point burdened with the greatest error—point B (Table 2). The further part of the study involved a check on the basis of independent check points.
3.2.6 Generating Point Clouds
The next step towards the creation of the terrain model was to use the obtained images as the basis for generating a set of three-dimensional point clouds of the studied object. At this stage, three point clouds representing the landform were created, differing in their construction parameters. The first point cloud was created on the basis of photographs in their original size, i.e., 4608 × 2592 pixels (Model 1). The second cloud (Model 2) was generated after reducing the size of the images 4 times (which meant that the length of each side of the photo was reduced twice). The last, smallest point cloud (Model 3), was created from images reduced 16 times in size, i.e., 4 times on every side.
3.2.7 Choosing the Optimum Point Cloud and Calculating the 3D Model
Table 3 presents the characteristics of the three point clouds and the photogrammetric 3D models generated from them. As expected, the time needed to calculate Model I with the greatest precision in representing the terrain was the longest, amounting to nearly four hours. A disadvantage of this model, directly connected with the size of the created point cloud (over 23.5 mln points), was the very large size of the output file (363 MB), which could render it impossible for implementation into the VR system. Bearing in mind also the fact that Model I yielded the greatest value of the RMSE error (2.05 cm), the researchers decided to exclude it from further stages of the study. In Model II, the point cloud was much smaller (over 1.5 mln points), which reduced the file size to only 6.83 MB. The calculation time was also greatly reduced, to below 4 min, yet the model provided a very accurate representation of the terrain (RMSE 1.26 cm). Model III was constructed from the lowest number of points (approximately 0.4 mln), which, as in the previous cases, influenced file size (1.21 MB). However, it yielded worse results in terms of the RMSE error (1.58 cm). Taking into consideration the much worse parameters of Model III and the insignificant difference in the size of the output files, the model chosen by the authors as more appropriate for further geovisualisation in the VR system was Model II.
3.2.8 Exporting the 3D Model into the Unity 3D Environment
Based on the results obtained in the previous stage, the model chosen to undergo further analyses was Model II, calculated from a cloud of 1,537,422 points (90 points/m2). On the basis of the cloud, a 3D model of the studied area was generated, consisting of 50,806 vertices, translating into 101,128 triangles making up the area of the model. Next, a texture was applied to the generated model, to reflect the real appearance of the natural aggregate heap (Fig. 7). The last step was to export the resultant model into the *.OBJ format, which enabled its subsequent implementation into Unity 3D.

The generated terrain model with the applied texture
3.2.9 Importing the Model into the VR Environment in Unity 3D
Activities at this stage were carried out in the programming environment of Unity 3D, which is an engine for the creation of computer games. The Unity project was first upgraded with the Google VR package, which boosts the functionality of the Unity engine, enabling it to display content in the VR system. The Google VR package provides additional features such as: user head tracking, side-by-side stereo rendering, detection of user interaction with the system, distortion correction for a VR viewer’s lenses. After the upgrade, the 3D model of the aggregate heap was imported and set to a proper scale. Because by default the model was displayed without any texture, texture was added in order to give the user an impression of greater realism while visually analysing the terrain. Finally, the virtual world was made complete by adding the sky as the background. The authors used Google Cardboard, which is the cheapest and easiest VR platform to obtain. This smartphone-based headset uses the user’s smartphone as a device to display the VR content.
3.2.10 Implementing the Virtual Reality First-Person View Mode (VR FPV)
A key element of the geovisualisation in the VR system is the FPV mode which enables the observation of objects from the pedestrian perspective. This works by displaying on the HMD two slightly different angles of the scene for each eye, which generates an illusion of depth (Fig. 8). This, along with other methods of simulating depth, such as parallax (objects farther from the observer seen to move more slowly) and shading, creates an almost lifelike experience. In this mode, the user becomes the main animator of the geovisualisation; all his/her movements are registered by sensors in the HMD and faithfully rendered in the geovisualisation. The VR system generates two stereoscopic images, one for each eye. This creates an impression that the user is immersed in the geovisualisation; in other words, the geovisualisation reaches its recipient directly. An additional advantage of the VR FPV mode is the possibility of adjusting the height of the observed picture to the actual height of the observer.

Location of the VR FPV viewer (left), virtual reality first-person view mode (right)
4 Results
The RMSE values obtained in the georeferencing process constitute only a mean squared error that occurred while georeferencing the photogrammetric model calculated on the basis of the adopted tie-up points (GCPs). Results obtained in a study of this kind should be treated in accordance with the basic principles of geodesy, such as the necessity of performing independent checks. This activity should be carried out on the basis of previously established and surveyed independent check points (ICPs) (Fig. 1), which were not directly used in the georeferencing process. In this study, the values that the authors treated as a reliable reference were the coordinates of check points 1–7, obtained via a GNSS RTK survey. Points from the field satellite survey were marked with the affix “gnss”; the ones from the photogrammetric Model II—with the affix “uav”. A correlation of both those types of coordinates resulted in obtaining the coordinate deviations ΔX, ΔY, ΔH, as well as the Euclidean distance ΔL (Table 4).
In accordance with the arrangements concerning the distribution of ICPs (Fig. 5), two of them (points 4 and 5) were located at the shaded foot of the aggregate heap, while the three points 3, 6, and 7, were located at its sunlit foot. Comparing the obtained accuracy values ΔX, ΔY, ΔH, ΔL for the seven ICPs surveyed with a GNSS receiver and the values obtained from the 3D Model II generated from UAV images, one must conclude that in the study in hand, shading did not influence the situational coordinates (X, Y) or the Euclidean distance (L) of the analysed points. There was, however, a visible height (H) deviation in the case of point 4, which was the most shaded of all points.
What might have caused such a big deviation was the location of point 4 on the northern, shaded side of the natural aggregate heap. The pixels in its proximity were mostly of very similar colour. This might have caused image noise, resulting in incorrect results. In addition, it should be noted that despite establishing ground control on ground level, check points 1 and 2 located in two mutually independent spots at the top of the aggregate heap were afflicted with very small georeferencing errors. The second experimental aim was to analyse whether a twofold increase in the photographing distance from the studied aggregate heap would affect the obtained accuracy values ΔX, ΔY, ΔH, ΔL. After studying the results, it was found that increasing the distance had not affected the obtained accuracy of the points’ location on the 3D model used to create the VR geovisualisation.
In spite of the one outlying elevation value, the results obtained in this study testify to the fact that the generated relief model has a high situational and height accuracy. Therefore, it can be used for visibility analysis in the VR system.
5 Discussion and Conclusions
The conducted study was inspired by the paper of Esposito et al. (2017), who outlined the possibilities of using UAV technology for monitoring open pit mines, especially recording the changes taking place and performing cubature calculations on the basis of the point cloud. In addition, this paper aimed to further the research done by Slater et al. (2010) concerning the possibility of using VR for a more immersive exploration of 3D geovisualisation in the VR FPV mode. Authors believe that the integration of UAV-based DTMs into the VR system may be very important in anti-collision systems, in manual navigation of the UAV and in UAV simulators. The example work showing anti-collision system is the paper by Fong and Thorpe (2001). The other application of UAV-based terrain reconstruction within the VR system are simulators. VR FPV mode interfaces can improve the operator situational awareness and provide valuable tools to help understand and analyse the vehicle surroundings and plan command sequences Nguyen et al. (2000), Postal et al. (2016) and Smolyanskiy and Gonzalez-Franco (2017).
The obtained deviations in the location of check points surveyed with GNSS RTK and the same points calculated on the basis of UAV-obtained images enable the following conclusions to be drawn: (1) selecting two overlapping UAV images for each of the observed sides of the object (west, east, north, south, top) is sufficient to create a highly accurate 3D model; (2) using UAV technology is much more effective, both in terms of accuracy and the time required to carry out the measurements, than the use of traditional geodetic techniques: tacheometry, levelling, GNSS. Besides, the use of UAV for data acquisition does not cause any disturbance to the unstable material structures such as aggregate heaps or dunes, and so it is a very good option for studying such objects; (3) with the help of the workflow proposed in the paper, it is possible to generate a relief model with a centimetre-level accuracy. Such a 3D model might be used in precise, large-scale engineering projects. Thanks to such accurate models, it is possible to create an interactive geovisualisation in the VR system, in the FPV mode, which lets the user move around in the digital 3D environment and analyse the visibility in real time. An advantage of using the VR system for geovisualisation purposes is the possibility of analysing terrain changes in time, in a way most closely resembling natural time, without the need to be physically present in the studied area.
Low-level aerial imagery obtained by monitoring open pit mining areas at specified time intervals might become the basis for designing an animated visualisation presenting changes affecting those areas with the use of visual variables (Halik and Medyńska-Gulij 2017; Medyńska-Gulij and Cybulski 2016). The workflow for geomatic data transformation and geovisualisation as proposed in the paper might have a wide application in many areas of life, raising the level of spatial awareness and serving to clarify spatial relations between the geospheres. Nevertheless, we are mindful of the fact that in the future, with the increasing accuracy of IMU and the more widespread use of RTK GPS in UAV platforms, it will be possible to modify the proposed geomatic process of transforming low-level aerial imagery in such a way as to render the establishment of GCPs in the field unnecessary. Such a solution would enable georeferencing without the need to design, establish, and survey a ground control network, thus accelerating the process of creating the geovisualisation.
References
Ahmad, A. (2011). Digital mapping using low altitude UAV. Pertanika Journal of Science and Technology, 19(S), 51–58.
Anai, T., Sasaki, T., Osaragi, K., Yamada, M., Otomo, F., & Otani, H. (2012). Automatic exterior orientation procedure for low-cost UAV photogrammetry using video image tracking technique and GPS information. ISPRS International Archives of the Photogrammetry, Remote Sensing and Spatial Information Sciences, XXXIX-B7, 469–474.
Axelsson, P. (2000). DEM generation from laser scanner data using adaptive TIN models. International Archives of Photogrammetry and Remote Sensing., XXXIII(4B), 203–210.
Barazzetti, L., Remondino, F., Scaioni, M., Brumana, R. (2010). Fully automatic UAV image-based sensor orientation. International Archives of Photogrammetry Remote Sensing and Spatial Information Sciences Vol XXXVIII Part 5 Commission V Symposium, p. 6. http://www.isprs.org/proceedings/XXXVIII/part1/12/12_02_Paper_75.pdf.
Bosy, J. (2014). Global, regional and national geodetic reference frames for geodesy and geodynamics. Pure and Applied Geophysics, 171(6), 783–808.
Bryson, S. (1995). Approaches to the successful design and implementation of VR applications. In E. Earnshaw, J. Vince, & H. Jones (Eds.), Virtual reality applications (pp. 3–15). London: Academic Press.
Colomina, I., & Molina, P. (2014). Unmanned aerial systems for photogrammetry and remote sensing: A review. ISPRS Journal of Photogrammetry and Remote Sensing, 92, 79–97.
de Kock, M.E., Gallacher, D. (2016). From drone data to decisions: Turning images into ecological answers. Conference: Innovation Arabia 9, (February)
Eisenbeiss, H. (2004). A mini unmanned aerial vehicle (UAV): System overview and image acquisition. Proceedings of the International Workshop on Processing and Visualization using High-Resolution Imagery. https://doi.org/10.1017/S0003598X00047980.
Esposito, G., Mastrorocco, G., Salvini, R., Oliveti, M., & Starita, P. (2017). Application of UAV photogrammetry for the multi-temporal estimation of surface extent and volumetric excavation in the Sa Pigada Bianca open-pit mine, Sardinia, Italy. Environmental Earth Sciences, 76(3), 103. https://doi.org/10.1007/s12665-017-6409-z.
Eugster, H., & Nebiker, S. (2008). UAV-based augmented monitoring—real-time georeferencing and integration of video imagery with virtual globes. Archives, 37, 1229–1236.
European Commission, (2007). Study analysing the current activities in the field of UAV, ENTR/2007/065
Fong, T., & Thorpe, Ch. (2001). Vehicle teleoperation interfaces. Autonomous Robots, 11(1), 9–18.
Gonçalves, J. A., & Henriques, R. (2015). UAV photogrammetry for topographic monitoring of coastal areas. ISPRS Journal of Photogrammetry and Remote Sensing, 104, 101–111.
Halik, Ł., & Medyńska-Gulij, B. (2017). The differentiation of point symbols using selected visual variables in the mobile augmented reality system. The Cartographic Journal, 54(2), 147–156. https://doi.org/10.1080/00087041.2016.1253144.
Horbiński, T., Medyńska-Gulij, B. (2017). Geovisualisation as a process of creating complementary visualisations: Enhanced/static two-dimensional, surface three-dimensional, and interactive; Geodesy & Cartography, 66(1), 45–58.
Kędzierski, M., Fryśkowska, A., & Wierzbicki, D. (2014). Opracowania fotogrametryczne z niskiego pułapu. Warszawa: Wojskowa Akademia Techniczna.
Kraus, K., Karel, W., Briese, C., & Mandlburger, G. (2006). Local accuracy measures for digital terrain models. The Photogrammetric Record, 21, 342–354. https://doi.org/10.1111/j.1477-9730.2006.00400.x.
Kršák, B., Blištan, P., Pauliková, A., Puškárová, P., Kovanic, L., Palková, J., et al. (2016). Use of low-cost UAV photogrammetry to analyse the accuracy of a digital elevation model in a case study. Measurement, 91, 276–287.
Li, M., Nan, L., Smith, N. & Wonka, P. (2016). Reconstructing building mass models from UAV images. Computers and Graphics, 54, 84–93. Available at: http://www.sciencedirect.com/science/article/pii/S0097849315001077
Lin, Z. (2008). UAV for mapping—low altitude photogrammetric survey. The International Archives of the Photogrammetry, Remote Sensing and Spatial Information Sciences, XXXVII(Part B1), 1183–1186. http://citeseerx.ist.psu.edu/viewdoc/download?doi=10.1.1.150.9698&rep=rep1&type=pdf.
Liu, P., Chen, A. Y., Yin-Nan, H., Jen-yu, H., Jihn-Sung, L., Shil-Chung, K., et al. (2014). A review of rotorcraft unmanned aerial vehicle (UAV) developments and applications in civil engineering. Smart Structures and Systems, 13(6), 1065–1094.
Medyńska-Gulij, B., Cybulski, P., (2016). Spatio-temporal dependencies between hospital beds, physicians and health expenditure using visual variables and data classification in statistical table. Geodesy and Cartography, 65(1), 67–80. http://www.degruyter.com/view/j/geocart.2016.65.issue-1/geocart-2016-0002/geocart-2016-0002.xml.
Milgram, P., & Kishino, F. (1994). Taxonomy of mixed reality visual displays. IEICE Transactions on Information and Systems, 12, 1321–1329.
Mill, T., Ellmann, A., Aavik, A., Horemuz, M., & Sillamäe, S. (2014). Determining ranges and spatial distribution of road frost heave by terrestrial laser scanning. The Baltic Journal of Road and Bridge Engineering, 9(3), 225–234. https://doi.org/10.3846/bjrbe.2014.28.
Mill, T., Ellmann, A., Uuekula, K., & Joala, V. (2011). Road surface surveying using terrestrial laser scanner and total station technologies. In D. Čygas & K. D. Froehner (Eds.), Proceedings of 8th International Conference “Environmental engineering: Selected papers” (Vol. 3, pp. 1142–1147). Technika: Vilnius.
Nex, F., & Remondino, F. (2014). UAV for 3D mapping applications: A review. Applied Geomatics, 6(1), 1–15.
Nguyen, L. A., Bualat, M., Edwards L. J., Flueckiger L., Neveu, Ch, Schwerh, K., Wagner, M. D. & Zbinden E. (2000). Virtual reality interfaces for visualization and control of remote vehicles. in IEEE International Conference on Robotics and Automation 2000, San Francisco, California.
Orland, B., Bedthimedhee, K., & Uusitalo, J. (2001). Considering virtual worlds as representations of landscape realities and as tools for landscape planning. Landscape and Urban Planning, 54, 139–148.
Ostrowski, W., & Hanus, K. (2016). Budget UAV systems for the prospection of small- and medium- scale archaeological sites. ISPRS Archives of Photogrammetry, Remote Sensing and Spatial Information Sciences, XLI(July), 971–977.
Postal, G. R., Pavan W. & Rieder, R., (2016). A virtual environment for drone pilot training using VR devices. 2016 XVIII Symposium on Virtual and Augmented Reality (SVR), Gramado, pp 183–187. https://doi.org/10.1109/svr.2016.39
Remondino, F., Barazzetti, L., Nex, F., Scaioni, M., Sarazzi, D. (2012). UAV Photogrammetry for mapping and 3D modeling—current status and future perspectives. ISPRS—International Archives of the Photogrammetry, Remote Sensing and Spatial Information Sciences, XXXVIII-1(September), 25–31. http://www.int-arch-photogramm-remote-sens-spatial-inf-sci.net/XXXVIII-1-C22/25/2011/.
Ruzgienė, B., Berteška, T., Gecyte, S., Jakubauskiene, E. & Aksamitauskas, V. C. (2015). The surface modelling based on UAV photogrammetry and qualitative estimation. Measurement, 73, 619–627. http://www.sciencedirect.com/science/article/pii/S0263224115002316
Sherman, B., & Judkins, P. (1992). Glimpses of heaven, vision of hell: Virtual reality and its implications. UK: Hodder and Stoughton.
Siebert, S., & Teizer, J. (2014). Mobile 3D mapping for surveying earthwork projects using an unmanned aerial vehicle (UAV) system. Automation in Construction, 41, 1–14. https://doi.org/10.1016/j.autcon.2014.01.004.
Slater, M., Spanlang, B., Sanchez-Vives, M. V., & Blanke, O. (2010). First person experience of body transfer in virtual reality. PLoS ONE, 5(5), e10564. https://doi.org/10.1371/journal.pone.0010564.
Smaczyński, M. & Medyńska-Gulij, B. (2017). Low aerial imagery—an assessment of georeferencing errors and the potential for use in environmental inventory. Geodesy and Cartography, 66(1), 89–104.
Smolyanskiy, N., & Gonzalez-Franco, M. (2017). Stereoscopic first person view system for drone navigation. Frontiers in Robotic and AI, 4, 11. https://doi.org/10.3389/frobt.2017.00011.
Torres, M., Pelta, D. A., Verdegay, J. L., & Torres, J. C. (2016). Coverage path planning with unmanned aerial vehicles for 3D terrain reconstruction. Expert Systems with Applications, 55, 441–451.
Toutin, T. & Chénier, R. (2004). GCP requirement for high-resolution satellite mapping. XXth ISPRS Congress, pp. 12–23. http://www.cartesia.org/geodoc/isprs2004/comm3/papers/385.pdf.
Uysal, M., Toprak, A. S., & Polat, N. (2015). DEM generation with UAV photogrammetry and accuracy analysis in Sahitler hill. Journal of the International Measurement Confederation, 73, 539–543. https://doi.org/10.1016/j.measurement.2015.06.010.
Wang, J., Garratt, M., Lambert, A., Han, S. & Sinclair, D. (2008). Integration of Gps/Ins/vision sensors to navigate unmanned aerial vehicles. The International Archives of the Photogrammetry, Remote Sensing and Spatial Information Sciences, 37, 963–970.
Watts, A. C., Ambrosia, V. G., & Hinkley, E. A. (2012). Unmanned aircraft systems in remote sensing and scientific research: Classification and considerations of use. Remote Sensing, 4, 1671–1692. https://doi.org/10.3390/rs4061671.
Wood, J., & Fisher, P. (1993). Assessing interpolation accuracy in elevation models. IEEE Computer Graphics and Applications, 13(2), 48–56.
Author information
Authors and Affiliations
Corresponding author
Rights and permissions
Open Access This article is distributed under the terms of the Creative Commons Attribution 4.0 International License (http://creativecommons.org/licenses/by/4.0/), which permits unrestricted use, distribution, and reproduction in any medium, provided you give appropriate credit to the original author(s) and the source, provide a link to the Creative Commons license, and indicate if changes were made.
About this article

Cite this article
Halik, Ł., Smaczyński, M. Geovisualisation of Relief in a Virtual Reality System on the Basis of Low-Level Aerial Imagery. Pure Appl. Geophys. 175, 3209–3221 (2018). https://doi.org/10.1007/s00024-017-1755-z
Received:
Revised:
Accepted:
Published:
Issue Date:
DOI: https://doi.org/10.1007/s00024-017-1755-z