
Abstract
Low-temperature metamorphic petrology occupies the P–T field between sedimentary and metamorphic petrology. Two important pillars of low-temperature metamorphism are coal petrology and clay mineralogy. When low temperature petrology was established bridging a hiatus between the two classical geological disciplines of sedimentary geology and metamorphic petrology, geologists faced a need for the usage of different terminology tenets. Martin Frey and Bernard Kübler were two pioneers in low-grade metamorphic petrology. They focused their research on clarifying the relationships of clay mineralogy and organic petrology to metamorphic pressure (P) and temperature (T) conditions. The ultimate aim of M. Frey and B. Kübler was to establish a correlation between clay indices and organic parameters for different geodynamic setting and therefore for various pressure–temperature (P–T) conditions occurring in low grade metamorphic terranes. For this purpose, a special attention was addressed to the correlation between the Kübler-Index (KI) and vitrinite reflectance (VR). All these efforts are dedicated to estimate the P–T conditions and thus to gain insight into the geodynamic evolution of low-grade metamorphic terranes. B. Kübler and M. Frey honored here concentrated their studies to the Helvetic Central Alps area. The very low-grade Helvetic domain is therefore of basic interest of this paper. Ensuing the extensive compilation of data from the Helvetic domain, a reinterpretation of Kübler and Frey’s research is presented in the light of last decade’s scientific progress. A comprehensive dataset available enables to discriminate many factors influencing the Kübler-Index and organic-matter reflectance alongside to time, temperature and pressure. The correlation is restricted to the KI and organic matter reflectance (mostly VR) because most of the studies used both methods. Organic matter reflectance (OMR) includes data from vitrinite reflectance and bituminite reflectance measurements. Geodynamics has important control on the KI/VR (OMR) correlation. Tectonic units having a similar geodynamic evolution are featured by the comparable KI/OMR trends, related to the particular paleo-geothermal conditions. Obviously the KI/OMR correlations provide a mean to characterise geothermal gradients and metamorphic very-low-grade pressure–temperature conditions. In terranes where high deformations rates are reported, exceeding the high anchizone conditions, strain promotes the kinetic effects of temperature and pressure on the KI versus OMR ratio.
1 Preface
In this review paper, a role of the both pioneers, Bernard Kübler and Martin Frey, in the low-temperature petrology is presented and summarised. Further on, a report on advances made in this branch of petrology since the first studies of Kübler (1964, 1967) and Frey (1969a, b) is presented, re-interpreting them in the light of the recent research progress. Their contribution in low-grade sciences employed various methods and parameters. This review is focused on the correlation of the Kübler-Index (KI) and vitrinite reflectance (VR) used in paleo-geothermometry. In the last decade, Raman spectroscopy of organic matter appears to be a potential method to estimate metamorphic conditions of very low-grade metasedimentary terranes. A few studies based on Raman spectroscopy were conducted in the organic matter-bearing metasedimentary rocks from the Central Alps where KI/VR studies were previously performed by the research teams of B. Kübler and M. Frey. Consequently, this review attempts to correlate Raman and KI/VR data for the very low-grade metamorphic terranes taking place in the Central Alps.
2 Introduction and definition of terms
2.1 Conditions between diagenesis and low-grade metamorphism: a historical introduction to low temperature petrology
The fundamental methods used in low-temperature petrology of sedimentary rocks and very low-grade metamorphic studies were earlier developed for coal petrology and clay mineralogy. Microscopic coal studies have a tradition since 1854 (see Stach et al. 1982). White and Thiessen wrote the first textbook “The Origin of Coal” in 1913. Consequently, coal petrology developed very rapidly (Stach 1935) and another textbook by Stach et al. (1971), re-printed and extended by Taylor et al. (1998), is still an important source. This also reflects a demand for coal and its importance for industrial evolution of the last two centuries.
Clay and clay mineral studies have also a history of more than 100 years, compiled by De Lapparent (1923) and later by Jasmund (1951) and Grim (1953). The two latter gave overviews to the clay fraction studies, which can be taken as onset of the modern clay mineralogy, strongly related to the development of XRD technique (Weaver 1989). Advances in clay size research led to the basic clay mineral textbook by Millot (1970).
Until 1970, studies on clay minerals and coal macerals (microscopically discernible constituents of coal, by analogue with minerals) were mainly focused on problems of identification, determination of crystal structures, maceral analysis, nomenclature problems, interpretation of X-ray diffractograms, recognition of degradation (regressive transformation), aggradation (progressive transformation) and burial evolutions, compaction, dehydration, cementation and pressure-solution processes, observation of precipitation, dilution and oxidation, hydrocarbon formation and evolution, coalification of organic matter, dolomitisation, surface diagenesis, subsurface and porosity diagenesis, and also climate and weathering transformations (e.g. Degens 1965; Bouma 1969; Carver 1971; Pettijohn et al. 1972; Folk 1974). Grim (1953) observed “diagenetic” transformations which soon were recognized to affect the evolution of clay minerals by Kübler (1964), Dunoyer De Segonzac (1970) and Millot (1970); and in the evolution of coal macerals by Teichmüller and Teichmüller (1966) and Stach et al. (1971). Such work demonstrated that during burial a continuous change in clay mineral composition and coal maceral reflectivity are mainly related to temperature increase. Coalification and specifically the illite (K-white mica precursor) aggradation progress were used to:
-
1.
determine thermal history during diagenesis and very low temperature metamorphism (burial),
-
2.
evaluate past burial depths and amounts of erosion, exhumation and differential uplift,
-
3.
constrain paleo-geothermal gradients and diagenetic to incipient metamorphic temperature field gradients,
-
4.
limit the age of thermal maximum heat flux or metamorphism,
-
5.
calibrate models of hydrocarbon generation.
Thermal-maturity modelling data based on KI and VR values are ideally suited for sedimentary basins and were also applied with very encouraging results to test geodynamic models in areas of very low-temperature and pressure conditions. Some of these applications have very important roles in the studies of ore formation, oil prospection, as well as gas and coal commercial investigation. Numerical models using VR data to estimate organic matter maturation and temperature were partly developed by hydrocarbon exploration companies (Robert 1988). In a later chapter the importance of KI/VR data for modern modelling application is critically discussed.
2.2 Theory and base of the Kübler-Index
In clay mineralogy changes in the shape of the XRD 10 Å-illite peak are diagnostic for alterations in the grade of diagenesis and incipient metamorphism. The illite-sharpness ratio, first used by Weaver (1961), is applied for determination of the stage of very low-grade metamorphism (VLGM). Today it is used as the Weaver-Index [counts per second (cps) intensity-ratio of the 10.0 and 10.5 Å-line in the XRD 10 Å-illite peak]. In diagenesis zone this method has a very high sensitivity for detecting small changes within a grade of diagenesis (Weaver and Broekstra 1984). However, in anchizone and epizone, compared to other methods (mineral facies zones, stages of maturity) a significance of the Weaver-Index changes abates, providing weak diagnostic values (Petschick 1989). Such a finding is further supported by a systematic study of Ferreiro Mählmann (1994) that included a comparison of the Weaver-Index with the Kübler-Index on a dataset of 1,289 samples. In the Helvetic Central Alps the diagenesis zone is reported to be present only in small areas and, therefore, the Weaver method will not be considered in the present review.
With the birth of illite “crystallinity” (Weaver 1961; Kübler 1967, 1968) method, that was widely promoted in a plethora of papers of Frey and Kübler and their co-workers, another independent technique aimed to the determination of gradual changes in diagenesis to incipient metamorphism was established. Having a progressively increased diagenetic/incipient metamorphic grade Weaver (1961) recognized a steady sharpening of the 10 Å illite X-ray-diffraction peak. Using that trend, Kübler characterized a diagnostic and continuous sensitive parameter to determine very low-grade of metamorphism, measuring the full width at half maximum peak intensity (FWHM). According to the Scherrer equation (Scherrer 1918), FWHM is a variable dependent of the diffraction domain size. Using the Debye–Scherrer geometry diffraction, it reflects a number of lattice basal planes of the textured sample (defining the diffraction domain; see also Lanson and Kübler 1994). The peak position, maximum intensity, sharpness ratio (shape) and asymmetry are dependent on absorption and superposition of electro-magnetic waves according to the Bragg’s law. Departing from the initial proposal by Kübler, illite “crystallinity” was used as a parameter, empirically related with the aggradation of illite. According to the diffraction theory (Scherrer 1918), the width of the peaks is related to the crystalline domain size and the crystalline defects, together with instrumental factors. Such a double influence was modelled and discriminated by Árkai and Toth (1983).
Illite “crystallinity” (IC) measurement (currently Kübler-Index, KI as proposed by Guggenheim et al. 2002) is a popular method to determine the grade of VLGM as shown by some papers of the past special SMPM issue (e.g. by Abad et al. 2002; Árkai et al. 2002a; Belmar et al. 2002; Bozkaya et al. 2002; Mullis et al. 2002; Wiederer et al. 2002) and in most contributions presented in this issue.
The introduction of KI (Fig. 1) triggered a novel research in low-temperature metamorphic petrology. Furthermore, it served as a basis for the IGCP project 294 “Low Temperature Metamorphism” (1987–1993). The 10 Å-illite X-ray peaks depicted in Fig. 1 do not obviously reflect mixed-layer content, showing a decrease of the FWHM with increasing metamorphism. The trend in Fig. 1 presents an ideal case study. A significant trend as shown and determined in the representative smectite-free samples is not very frequent.

XRD-plots of the 10 Å-peak of illite. With increasing metamorphism the sharpness, expressed as full width at half maximum intensity or Kübler-Index (KI) decreases from low-grade diagenesis to the epizone (mostly equivalent to sub-greenschist facies). Plots were chosen with peaks not affected by a discrete smectite phase
The air-dry 10-Å X-ray-diffraction peak is not solely controlled by the basis reflex of white-mica precursor illite. Moreover, the diffraction patterns of smectite and mixed-layer illite-smecite can interfere with that of illite influencing the shape of the peak of concern (Millot 1970; Kübler 1990; Jaboyedoff and Thélin 2002). The low-grade diagenesis to low-anchizone studies showed that 5 % of smectite interlayer mixing is usually not detected by conventional XRD measurements (Brindley and Brown 1980). In the special issue about “diagenesis and low-grade metamorphism” (Schmidt and Ferreiro Mählmann 2002) the contributions of Brime and Eberl (2002); Brime et al. (2002); Jaboyedoff and Thélin (2002) and Warr and Peacor (2002) demonstrated, as further shown by Árkai and Toth (1983) or Merriman et al. (1990), that the measurement of the IC (KI) has limited potential when it comes to the analyses of X-ray diffractograms, especially regarding the clay-mineral defect phenomena such as inter-stratification, mixed-layering content and so forth (Kübler and Jaboyedoff 2000).
More information related to determination of crystal-growth mechanisms and smectite content in illitic mixed-layer minerals is conveniently acquired from the size of scattering domains (Lanson and Kübler 1994). Nevertheless, it was evident that the different authors of the SMPM special issue (Schmidt and Ferreiro Mählmann 2002) do have a controversial opinion to discriminate the KI/scattering domain-size results using different and more sophisticated computational or analytic methods (Brime and Eberl 2002; Brime et al. 2002; Jaboyedoff and Thélin 2002; Warr and Peacor 2002). It is difficult to evaluate the methods in respect of the authigenic smectite content in the anchizone and epizone (Velde and Vasseur 1992), assuming that smectite in the anchizone disappears (Merriman 1991) and is mostly a retrogression product (Árkai et al. 2012). In areas where a steady state heat flow is found and metamorphism lasted over a time span of more than 10 Ma, smectite in the anchizone is only present as mixed-layer component of less than 1–5 mol % in illite (Ferreiro Mählmann 2001). Recent studies show that smectite in the anchizone is formed by retrogression or late metamorphic processes (e.g. hydrothermal) as reported by Árkai et al. (2012 and references therein). A universally applicable postulate is, however, not possible to provide.
It was not until the 1990s that the physical meaning of the KI was confirmed and qualified by direct observations of illite crystals in high resolution transmission electron microscopy (HRTEM) images (Fig. 2). The pioneering paper by Merriman et al. (1990) established the first empirical correlation of the anchizone limits with crystallite size. During this decade, various studies used more samples to complete the knowledge (Fig. 2) of the relation between KI and crystallite domain size (e.g. Nieto and Sanchez-Navas 1994; Merriman et al. 1995; Árkai et al. 1996; Jiang et al. 1997; Giorgetti et al. 2000; Bauluz et al. 2000; Abad et al. 2001; Jaboyedoff et al. 2001), including the determination of crystallite domain size and the defect-free area size of the international CIS standards (Warr and Nieto 1998). Although definition of an illite crystallite domain is difficult, a general agreement about the relation was found and summarized by Merriman and Peacor (1999), who presented various curves, compiled from different authors (see Fig. 2), which define a relation well-adjusted to values theoretically predicted by the Scherrer equation. Measured sizes are far from homogeneous at the level of sample, with the variance clearly increasing toward higher grades if referring to neo-formed illite crystallites. At lower grades the variance may be also very high due to common coarser clastic mica (Frey 1987a; Ferreiro Mählmann and Giger 2012).

Plot from Merriman and Peacor (1999) showing the relationship between Kübler index and HRTEM measured illite-muscovite crystallite thickness along c*, with representative lattice-fringe images from epizone (sample 16 of Abad et al. 2003b, KI 0.23), anchizone (sample Pw-81 of Abad 2002, KI 0.32) and diagenetic zone (sample ES-77 of Abad et al. 2003c, KI 0.77; note white fringes, which represent the smectite layers); KI Δ°2θ
The scattering of the sizes determined by HRTEM is greater for the epizone in relation to the anchizone (Fig. 2), with the most homogeneous values of sizes at the level of sample found in the diagenetic zone. The average or modal sizes only represent a general tendency of variation. If we take into account the internal differences of sizes at the level of sample, the minor differences between authors represented in Fig. 2 are not significant. Later it will be shown that additional factors affect the KI.
During the last decade, HRTEM and AEM analysis have documented the textural evolution of the rocks at diagenetic and very low-grade metamorphic grades (Fig. 2), separating the contribution of the detrital phases and described the chemical compositional evolution of the various minerals. The evolution from high-grade diagenesis to low epizone, is characterized by a lack of significant qualitative changes in the texture and mineral composition of phyllosilicates. This leads to an increase in domain size and diminution in crystalline defects as the only clear changes in the illite-chlorite system, which justifies the extended use of the KI (Abad et al. 2006).
2.3 The pioneer work of Bernard Kübler and Martin Frey correlating the Kübler-Index with vitrinite reflectance in diagenesis and very low-grade metamorphism
Frey and Niggli (1971), Kübler et al. (1979a, b) and Frey et al. (1980) initiated a pioneer work to systematically correlate and compare KI and VR aiming to elucidate paleo-geothermal histories and reaction progress of KI versus VR. In regard to this, the papers of Wolf (1975) and Kisch (1980a, b) are important to be mentioned because both observed different kinetics for the reaction progress of KI and VR evolutions. A zoning of metamorphic grade established with boundary values of both methods is currently the best option to determine metamorphic conditions between 100 and 350 °C in different geodynamic settings, from contact metamorphism and extensional diastathermal basins (e.g. Warr et al. 1991; Belmar et al. 2002; Bozkaya and Yalçın 2004) to the subduction-related convergent margins (e.g. Dalla Torre et al. 1996; Potel et al. 2006).
Other methods such as fluid inclusions or isotopic studies can provide higher precisions when it comes to the temperature determination. However, the fissure vein quartz or other phase under consideration is frequently quite difficult to relate with the peak metamorphism (Frey et al. 1980). This finding is also corroborated in different studies of the Frey’s VLGM-group giving “satisfactory” (Rahn et al. 1995; Kahr et al. 1996), but not precise correlations with the fluid inclusion data. It was further shown that the isotope signature results are dependent on the proportions of fluid fluxes or from the sheet-silicates chemical composition involved in dehydroxylation (e.g. Hoefs and Frey 1976; Burkhard et al. 1992; Rahn et al.1994; Sharp et al. 1995; Schmidt et al. 1997). Prior to the one’s intention to determine the pressure and temperature using these methods a careful micro-structural study is found to be necessary (Abart and Ramseyer 2002; Hürzeler and Abart 2008; Herwegh et al. 2008).
Clay mineralogy and coal petrography methods are nowadays closely related with diagenetic studies of sedimentary rocks and are still of high importance in hydrocarbon commercial research (Allen and Allen 2005). This importance is archived in several review studies, textbooks and special volumes, only to mention the most important published during the last three decades: Oltz (1978), Larsen and Chilingar (1983), Gautier (1986), Burrus (1986), Buntenbarth and Stegena (1986), Robert (1988) and Hutcheon (1989). In modern basin studies, these methods are indispensable to constrain basin histories (Naesser and McCulloh 1989; Allen and Allen 1990, 2005). Due to the commercial importance of hydrocarbons, a main interest in correlating the clay mineralogy and chemistry with organic matter data is confined to the temperature range of 20–150 °C (max 200 °C). In most of the modern review- and textbooks on diagenesis, coal petrology and clay mineralogy, very and little attention were paid to the question of what happens with clay minerals and coal macerals upon the incipient metamorphism stage (e.g. Parker and Sellwood 1983; Larsen and Chilingar 1983; Weaver 1989; McIlreath and Morrow 1990; Leeder 1995 and Velde 1995).
Organic-matter evolution at higher-grade metamorphism (exceeding 200 °C and 2 kbar) is less known in geological praxis (Diessel et al. 1978; Beyssac et al. 2002; Petrova et al. 2002; Ferreiro Mählmann et al. 2002; Rahl et al. 2005; Le Bayon et al. 2011, 2012a, b). However, industrial coal carbonization and coal combustion processes under high temperatures are well understood (Taylor et al. 1998). M. Frey stimulated the very low-grade metamorphic (VLGM) studies using KI/VR correlations in geodynamic researches (e.g. Frey et al. 1980; Rahn et al. 1995; Schmidt et al. 1997; Belmar et al. 2002; Potel et al. 2006). Following the sudden death of M. Frey a descent in the VLGM studies became apparent, especially because the VLGM studies still have not been fully integrated into organic petrology and clay mineralogy, with many researchers having shifted their research interests toward environment and technical topics. A new scientific interests crystallised within the last decade witnessing a significant drop in the VLGM field of research. The research importance of clay mineral evolution in soil formation, environmental mineralogy and contaminated-land studies are high (Jasmund and Lagaly 1993; Wilson 1999, 2004; Cotter-Howells et al. 2000; Uzarowicz et al. 2011). In these studies the focus is mostly set on retrogression processes that comprise (1) alterations of the very low-grade to high-grade rocks into clays and (2) processes analogue to the natural diagenesis observed in tecnosoils. This review paper and the special issue are aiming to spark a new beginning of the VLGM studies of B. Kübler and M. Frey, having an accent on orogenic studies. In next chapters we will demonstrate how changes in the correlation of KI and VR yield the new possibilities of geodynamic considerations based on the clay mineral and coal petrological methods.
2.4 The importance of Kübler-Index and vitrinite reflectance data for metamorphic studies: definition of the zone of diagenesis and anchizone
In metamorphic studies, contrary to the diagenesis research, the very low temperature range has been little considered, due to the intrinsic disequilibrium conditions and few discrete mineral-reaction isograds established (mostly zeolites and phyllosilicates). To reveal metamorphic conditions of the formation of authigenic metamorphic minerals, a parallelism to the reaction progress of KI and VR was frequently established (Frey 1987a; Frey and Robinson 1999). In contrast the KI zones of diagenesis and metamorphism were correlated to VR stages with reaction isograds of newly formed minerals and KI/VR evolution models calibrated with mineralogical or geochemical mineral data (Ferreiro Mählmann 2001). Thus, studies on the evolution of clay minerals by Kübler (1964), Dunoyer De Segonzac (1970), and Millot (1970) and the evolution of coal macerals by Teichmüller and Teichmüller (1966) and Stach et al. (1971) were compared.
Kossovskaya et al. (1957) and Kossovskaya and Shutov (1961, 1963, 1970) correlated the mineral transformations in different lithologies and established “stages of epigenesis and metagenesis”. Logvinenko (1956) compared these “stages” of micro-structural patterns with bituminous coal ranks in terrigenous sedimentary rocks. Zaporozhtseva (1960) and Kisch (1966a) compared the laumontite zone of the zeolite facies, and Kisch (1966b, 1968, 1969) the replacement of kaolinite by chlorite and illite, with rank of the associated coals (for summary see Kisch 1974, Fig. 1; Árkai 1991). For an extended review of these studies, see also the textbooks of (Frey 1987a) and Frey and Robinson (1999).
Mostly, the low-grade metamorphic (greenschist facies) studies in meta-sedimentary rocks start when temperatures reach at least the isotherm of 350 °C, where conditions can be constrained by the first occurrence of neoformed metamorphic minerals like biotite, chloritoid, clinozoisite, actinolite, etc. (Turner 1968; Winkler 1979; Yardley 1989). Therefore, most publications on metamorphism deal with conditions above 350 °C (e.g. in the special issue of Treloar and O’Brien 1998).
The anchimetamorphic P–T field ranges between diagenesis and low-grade metamorphism were for a long time poorly known (Parker and Sellwood 1983; McIlreath and Morrow 1990; Yardley 1989; Shelley 1995; Barker 1998), until some mineral reaction isograds for simplified chemical systems were established at low-pressure conditions between 200 and 350 °C (Frey et al. 1973, 1991; Liou et al. 1987, 1991; Frey 1987b). Thus, from the very beginning of metamorphic studies (see Bucher and Frey 2004), the upper limit of diagenesis was defined differently (Árkai et al. 2007), mostly due to the correlation of zeolite facies of Coombs et al. (1959) with diagenesis (e.g. Kisch 1966a; Barker 1998).
In all papers of this special volume, the term “Anchimetamorphose“ (anchimetamorphism) of Harrassowitz (1927) is practically identical with the term “very low-grade” of Winkler (1979), as well as with the term “anchizone” of Kisch (1987). Further on, the anchizone correlates more-or-less either with the sub-greenschist facies, as defined in textbooks of Frey (1987a) and Bucher and Frey (1994, 2004). The recommended systematic classification of terms is roughly conventional and conservative (including the first rate review paper of Árkai et al. 2007). Applying the strict use of the zone limits suggested by the authors, a conflict results comparing the kinetic-controlled conclusions on the anchizone limits discussed in this paper (Fig. 14). The P–T–t dependence of the KI/VR correlation from the geothermal-geodynamic setting needs a more flexible interpretation than the recommendations of the International Union of Geological Sciences Subcommission on the Systematics of Metamorphic Rocks (Árkai et al. 2007).
Comparing the upper limit of the anchizone with VR data, the KI boundary mostly parallels with the upper limit of the “Magerkohle” (=low volatile bituminous coal/anthracite stage boundary) as shown by Frey (1987a), Árkai (1991), and Ferreiro Mählmann (1996, 2001). All these correlations defining the anchizone refer to studies performed using the Kübler–Frey–Kisch standards and based on a standardisation and comparison of methods in order to determine grade of diagenesis and VLGM (Ferreiro Mählmann and Frey 2012). Because anchizone determined by the CIS standards (Warr and Rice 1994) is not equal to that defined through the Kübler–Frey–Kisch standards (Ferreiro Mählmann and Frey 2012), such a discrepancy needs to be taken into account in VLGM studies. The KI zones in the present paper and all KI data presentations are defined according to the Kübler–Frey–Kisch standard calibration.
Different terms should be used for describing the grade of diagenesis (low-grade and high-grade diagenesis or diagenetic zone) and chronologic genetic aspects of diagenesis (early and late diagenesis of sedimentary processes). Even if in the original publications of Kübler, pressure was not explicitly expressed, term diagenetic grade implies not only temperature, but also pressure changes (Kübler 1984). The term grade of diagenesis refers to changes in temperature and pressure and the terms early and late diagenesis to syn-sedimentary pre-metamorphic processes. As internationally accepted (Frey 1987a), the following zones of diagenetic/metamorphic grade are defined by KI values: diagenetic zone (grade of diagenesis) ≥0.42 ∆°2θ, anchizone 0.42–0.25 ∆°2θ, and epizone ≤0.25 ∆°2θ (Kisch 1987).
The mineral paragenesis, fluid-inclusion zone, clay-mineral index data, fission-track zone, coal ranks and graphitisation stages are variable in relation to the KI zones depending from the factors P–T–t–D–Xs–Xf (pressure, temperature, time, deformation (strain), phase chemistry, fluid chemistry) in a kinetic context as anticipated by Frey et al. (1980). The terms diagenesis, anchizone and epizone strictly refer to ranges of the metamorphic reaction progress as determined by KI (Frey 1987a; Árkai 1991; Merriman and Frey 1999). If an author uses the terms diagenesis, anchizone and epizone corresponding definition using the KI, values should be given in respect to the CIS or Kübler–Frey–Kisch calibration. If not, serious problems in compiling and correlating literature data will happen (Ferreiro Mählmann and Frey 2012; Potel and Trullenque 2012).
Due to the advances in VLGM studies in the period of 1967–1987, the first textbook named “Low Temperature Metamorphism” was published by Frey (1987a). The review papers gave a first summarized overview about the evolution of different rocks from diagenesis to low-grade metamorphism. Subsequently, Frey and Robinson (1999) published newer results in the basic textbook “Low-Grade Metamorphism”.
2.5 Factors influencing the Kübler-Index vitrinite reflectance correlation
Kübler (1964) assumed that the ≤2 μm size fraction is dominated by the neo-formation of clay minerals. Thus, the XRD peak sharpness (Fig. 1) should be an indicator of metamorphic grade (we restrict the discussion to the illite 10 Å-peak). Its relationship with crystallite size and defect-free area size was evidenced by HRTEM studies of Warr and Nieto (1998) and further confirmed by evolution of the illite in the ≤2 μm size fraction on a regional scale, indicating a KI decrease with increasing metamorphic grade (Frey et al. 1973, 1980; Jaboyedoff and Thélin 1996), especially in slates and meta-pelites (Kisch 1980a, b; Hunziker et al. 1986; Yang and Hesse 1991). The number of illite layers (N) obtained by HRTEM studies generally agrees with the N values from KI studies estimated by the Scherrer equation (Fig. 2) or related methods (e.g. Nieto and Sanchez-Navas 1994; Árkai et al. 1996; Dalla Torre et al. 1996; Jaboyedoff et al. 1999).
It is evident that the crystallite-size evolution renders a controlling factor on the KI values. Many studies (e.g. Nieto and Sanchez-Navas 1994; Árkai et al. 1996; Dalla Torre et al. 1996; Jaboyedoff et al. 1999; Merriman and Peacor 1999; Merriman and Frey 1999) further support that the number of crystalline defects generally abates with metamorphic grade. The contribution of this factor to peak enlargement is more difficult to quantify than the crystallite-size factor due to obstacles related to the definition and intrinsic heterogeneous nature of the concept itself. Nevertheless, a positive correlation of both factors with increasing metamorphic grade allows a simple evolutionary quantification of the general concept of crystallinity based on crystallite size (Árkai et al. 2002a and Figs. 2, 3). In addition to factors discussed, other features non-related to illite “crystallinity” itself are to be considered:

Plot of: a mean crystallite thickness and Kübler-Index values from samples of Helvetic units. b Mean lattice strain and Kübler-Index of the same samples. c Mean lattice strain and mean crystallite thickness showing the close relationship with the Kübler-Index. Filled symbols are from air-dried and open symbols from ethylene glycol-solvated mounts. Squares and triangles are from deformed rocks, where triangles are mostly from tectonites of the Gellihorn nappe and quartz-ductile deformed rocks with a penetrative cleavage. In samples with strong value scattering and in the outlier at 0.53 Δ°2θ an intensive fluid driven re-crystallisation of illite (more prominent than chlorite) was recognised (modified after Árkai et al. 2002a)
-
1.
The instrumental contribution differs from one to another diffractometer; consequently a standardization of the values must be carried out to do the KI comparable from laboratory to laboratory. Various proposals of standards have been offered beginning from the Kisch (1991) slabs. Currently the international CIS standards (Warr and Rice 1994) are widely used in most of the KI laboratories. The CIS accuracy and compatibility with the Kübler–Frey–Kisch standards, used basically in the Alps, is debated (Ferreiro Mählmann and Frey 2012), and its use as Kübler-Index standards is not recommended, thus corroborating the studies of Brime (1999) and Kisch et al. (2004).
-
2.
Smectite-layer inter-stratification in illite (R3 illite/smectite mixed-layers) produces a significant broadening of the 10 Å-peak. Therefore, smectite content severely affects the KI value at the grades at which smectite layers are still present, that is, until the beginning of the anchizone (Fig. 4). This effect can be tested by the comparison between KI measured in air-dried and ethylene-glycolated (EGC) samples; however, the presence of smectite layers is an intrinsic characteristic of the illitic material in such grades, and consequently its contribution to the peak enlargement must not be avoided by a hypothetical use of the EGC values (Kisch 1980a, b; Kübler 1990; Kübler and Jaboyedoff 2000). The great enlargement caused in the air-dried samples by smectite layers (S) increases the resolution power of the KI in the diagenetic zone and must be taken advantage of.
Fig. 4 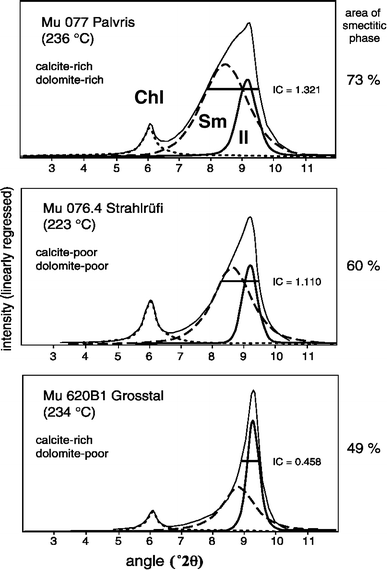
Clay-mineral fraction XRD-runs of air-dried samples calibrated with metamorphic temperatures from fluid inclusions given in °C. Il illite, chl chlorite, sm smectite. Modified after Mullis et al. (2002). The carbonate content and type of phase controls the stability of the smectite (Ca–Mg rich)
-
3.
When other mica-type minerals such as paragonite are present, they produce a broadening of the peak, which is not related to the grade of metamorphism and must be avoided by the exclusion of the affected samples. The use of deconvolution programs (Stern et al. 1991; Wang et al. 1995; Lanson 1997; Battaglia et al. 2004; Kisch and Nijman 2010), or the alternative measure of the 5 Å peak (Nieto and Sanchez Navas 1994; Battaglia et al. 2004; Kisch and Nijman 2010) or the 2.5 Å peak (Ciulavu et al. 2008) is an alternative procedure to find KI equivalent values. The 2.5 Å peak is little less affected by close vicinity of basal lines (00l) of low-ordered chlorite, paragonite, kaolinite, R1 chlorite–vermiculite, biotite–vermiculite and other clay minerals. A major problem are (hkl) lines resulting from poorly prepared mounted slide that is frequently reported (Dohrmann et al. 2009; Ferreiro Mählmann and Frey 2012).

As a preliminary conclusion we argue on four illite (I) reaction-progress factors that are found to influence KI: (1) the thickness or the number of layer (N) of the coherent scattering domain (CSD) size (Figs. 2, 3a), (2) the proportion of the inter-layered swelling component (%S) within the I/S mixed-layer (Fig. 4), (3) the presence of different illite or I–S populations and (4) lattice strain (Fig. 3b, c; Árkai et al. 2002a). Furthermore, studies in cataclasitic zones and mylonites show that the expandable layer effect tends to be more significant than strain effects are. However, the lack of a model including both expandable layers and lattice strain does not allow a fine comparison of this effect between XRD and HRTEM methods (Jaboyedoff et al. 2001). The fundamental-particle mean-layer number (Nfp) given by the relationship Nfp = N/(1 + (N − 1) × (%S/100)), as postulated by Środoń et al. (1990, 1992), is used to quantify very low-grade metamorphic conditions. Generally, N increases with metamorphic grade (Eberl and Środoń 1988). A fundamental review paper giving a broad summary, published by Essene and Peacor (1995), showed the intrinsic limitations of the thermometric use of clay-mineral data.
The influence of the rock chemistry has been highly debated. In some studies it has been shown that calcite (or dolomite) content of slates, marls and limestones has no influence on the average KI (Burkhard and Goy-Eggenberger 2001) but the opposite opinion has also been statistically evidenced (e.g. Ferreiro Mählmann 1994; Árkai et al. 2002b, 2003; Ferreiro Mählmann and Giger 2012). The calcite-dolomite content in marls and slates controls the stability of Ca–Mg–smectite (Mullis et al. 2002) and results in KI widening. In any case, the rock chemistry has an influence on the chemical composition of smectite in diagenesis to low-grade anchizone, as shown in Fig. 4, comparing samples of same diagenetic grade calibrated by the fluid inclusions (FI) temperatures. Therefore, the smectite content in I–S has a broadening effect on the KI value through the varying chemically controlled temperature stability of smectite. Chemistry of the illite-precursor mineral has also a control on KI (Esquevin 1969). The celadonite content is another important factor (Flehmig and Gehlken 1989; Árkai et al. 2003). In the case of sandstones and meta-psammitic rocks the influence of K–Na detrital micas in the ≤2 μm size fraction is also high (Krumm 1984; Gaupp and Batten 1985; Frey 1987a; Abad et al. 2001, 2003a). It is also well known from these studies that evaporitic rocks, red-facies sediments and bituminous rocks must not be used for KI studies.
A significant example is shown in Fig. 5. Strong KI variations are found in a Mesozoic profile of the Silvretta nappe (Austroalpine, Eastern Swiss Alps) in formations containing anhydrite and dolomite-rauhwacke rocks (Raibl formation). The K- and Na (Mg)-cation availability causes a smaller KI value due to a quicker reaction progress at same T–P-conditions. A broader 10 Å-illite peak, thus a larger KI value, is found in bituminous shale and marl rocks (Prosanto formation, Platten limestone). In these rocks, hydrocarbon molecules can be included in the interlayer or an illite encapsulation by bituminite films (well visible in VR studies on the polished sections at 1,250× magnification). This bituminite can prevent the cation exchange. While compiling research of Kübler and Frey and new studies it became apparent that a part of data scattering (Figs. 6, 7, 8, 9, 10, 11, 12) reflects a large amount of variations related to mineral composition, as discussed above. It is to be inferred that KI is a method aimed to be applied statistically, using a representative number of samples. One should exclude the redbed facies, salinar facies and bituminous samples.

Stratigraphic section of the Permian to late Triassic rocks of the Silvretta nappe (Upper Austroalpine, Grisons, Eastern Switzerland) with related Kübler-Index (KI) values deciphering a hyper-thermal burial gradient. All kind of rocks could be used for the graph. The illite 10 Å-peak showed mostly peaks higher than 50 cps, except in the Hauptdolomite. The figure is modified after (Ferreiro Mählmann 1994, 1995, 2001) including data from the Prosanto Formation (open circles) measured for Meister (1999). Strongly varying KI values in bituminite and organic matter rich rock are shown in black dots. Samples from rocks of an evaporitic facies are presented with a grey filled circle

Comparing the advance in metamorphic very low-grade mapping in the Aiguilles Rouge section in the Western Alps of Switzerland between the pioneer study of Kübler et al. (1979a) and Burkhard and Goy-Eggenberger (2001). At the position of the black asterisk, a remarkable metamorphic hiatus and isocryst line deformation (D2) is observed, as also the metamorphic inversion at the basal plane of the Penninic nappes (D1). In Fig. 7 the asterisk marks a change in the Kübler-Index/vitrinite reflectance trend slope (gradient)


Comparing the advance in metamorphic very low-grade studies in the Glarus section in the eastern Helvetic Alps of Switzerland between the pioneer study of Frey et al. (1973), Frey (1988) and Rahn et al. (1994). The compilation of Kübler-Index/vitrinite reflectance data is completed with VR data from M. Frey, P. Árkai and R. Ferreiro Mählmann (this work) and presented with grey filled circles. Metamorphism is post-nappe tectonic except at the Glarus thrust with a tremendous metamorphic inversion. VR data in the upper figure from the Vrenelisgärtli, presented in open circles, are from Rahn (1994). VR data in the lower figure, presented in open circles, are from Erdelbrock (1994) and projected into the Sernft valley section at Elm from Frey (1988) according to the KI grade and the structural position


Vitrinite reflectance evolution with increasing tectonic burial in the Kander-valley section (modified after Árkai et al. 2002a). Also, as in the Glarus Alps (Fig. 9) a vitrinite-reflectance increase in the tectonite zone and in rocks with a slaty cleavage demonstrates the strain effect. Nevertheless, the Kübler-Index/vitrinite reflectance plot does not verify a significant trend

In the integrated data area all studies compiled from the Helvetic and Austroalpine tectonic units are presented. Comparing this area with other normal geothermal collisional and nappe-tectonic settings from New Caledonia and the Carpathians, it is suggested that the data area represents normal to slight hypo-thermal (Lower Austroalpine) to slight hyper-thermal (Reuss Valley) orogenic gradients. Striking is the aberrant data set from Árkai et al. (2002a)

Comparison of Kübler-Index/vitrinite reflectance correlation studies compiled in the integrated data area of orogenic settings with studies referring to hyper-thermal extensional and contact metamorphism. High temperature gradients cause a shift to the right side of the graph. This documents a faster increase of vitrinite reflectance versus Kübler-Index values. The aberrant data set from Árkai et al. (2002a) from Fig. 10 is explained with high strain rates (Fig. 10) and high thermal heat flow conditions at low pressure. The temperatures at the pluton contacts (Monte Mattoni—Monte Blumone, Val Fredda) are derived from petrogenetic grids (see text)
Introductions to the VR method are available in different papers of present issue and are in particular discussed in Le Bayon (2012) and Ferreiro Mählmann and Frey (2012).
Unfortunately, weathering, syn-sedimentary and early to late-diagenetic alteration processes change VR, and oxidation is a fundamental problem increasing the reflectance values (Littke 1993). Excluding any kind of oxidation, easy to detect by careful examination of the specimens (Littke 1993; Ferreiro Mählmann 1994), the VR method has a significant advantage of being controlled basically only by peak metamorphism. A retrograde evolution of the chemical-structural aromatisation process (coalification, graphitisation) is not possible (Teichmüller 1987). For the definition of term regarding coalification versus graphitisation see Ferreiro Mählmann et al. (2002). The breakdown of aliphatics and degassing of volatiles in organic matter is a purely prograde process (graphitisation) operating until the graphite crystallographic lattice texture is formed. In order to have a more reliable dataset we excluded samples showing any traces of oxidation.
3 Kübler-Index, vitrinite reflectance and its correlations in tectonic studies
The factors influencing KI, discussed in the previous chapter, have been already recognised in the 1960s. It was the period when Kübler and Frey were working on the development of a new absolute geo-thermometer that would not be based solely on clayey calibration techniques. Need of a new geo-thermometer was evident as in the investigated pelites, other clastics, marls, carbonate rocks and their meta-sedimentary equivalent no index minerals or facies critical paragenesis were reported. Thanks to his experience in hydrocarbon exploration and related research Kübler used VR of organic matter that is present frequently dispersed in sedimentary and meta-sedimentary rocks (Kübler et al. 1979a, b).
As reported in Sect. 2.2, Weaver (1961) introduced the ‘sharpness ratio’, and Kübler (1967, 1968) and Dunoyer De Segonzac et al. (1968) the illite-“crystallinity” method (Kübler-Index, KI) to the scientific geological studies. In the 1960s a low precision of the temperature determination by mineral reactions was well known (Niggli 1960). On the contrary, it was observed that the coalification grade (‘rank’) of organic matter continuously and sensitively changes over a large temperature range, specifically vitrinite reflectance. The same was established for aggradation-reaction progress of illite. In an earlier work Kübler (1964) had evidenced the importance of clay studies for determination of diagenetic grade and incipient metamorphism. Departing from his PhD (1968) Martin Frey conducted the first application of KI to orogenic metamorphic studies (Frey 1969a, b, 1970; Frey et al. 1973). With support of the Mineralogical Institute of Niggli in Bern (cooperation with Frey), Dietrich (1969) presented his PhD. It was the first extended multi-methodical very-low-grade metamorphic study including KI to determine metamorphic grades in a nappe complex and to reconstruct its geodynamic evolution.
In 1970, Dunoyer De Segonzac published a widely used review paper on the transformation of clay minerals during diagenesis and low-grade metamorphism and Frey (1970) focused on orogenic metamorphic conditions in the Alps. Many groups started from these review papers to use KI and KI/VR methods in order to determine the metamorphic grade and to perform metamorphic mapping (e.g. Weber 1972; Thum and Nabholz 1972; Frey et al. 1973; Aprahamian 1974; Schaer and Persoz 1976; Dunoyer De Segonzac and Bernoulli 1976; Schramm 1977; Kübler et al. 1979b; Środoń 1979; Teichmüller et al. 1979; Kisch 1980a, b; Krumm 1984) in areas formerly classified as un-metamorphosed (e.g. compare the “Metamorphic Map of the Alps” of Niggli and Zwart (1973) with maps of Frey et al. (1999) or Oberhänsli et al. (2004)). Today hundreds of case studies have been published from deeply buried sedimentary basins, Molasse basins, Flysch basins, thin-skinned orogenic wedges, orogenic lids and accretion wedges (inverted basins in general). Comparing the KI data of the anchizone limits from the cited literature in this chapter with the equivalent VR values many different correlations are found. The lower limit of the anchizone correlated with VR %Rmax values of 2.4–3.3 and the higher limit with VR %Rmax values of 3.7–6.2. The range of KI/VR variations are much larger than cited in textbooks discussed in Sect. 2.4.
First attempts to correlate KI with VR were published by Frey and Niggli (1971), Wolf (1975), Teichmüller et al. (1979), Kübler et al. (1979b), and Kisch (1980a, b). Wolf (1975) stated that the kinetics of VR is much faster than illite aggradation and therefore may imply higher grades than the KI, particularly in areas of post-kinematic igneous activity (see discussion by Kisch 1987, in Frey 1987a, p. 259 ff.). Even so, this fact was neglected during the next decades when attempting to use it as a geo-thermometer.
In folded terranes the intersection between iso-VR and/or iso-KI lines and folding (Teichmüller and Teichmüller 1966) allowed to precise whether metamorphic occurrence was pre-, syn- or post-folding (Frey et al. 1980; Hesse and Ogunyomi 1980, see also Figs. 6, 8). Early studies in orogenic foreland basins showed that iso-reflectance maps (Wolf 1969; Paproth and Wolf 1973) gave robust results on metamorphic field trends in rocks were KI proved useless due to the high amount of smectite and mixed layering in the low-grade diagenesis zone.
The KI/VR method is also a powerful method to define the amount of crustal thinning at detachments of metamorphic core complexes (e.g. Wiederer et al. 2002; Ciulavu et al. 2008). The KI/VR method can also be used to distinguish between hiatus induced by metamorphic inversion (transported metamorphism) at thrust nappes and erosion hiatus in sedimentary record (gap in heating time during the erosion event, erosive missing of formations), when KI/VR gradients change in slope or intensity at a discontinuity in an stratigraphic section (Bozkaya et al. 2002, 2006, 2012a, b). These combinations of methods can support important facts for tectono-metamorphic studies at diagenetic to low-grade conditions.
4 Kübler-Index: organic matter reflectance correlations as paleo-geotherm indicator
4.1 Kübler-Index/vitrinite reflectance studies in the western Helvetic Central Alps
In the first orogenic KI/VR study (Kübler et al. 1979b), it was recognised that in a cross section through the Swiss Western Alps (Jura Mountain, Molasse basin, Prealpine nappe, Helvetic and Penninic nappes) each tectonic unit has its own diagenetic to metamorphic grade. With only 22 samples the authors were able to characterize the whole nappe structures and tectonic units in a regional scale (Fig. 6). In the Morcles section a top downward increase of tectonic burial (orogenic metamorphism) trend was recognised. By increasing the number to 350 KI and 50 VR samples a very complex diagenetic to metamorphic pattern and much more detailed picture was found (Schmidt et al. 1997; Burkhard and Goy-Eggenberger 2001). Based on 268 KI data, it was demonstrated that the diagenesis–anchizone–epizone boundaries crosscut the present-day Morcles recumbent fold and nappe structure (Burkhard and Goy-Eggenberger 2001). Furthermore, Kübler et al. (1979b) recognised that the higher-grade metamorphic Préalpes and Penninic nappes moved over the Helvetic structural lower units causing an inversion in metamorphic grade at the thrust base (Fig. 6, Mosar 1988). The Morcles nappe-deformation style is post-metamorphic as recognised by Kübler et al. (1979b), otherwise in the lower structural units nappe thrusting is pre-metamorphic (Schmidt et al. 1997), but deformation is poly-phase and the Morcles recumbent fold is post-metamorphic (Burkhard and Goy-Eggenberger 2001). The post-D1 thermal-re-equilibration metamorphic pattern after the first nappe stacking phase is again deformed by folding and ramp faults during the last shortening (Fig. 6; Steck 2008). D1 and D2 in Fig. 6 show only the deformation relation to the metamorphic field gradients (pre- and post-metamorphic). From the area in Fig. 6, Burkhard and Goy-Eggenberger (2001) and Steck (2008) were able to define a total of five deformation stages. The large scatter in the KI/VR correlation (Fig. 7) may point to the more complex metamorphic history, as indicated by a slight change in the regression slope of the KI/VR data, marked in Figs. 6 and 7 with an asterisk.
Unfortunately, VR values and KI data were not measured in all cases on the same samples (Kübler et al. 1979b; Schmidt et al. 1997; Burkhard and Goy-Eggenberger 2001). Nevertheless, the data variance is large due to the projection from different locations. Probably, an additional E–W field gradient is to be expected, as the S–N trend of decreasing grade is visualised in Fig. 7 together with an interrupted top-down structural gradient. Close to the Helvetic–Penninic fault boundary (Simplon-Rhone shear zone), pressures up to 5.0 kbar were estimated in the Doldenhorn nappe (Morcles equivalent) (Schmidt et al. 1997). In the upper Helvetic nappes (Diablerets, Wildhorn) pressures between 2 and 3 kbar were determined.
By comparing the mineral paragenesis data (Frey et al. 1999; Oberhänsli et al. 2004) including a compilation of Steck (2008, Fig. 10) with KI and VR data from the Bern Alps the interrupted trend of KI versus VR shown in Figs. 6 and 7 becomes striking. A flat slope is found in the Aiguilles Rouges sedimentary cover and par-autochthon, but also in the Morcles nappe. In this a transition from the prehnite–pumpellyite to the pumpellyite–actinolite facies is indicative for a metamorphic field gradient at pressures >3 kbar. In the Préalpes, Niesen and Wildhorn nappes (partly also Diablerets nappe, Fig. 6), the laumontite to prehnite–actinolite transition is related to pressures below 3 kbar, in line with a higher-temperature gradient culminating in the east with an anchizone–epizone boundary, and the chloritoide-in isograd of the incipient greenschist metamorphism. For a first conclusion, this may point to a P–T-gradient dependence as a major reason for the difference in the KI/VR slopes (Fig. 7). A methodical reason can be excluded because all three research groups have used KI calibrated values and the same VR measurement approach.
4.2 Kübler-Index/vitrinite reflectance studies in the eastern Helvetic Central Alps
The first systematic study across a complex nappe and imbrication structure was presented by Frey et al. (1973) from Vrenelisgrätli Mountain, Switzerland (Fig. 8). A post-nappe tectonic metamorphism, increasing from diagenetic grade to high anchizone from the structurally higher units to the lower units of the Helvetic nappe system, was identified. It became also evident (Frey et al. 1973) that a single tectonic unit may show variations in its metamorphic grade with structural depth. The reconstruction of paleo-geothermal gradients was possible. Some unpublished VR data at Vrenelisgrätli and presented in Fig. 8 corroborate the data of Frey et al. (1973). Studies in the eastern part of the Helvetic nappes in Switzerland determined a poly-phase metamorphic and deformation history (Frey 1988) similar as in the Western Alps (Sect. 4.1). In these studies, metamorphic inversions at the nappe thrusts boundaries, but also syn-metamorphic tectonically buried nappe piles were found (Fig. 8), verified with other clay mineral data, VR, fluid inclusions, radiometric and fission track (FT) methods and supported by a large statistical number of samples (Rahn 1994; Rahn et al. 1995; 1997, 2002; Wang et al. 1996; Kahr et al. 1996; Árkai et al. 1997). Some new VR data at Vrenelisgrätli (work in progress) demonstrate the same history (Fig. 8) as postulated by Frey et al. (1973).
Frey (1988) also found a prominent hiatus in the KI data across the Glarus thrust (Fig. 8). At this locality, that demonstrated an inherited earlier epizone metamorphism affecting the hanging wall of the out-of-sequence Glarus thrust (Fig. 8). The epizonal metamorphic rocks were transported onto lower grade metamorphic rocks of the lower structural Helvetic units (Infrahelvetic domain). The detection of inverted metamorphism at thrust faults is important for reconstructing poly-phase metamorphic-deformation history in thrust belts. The hiatus has also been recognised with VR and FT data (Rahn et al. 1995, 1997).
Comparing the KI and VR data compiled from the above mentioned publications of the eastern Helvetic thrust belt of Switzerland (Fig. 8), again a difference in slope is observed (see Fig. 9), similar to that one found in the western Helvetic Central Alps. The slope is different in sample sets (Fig. 9), from the north and higher structural units (Helvetic Glarner, Axen and Säntis nappes) relative to sample-data from the southern lower structural units of the South Helvetic units and North-Helvetic Flysch (Infrahelvetic) below the Glarus thrust. This metamorphic hiatus is the best-studied metamorphic inversion, documented by structural and low-grade metamorphic research (Ph.D. studies and 27 papers, see Árkai et al. (1997) for metamorphic studies and Herwegh et al. (2008) for structural studies and references therein). It is interesting to note that in the Helvetic nappes metamorphism occurred at low-pressure, whereas in the Infrahelvetic it was of medium-pressure type (Frey 1988). From the medium-pressure trend a flat slope is again deduced. Considering, as in the Morcles area, the KI/VR slopes found, the strong increase of VR versus KI in the epizone is difficult to explain discussing exclusively about the influences of the factors time, temperature and pressure.
4.2.1 The Glarus thrust after Frey: the effect of strain on the Kübler-Index and vitrinite reflectance
Together with the Simplon line (e.g. Mancktelow 1985, 1990) and the Turba mylonite zone (Nievergelt et al. 1996; Weh 1998; Ferreiro Mählmann and Giger 2012), the Glarus thrust is the most striking metamorphic discontinuity in the Central Alps (Frey et al. 1999; Frey and Ferreiro Mählmann 1999). Illustrated in Figs. 8 and 9, some anomalous values of KI (mostly lower) and VR (mostly higher than data from distant samples) are found close to the Glarus thrust. This is not an isolated case at thrust faults.
Epizone KI-values in the hanging wall close to the Glarus thrust and in the mylonite reflect the fluid-flow history but not peak metamorphism (Abart and Ramseyer 2002; Hürzeler and Abart 2008). A few meters away from the tectonite–mylonite the values are anchizonal. A similar fluid-driven effect during deformation is found in the Gellihorn shear zone (tectonite) in the central Swiss Alps (Árkai et al. 2002a). With fluids having an alteration effect on KI values it is also important to consider whether VR values can be affected by fluid oxidation. Hydroxylation of vitrinite causes increase in reflectance (Littke 1993). Vitrinite oxidation is recognized by the loss of bireflectance (inertinitisation of organic matter, Stach 1935). In neither area (Glarus thrust, Gellihorn tectonite) this fluid oxidation was reported.
Nevertheless some anchizonal KI values from “sedimented clay fraction specimens” (Ferreiro Mählmann and Frey 2012) and very high VR values found in the resin-mounted specimen of the same rock sample are striking. A different reason than fluid alteration is to consider (no oxidation recognised) explaining the high VR values at the Glarus thrust (7.5 %Rmax) and in the thrust plane separating the South and North Helvetic Flysch units (6.9 %Rmax) beneath the Glarus thrust (Fig. 8). Correlating VR with KI in the units of the footwall of the Glarus thrust, a strong increase of VR values in rocks with a KI of <0.33 ∆°2θ is shown. That contrasts to neighbouring areas to the north affected by the same anchizonal grade of metamorphism. Together with the faster increase of VR compared to KI a change in the deformation style and micro fabrics is observed. A strain effect is to consider. In contrast, Burkhard and Badertscher (2001) found that directly measured finite tectonic strain has had no influence on illite “crystallinity” (IC) of Eocene limestone-breccias from the Swiss Alps. Burkhard and Goy-Eggenberger (2001) concluded that close correlation between IC (KI) and tectonic strain intensity “should not be used to infer that IC values depend on strain intensity. Rather, both strain intensity and IC are strongly dependent on temperature.” The presented controversy will be discussed having a closer look at the Glarus thrust.
An increase in strain to the south of the Helvetic nappes (specifically in the Infrahelvetic domain) is well known (Schmid 1975; Herwegh et al. 2008). Below 270 °C, in kakiritic-cataclastic tectonites in quartz brittle deformation zones, the discrepancy between KI and VR can exceed 2.0 ∆ %Rmax and KI may show broader values than in the undeformed rocks (also Árkai et al. 2002a). In the shear zone of the Gellihorn tectonite and also of the Glarus thrust, as also in the footwall of both, a lowering of the illite scattering-domain size is observed, and illite shows higher amounts of mean lattice strain and vacancies, specifically in high-grade diagenesis–low anchizone (Árkai et al. 1997, 2002a). Schmidt et al. (1997, 1999) described similar effects from the Bern Alps (Morcles–Doldenhorn nappes, western Helvetic Central Alps). The KI broadening effects at thrust faults and shear zones is caused by stress-induced sub-grain boundary formation lowering the domain size (Giorgetti et al. 2000).
In the Glarus Alps a similar KI/VR trend, like in the Austroalpine of the Grisons (Ferreiro Mählmann 2001; Ferreiro Mählmann and Giger 2012), is observed. At the basal thrust of the Lower Austroalpine and in the Turba mylonite zone (Grison Alps), the difference in KI versus ∆VR from deformed and undeformed rocks decreases with increasing metamorphic grade along the fault plane from N to S (Ferreiro Mählmann 2001; Ferreiro Mählmann and Giger 2012). The same feature is also seen at the Glarus thrust by comparing the data from Hunziker et al. (1986), Frey (1988), Erdelbrock (1994), Rahn et al. (1995), and Árkai et al. (1997). The compiled data set was compared with the temperature trend from N to S along the early HT mylonites along the Glarus thrust worked out in detail by Herwegh et al. (2008). In the hanging wall the strain effect of KI broadening is blurred due to mica neo-formation by fluid-rock interaction. With increasing metamorphic grade, syn-kinematic mica re-crystallised at a higher crystallite order, and the KI retardation in respect to VR value-increase in ductile chlorite-quartz mylonites is no more detectable. It seems that at greenschist facies metamorphism (in this area the chloritoid-in isograde is found, Frey and Ferreiro Mählmann 1999), independent of the rate increase in deformation, a strain effect on KI and VR is no more possible. This is probably explained, because a diagnostic change in KI and VR is irrelevant due to the methodical limit of both methods reached in the high epizone (greenschist facies). The limit of the XRD measurement device control, used for the data compilation (Figs. 5, 6, 7, 8, 9, 10, 11, 12, 13, 14, 15) is ∆°2θ 0.122–0.13 (Ferreiro Mählmann and Frey 2012). Pre-graphitic microstructures in vitrinite and bituminite limit also the use of VR. Finally, it needs to be stressed that also KI and strain correlations depend closely on the temperature during deformation (Flehmig 1973; Flehmig and Langheinrich 1974; Burkhard and Badertscher 2001).

Comparison of Kübler-Index/vitrinite reflectance correlation studies compiled in the integrated data area of orogenic settings with studies referring to hypo-thermal compressional and subduction metamorphism. With increasing pressure a shift to the left side of the graph is evident. A high strain deformation can reverse that trend as visible for the Bündner schist samples, specifically from the samples recovered in sub-blueschist facies rocks. Vitrinite reflectance and/or Kübler-Index values have to be pressure dependent (explanation see text). Kübler-Index/vitrinite reflectance data from the North Penninic Bündnerschists of the Prättigau and Lenzerheide Flysch are published by Ferreiro Mählmann (1994). Data from Chur, Thusis and the NE Grava nappe, from areas with a low blueschist facies metamorphism are from Petrova et al. (2002) and Ferreiro Mählmann et al. (2002)

Raman spectroscopic data showing the large variation in Raman shift spectra of different macerals in a Bündnerschist sample of Petrova et al. (2002) and the modelled temperature from graphitisation geo-thermometry. In a low-grade epizone sample the temperature range found would include all the possible temperatures of the anchizone according the Kübler-Index/vitrinite-reflectance correlation and calibration

Conclusive Kübler-Index/vitrinite reflectance plot showing strong geothermal (heat flow) dependent trend-evolutions regarding the geodynamic setting. A high-grade contact-metamorphic overprint can blur trend evolutions caused by increased burial or tectonic overburden. If a regular increase with depth is recognised, flattening of the gradient is observed due to higher vitrinite reflectance with temperature rise. Another factor is an increase in strain. Strain and hyper-thermal flow enhances the vitrinite reactivity in respect to Kübler-Index values. The latter is probably much more pressure dependent than expected until now (see text)
Even excluding the KI/VR values of samples affected by deformation from further correlations, the VR values from the hanging wall of the Glarus thrust (Helvetic nappes) are still too high in respect to the general KI/VR correlation trend. This can be explained by a projection effect from the Erdelbrock (1994) data obtained some 10 km to the east. Even so, VR values, based on nine re-measured VR samples and included in the formula found by Rahn et al. (1994), the regression describes now a slope at lower KI and higher VR. The new slope (dark grey line in Fig. 9) is more sub-parallel to the regressions found by Frey et al. (1980) in the Reuss and Kien valleys (Fig. 9) and to the trend found in the Morcles nappe (Fig. 7).
The KI/VR relation found in the lower units of the Glarus Alps can be compared with the KI/VR gradient and slope (Fig. 10) detected in the central Helvetic Alps of Switzerland compiled from the data published by Árkai et al. (2002a). The shift in slope and the range of KI/VR data can be also compared with the KI/VR-correlations found in the western Helvetic Central Alps (Fig. 7).
In the hanging-wall, in the Helvetic nappes at Vrenelisgrätli (Fig. 8), new samples from a section studied by KI (Frey et al. 1973) were included from a NF-project that was not concluded due to the death of Martin Frey. New VR values (Fig. 8) correlate with those published by Rahn (1994) and Rahn et al. (1994). Compared with values from the same nappes (solid black line in Fig. 9) from the east of the Glarus Alps (Erdelbrock 1994), the values are 2.5–0.8 ∆ %Rmax lower. A thicker eroded tectonic overburden (>10 km) or a thermal gradient higher than 30 °C km−1 in the east (Erdelbrock 1994) seem unlikely, contrasting with the structural model discussed by Herwegh et al. (2008). Comparing other parameters to determine metamorphic grade (Frey et al. 1973; Frey 1988; Rahn et al. 1994, 1995, 1997), also a lower overburden and geothermal gradient should be considered, as in the Glarus area (Vrenelisgrätli section, Fig. 8), giving a steeper KI/VR slope (grey striped line in Fig. 9).
During the re-measuring of VR samples shown on Fig. 8 by the first author, it was observed that vitrinite-like bituminite material in Triassic rocks give a 2.0 ∆ %Rmax higher values than vitrinite. Vitrinite in the amount (n) given by Erdelbrock was not detected (the Helvetic Permian and Triassic is poor in vitrinite, mostly less than n = 20 vitro-detrinites per sample). Thus, bituminite is much more frequent and tends generally at higher maturity to increase in ∆ %Rmax (Ferreiro Mählmann 2001; Ciulavu et al. 2008; Ferreiro Mählmann and Frey 2012).
Reinterpreting the KI/VR data from the Glarus Alps the KI/VR-regression of Rahn et al. (1994) is discussed in this article to be controlled by strain effects (deformation including dissolution end removal of material). Comparing the data from Erdelbrock (1994) a bias is obvious because solid bituminite was probably taken for vitrinite. In the Glarus Alps and Infrahelvetic units the increased deformation seen with the development of a penetrative slaty cleavage (e.g. like in the Gellihorn tectonite Fig. 10), results in a strain effect (Kisch 1989) and using the literature KI/VR data has to be seriously considered.
At the anchizone–epizone boundary in the Lower Austroalpine units, as well as in the thrust planes, VR increases in chlorite mylonites about 1.0 % (Ferreiro Mählmann 2001). However, compared to the un-deformed rocks at high heat flow conditions in the Danubian window (Romania), the difference is ∆ 2.7 %Rmax (see also Figs. 8, 10), accompanied by strong increase in bireflectance (Ciulavu et al. 2008). Thus, the difference found in the Glarus Alps is in the range of the mean value comparing the Glarus data with those of the two other Alpine structural units. Recently, Littke et al. (2012) evidenced a strain influence, postulated by Koch (1989), by bireflectance partitioning also occurring in very low-grade rocks parallel with the incipient development of cleavage (see also Árkai et al. (2002a). Thus, strain effects have to be considered also in very low-grade rocks.
In rocks with a high strain rate an enhancement of VR versus KI is well known also from other areas (e.g. Teichmüller and Teichmüller 1954; Teichmüller 1987; Levine and Davis 1989; Ross and Bustin 1990; Wilks et al. 1993; Bustin et al. 1995). The structural deeper part of the Bernese Alps as in the Glarus Alps is highly deformed and strain may explain the shift to higher VR values in both areas. The strain effect on KI is difficult to quantify because illite dissolution, removal of material and precipitation is difficult to estimate, but seems to be of minor importance compared to VR.
4.3 Kübler-Index/vitrinite reflectance correlations from the Helvetic Alps compared with metamorphism duration
In 1980, Frey and others published a comparative multi-methodological paper comparing KI/VR data from different nappes of the Central Alps. In each unit the anchizone boundary was established with different VR values and temperatures. It was concluded that time and environmental variables such as temperature and pressure associated with a specific geodynamic setting controls illite aggradation and vitrinite maturation. Similar studies were carried out in parallel in the Appalachians (see Hesse and Ogunyomi 1980).
The KI/VR correlations obtained for the Helvetic nappes of the Glarus Alps, the Lake Luzern—Lukmanier section, the Reuss, Kien and Kander valleys, and the Morcles nappe show various slopes (Figs. 7, 8, 9 and summarized in Figs. 11, 15). In the central part of the Helvetic domain, the KI/VR correlation shows a negative and slightly flat slope (Reuss valley, Fig. 9). In contrast a steeper increase of VR compared to KI is less pronounced in the Kander valley and Kien valley section (Fig. 9). The western Bernese Alps (Wildhorn, Diablerets) in the west and the Glarus Alps (Vrenelisgrätli) in the east are found on the left side of the KI/VR-diagram (Figs. 7, 9). The Helvetic units discussed have experienced the same thermal history of Early Tertiary orogenic metamorphism. This may explain the parallel KI/VR trends on Fig. 11 but not the differences found. From the central part of the Helvetic Central Alps a second shorter metamorphic overprint is known (Niggli 1960; Niggli and Zwart 1973; Frey 1978; Frey and Ferreiro Mählmann 1999).
An increase in VR relative to KI at the north of the Lepontine nappes (Central Swiss Alps) reflects the young (Tertiary) thermal effect of the Lepontine dome (Frey et al. 1999). The thermal gradient in the Helvetic domain first decreases from N to S, and reaching the Aar Massif, it increases again (Frey 1978). The increase is related with the second metamorphic Alpine orogenic overprint in the southern central part of the Helvetic and Infrahelvetic nappes (Frey 1978, 1986; Rybach et al. 1980; Frey and Burkhard 1992). The KI values do not change in the N–S trend evolution in respect to the mineral reaction isograds in the map view of Frey and Ferreiro Mählmann (1999), but the VR increases within a short distance, the same as the graphitisation of organic matter (Wiederkehr et al. 2009). It is again evident that the slower reaction progress of KI is a significant factor (Wolf 1975). The difference in the KI and VR evolution observed is dependent on the time of reaction (effective heating time): time is an important parameter and must be considered in thermometric KI/VR-models to determine metamorphism and will be discussed in the next chapter.
Concluding from a genetic point of view, a thermo-tectonic comparison is possible between the Aiguilles-Rouges autochthon in the west and the Aar-massif autochthon in the east, as also for the displaced Morcles nappe in the west and the higher Infrahelvetic nappes in the east, and at least for the uppermost structural units of the Diablerets together with the structural higher Helvetic nappes in the west and the Glarus thrust with its structural higher Helvetic nappes in the east (see also Schmid et al. 2004; Steck 2008). This scenario is well adaptable to a low-pressure series with normal geothermal conditions in the Helvetic domain, and an intermediate pressure series with slightly lower geothermal orogenic conditions in the Infrahelvetic and Morcles nappes, as also in the Autochthon. In the Central Helvetic Swiss Alps a short thermal overprint with a slightly higher gradient is related with the thermal history of the Lepontine dome and partially re-equilibrates the metamorphic mineral-KI-VR relationship.
5 Numerical modelling for understanding burial and thermo-orogenic KI/VR regressions
The main interest to apply KI/VR studies in VLGM research is aimed to the determination of metamorphic temperatures and pressures as well as to the reconstruction of paleo-geothermal gradients. In addition the goal is to use such results in the hydrocarbon reservoir or intra-formational deposit prospection studies, along with the geothermal energy exploration.
From previous discussions it is evident that a specific KI, VR and KI/VR values cannot be related to absolute temperature. Thus, a calibration with thermodynamically determined mineral reaction isograds or numerical modelling is necessary. Mineral reactions in meta-sedimentary rocks are known to be sluggish (see Sect. 2.4), promoting the usage of modelling, in this case maturity modelling. A coherent data set is a pre-condition for numerical time–temperature modelling techniques. 95 % of the VR and KI data (calibrated with the same methods, Ferreiro Mählmann and Frey 2012) fit well with very low standard deviations and variances. Only samples with an error lower than 10 % were used in the compilation to correlate KI and VR in this study. To better understand the different KI/VR slopes, first of all, a maturation modelling has to be developed.
At the time when Kübler, Frey and others published their multi-methodical studies (Kübler et al. 1979a; Środoń 1979; Frey et al. 1980), only numerical maturation modelling based on empirical or formalistic mathematical approaches were available (e.g. Lopatin 1971, translated by Waples 1980; Bostick et al. 1978). In the following decade, the vitrinite reflectance model of Bostick et al. (1978) was predominantly used to determine metamorphic temperatures in geological terranes occurring in the Alps and to calibrate KI data for geo-thermometric use (e.g. Rahn et al. 1994; Erdelbrock 1994).
In hydrocarbon exploration, time–temperature index of maturity (TTI) of Lopatin (1971) and Waples (1980) was preferred (Issler 1984; Ritter 1984; Robert 1988, Allen and Allen 1990) and also used in the working group of Krumm at Frankfurt University (Petschick 1989; Ferreiro Mählmann 1994). Even so, the research in well-studied metamorphic Alpine units, where temperatures were determined by multi-methodical studies, pointed to low precision using only temperature- and time-dependent models. Moreover, the lack of knowledge of temperature history made its use difficult and invalidated the empirical background of the Bostick or TTI models. Most results were speculative and interpretation changed with the progress done in orogenic studies worldwide. From many terranes geo-chronological data were not available, thus much simpler equations based on linear, second- or third-order regressions of VR versus temperature (e.g. Price 1983; Barker 1983, 1988; Barker and Pawlewicz 1986, 1993; Barker and Goldstein 1991) were preferred in very low-grade studies.
In the review of Kisch (1987) the Price–Barker–Bostick models were criticised due to the low accuracy of the temperatures prediction for the lower and upper anchizone limits. Zone limits were calibrated by Kisch (1987) with mineral facies critical data and petrogenetic grid data. Using the different equations of the Barker models also Ferreiro Mählmann (1994) found inconsistent temperature results. It was possible to calculate with one of the cited equations realistic temperature values for the metamorphism of an Austroalpine nappe in the Eastern Alps, but in another tectonic unit the same equation failed. Despite that, the most-used maturation equation, describing VR increase as an exponential function of temperature, is that of Barker (1988) and Barker and Pawlewicz (1986, 1993) recently still frequently used (e.g. Schönherr et al. 2007; Judik et al. 2008; Williams et al. 2008; Littke et al. 2012). A web research gave 105 references in 2011 only, including conference abstracts. A temperature linear regression calculation was intended later in the same way correlating KI with fluid inclusion temperatures (Mullis et al. 2002).
Applying the cited methods of Price, Barker, Bostick and Mullis temperatures between 205 and >265 °C were calculated for the diagenesis–anchizone boundary and between 255 and >350 °C for the anchizone–epizone boundary. Due to the large temperature range determined for a specific KI/VR, geosciences investigators will find a VR/temperature regression model fitting with temperatures determined with other methods. Often the simple conclusion is than given on that basis, that the equation with the best fit is consequently the most accurate one.
Based on the above demonstration of variations in results from maturity models, a single VR or KI regression versus temperature is not able to describe differences in grade of VR or KI (Figs. 7, 8, 9, 10, 11). Based on the KI/VR data comparison, a lower anchizone limit in the Autochthon, the Infrahelvetic and the Helvetic nappes correlate with different mineral paragenesis or petrogenetic grid results, resulting in different temperatures for each tectonic unit. It becomes evident that absolute temperature cannot be calculated using a simple VR– or KI-temperature regression. Therefore, TTI of Lopatin (1971) giving different time-dependent temperatures much better fit with temperature estimations or determinations obtained through mineral calibrations (e.g. Krumm et al. 1988; Petschick 1989; Underwood et al. 1991; Ferreiro Mählmann 1994, 2001).
In the last decade, the EASY %Ro-model (Sweeney and Burnham 1990) found a large attraction in the Alps (Todorov et al. 1993; Schegg 1993, 1994) and was widely applied worldwide (Waples et al. 1992; Allen and Allen 2005) both in coal and hydrocarbon exploration and in orogenic studies as well. The kinetically based first-order Arrhenius reaction approach of Sweeney and Burnham (1990) is less time dependent than TTI (Ferreiro Mählmann 2001). This model attracted wide attention and is currently being the most widely used. It showed promise of being universally applicable to the modelling of VR (e.g. Morrow and Issler 1993; Sachsenhofer and Littke 1993; Petmecky et al. 1999). The use of Lopatin–Waples-type TTI modelling has been criticised (Sweeney and Burnham 1990, Ferreiro Mählmann 2001 and references therein) and is generally regarded as an outdated modelling technique. In some orogenic metamorphic terranes, VR simulation with the model of Sweeney and Burnham (1990) has also been questioned based on calibration with petrologic methods (Rahn et al. 1994; Pagel et al. 1997; Rantitsch 1997). In some studies, specifically in high-pressure terranes and also under hyper-thermal conditions, the EASY %Ro-modelling showed certain limitations in use (Ferreiro Mählmann 2001; Ciulavu et al. 2008). In particular, Le Bayon et al. (2011) showed the large disparities dependent on pressure and heating time between the laboratory maturation experiments and the model EASY %Ro of Sweeney and Burnham (1990) at 400 °C (Fig. 16).

Comparison of VR modeled with EASY%Ro to VR obtained with experiments as a function of effective heating time t at 400 °C and 2, 10 and 20 kbar. The gray thick curve is the VR evolution with time modeled with EASY%Ro at 400 °C. The three curves (dashed, solid, pointed) are the least-square best fits to the data using the power law equation of Le Bayon et al. (2011). Modified after Fig. 11 of Le Bayon et al. (2011)
Nevertheless, kinetic modelling application will give similar temperatures in cases where analytical data show a stable generalised relationship between clay mineral parameters (Foscolos 1990), mineral reaction processes (Merriman and Frey 1999), and coalification data (Hillier et al. 1995). It seems that equilibrated condition are established if the factors close to maximum metamorphism do not change during more than 10 Ma (Ferreiro Mählmann 2001). Time is equally important for the VR and KI evolution (reaction progress), as is temperature.
It was recognised with a combined TTI—and EASY %Ro-model that steady-state heat-flow conditions found in the Lower Austroalpine of the Grison Alps (Fig. 11) give a flat-slope regression in the KI/VR diagram (Ferreiro Mählmann 2001). A similar KI/VR evolution as in the Lower Austroalpine units is observed in terranes in which re-equilibration took place at sub-greenschist facies. In New Caledonia re-equilibration took place in a collisional second phase, during formation of an accretional nappe stack posterior to a subduction event, as described by Potel et al. (2006). The KI/VR trends of the Lower Austroalpine and New Caledonia are sub-parallel (Fig. 11). After pluri-facies metamorphic evolution, some crystal-chemical clay parameters (e.g. K-white mica b cell dimension) are more robust than KI (Potel et al. 2006). The first sub-blueschist facies event in New Caledonia was only recognised by the preserved K-white mica b cell dimensions (Potel et al. 2006). Due to varying reaction kinetics, different clay-mineral indicators for determining metamorphism may display different steps of a P–T–t path (Abad et al. 2003). We suggest a multimethod clay-mineral approach for deciphering orogenic histories and in general geodynamic scenarios and if possible a combined investigation using organic indices and maturity modelling.
Using the TTI and EASY %Ro-modelling data from the cited literature of the Alps, all KI/VR correlations are plotted in Fig. 11 and interpreted according to the thermal gradients modelled or determined by mineralogical calibrations. The integrated KI/VR data area in Fig. 11 is a compilation from the Helvetic and Austroalpine orogenic domains metamorphosed under “normal” thermal conditions at a gradient of 25–35 °C km−1 and under heat flow regimes of 55–75 mW/m2. The slope associated with a normal geothermal gradient from the Severin–Cosustea units of the South Carpathians (30 °C/km) lies between the slopes in Fig. 11 defined by the Reuss valley (35 °C/km or higher) and the slightly lower gradient from the Lower Austroalpine of the Alps (25–28 °C/km). The low geothermal orogenic limit of diagenesis and metamorphism is partly present in the diagenesis zone in the Morcles nappe (Fig. 7). Because the trend is not verified for the epizone, the lower limit is not presented in Fig. 11. The gradients from the Lower Austroalpine, the Severin–Cosustea units, and from New Caledonia will be used as references for normal geothermal conditions in the forward compilation study.
With the help of Fig. 11 we attempt to reinterpret the strongly discrepant KI/VR result of Árkai et al. (2002a). The studied area is situated at the north of the Lepontine dome, where the second thermal effect extends on a large scale far north into the Helvetic nappes. The KI peak broadening, caused by deformation and strain, results in a large data scatter with no correlation between KI and VR data. Accordingly, the extreme situation has inclined Suchý et al. (1997) to argue to detect a frictional heating effect on VR measurements as discussed to occur at some Alpine structures (Schönherr et al. 2004). Probably a much better interpretation is to postulate a doubling effect combining a high orogenic geothermal gradient (Frey 1978) with a high strain rate (Árkai et al. 2002a). This may have caused an incremental VR increase. Nevertheless, it was not possible to model with EASY %Ro VR values from strong deformed rocks, but in low or undeformed rocks a geothermal gradient could be restored (Fig. 11; Árkai et al. 2002a). Excluding highly deformed rocks, a numerical maturation approach is able to model temperatures. Temperature determinations seem to be unreliable in VLGM research, if temperatures in KI and VR studies were determined without a mineralogical calibrated maturation model.
6 New investigations posterior to the work of Kübler and Frey
6.1 KI/VR correlation in settings with a high geothermal gradient or contact metamorphism
Hyper-thermal conditions are not encountered in the Helvetic tectonic units, thus the interest in geothermal studies was focussed on other orogenic areas. From the very low- to low-grade metamorphic core complex of the Danubian window in the South Carpathians a representative KI/VR correlation (probably the core-complex case study with the largest very low-grade data set) is shown (Fig. 12). The gradient shifts to the right of the Reuss valley trend (Fig. 12), indicating, as determined from the metamorphic study by Ciulavu et al. (2008), hyper-thermal gradients (>35 °C/km) during core-complex formation. In this tectonic setting the role of temperature is predominant in metamorphism in contrast to this of pressure that is considered as negligible. High thermal processes produce mostly a flat KI/VR slope with a strong increase in VR at higher metamorphic conditions in comparison to the reference gradients of the Lower Austroalpine, from New Caledonia or from the Severin-Cosustea units discussed in Sect. 5 (Figs. 11, 12). A slow KI progress is typical for that kind of orogenic settings with a syn- or post-kinematic plutonism (see the extensive review of Kisch 1987 and later findings by Yang and Hesse 1991, Warr et al. 1991 and Belmar et al. 2002) or short-lived high heat-flow conditions (Warr et al. 1991; Ciulavu et al. 2008).
Another case study is presented with its KI/VR correlation in Fig. 12. In the diastathermal Vichuquén basin in Chile, at locations far away from the granitoid intrusions, the KI/VR data fit into normal gradients of orogenic settings (Fig. 12). In these “normal” samples, VR is characterised by a regular bireflectance and homogenous plane extinction; also, no cleavage is found (Belmar et al. 2002). In the Vichuquén samples, plotting on the right side of the normal KI/VR gradient (Severin–Cosustea nappe gradient, Fig. 12), an increasing undulatory extinction and sub-grain areas are observed (Belmar et al. 2002). A homogenous VR cannot be measured accurately, and the single values have a high standard deviation and variance, thus not accepted for the correlation study (see Sect. 5).
Surpassing the upper limit of high geothermal orogenic metamorphic KI/VR relationships (Reuss valley, Danubian nappes, Fig. 12) to higher VR values, in some Vichuquén samples pyro-bituminite and vitrinite with pre-graphitic structures as graphite sphaerolithes appear. In reflected light microscopy the term “optical graphite” is defined by an organic particle with a high reflectance (>10 %) and high anisotropy (bireflectance), as proposed by Diessel and Offler (1975), combined with the occurrence of internal sub-microscopic granular (semi-crystalline) areas or microscopic, nematoblastic and fibre-like forms (“Graphitische Strukturen”, Ramdohr 1928). Pre-graphitic features (Ferreiro Mählmann et al. 2002) are largely developed in most phytoclasts in close vicinity to plutons. With increasing metamorphic grade a helicitic, undulating extinction under polarized light indicates the initial formation of graphite sphaerolithes (Ramdohr 1928; Stach et al. 1982).
At plutons, a fast increase in VR over a short-distance is evident in epidote-hornblende rocks occurring in the Vichuquén basin with a paleo-geothermal level showing metamorphic conditions of high-diagenesis to high-epizone. In the same rocks KI remains completely unaffected (Belmar et al. 2002) and shows same field gradient trends as in areas without intrusions. This indicates a very short time of temperature increase in the basin close to the intrusions. Since the “normal” samples with a regular vitrinite bireflectance are plotting in the left part of orogenic KI/VR settings (slightly low geothermal gradients, 25–30 °C/km), it must be questioned that the Vichuquén basin can still be interpreted as diastathermal.
A third case study is from the Alps. In the neighbourhood of the Re Di Castello intrusion of the Adamello batholith (Val Fredda), the first author and Martin Frey sampled a series of Mesozoic rocks from the outer to the inner aureole of the Val Fredda quartzdiorite–monzonite intrusion (younger intrusion of the Adamello batholith) and more to the east, another series into the aureole of the Blumone gabbro intrusion (older magmatism of the Adamello batholith, Fig. 12). In both areas the estimation of temperature from contact metamorphic mineral paragenesis and facies critical minerals shown in a petrogenetic grid are mostly close to 600–800 °C, correlating with a VR of 7.2–7.9 %Rmax (Fig. 12). However, to attain such a VR of 7.2–7.9 %, maturation requires only temperatures of ca. 410–420 °C using the equation of Barker and Pawlewicz (1986). These temperatures are considerably low compared to the temperatures estimated from contact metamorphic mineral paragenesis and facies critical minerals. This strengthens the results of Le Bayon et al. (2011) that demonstrated severe limitations of the geothermometer based on VR of Barker and Pawlewicz (1986) at 400 °C, but also for EASY %Ro (Fig. 16). TTI (Lopatin 1971; Waples 1980) gives sometimes a better fit, but is restricted to VR of maximum 5.0 %Rmax (400 °C at 10 Ma, 445 °C at 1 Ma). Considering that TTI is especially difficult to justify (Sweeney and Burnham 1990) and has no real theoretical basis, modelling shows that time cannot be completely neglected. The strong misfit in the temperature determination is probably explained by the fact that in orogenic settings a pre-intrusion tectonic burial scenario establishes a moderate increase in VR (not possible to be modelled) and additional enhanced coalification during the intrusion. In the intrusion model a zero coalification does not represent the starting point of the maturation process at time of intrusion (using TTI). The same optical features found at the pluton contacts in Chile are also observed in the Adamello area. At the time of intrusion the sedimentary rock was prior buried and the organic matter coalified to stages much higher than that of peat. Sediment load (burial) and later orogenic metamorphism due to tectonic load of several km thick overthrust units caused sub-greenschist facies conditions. Anchizone found in areas not affected by plutonism (Brack 1981, 1984; Colombo and Tunesi 1999) are related to the Cretaceous Pre Adamello Phase (Schmid et al. 1996). However, the multi-intrusion plutonism unfortunately causes a very complex KI/VR map-view pattern and the data grid is still weak.
The pre-orogenic or pre-intrusion history prior to the thermal peak considerably controls the maturity increase to the final VR measurement in some numerical maturity models. Neglecting that, the misuse of the numerical maturity models results in bad results/modelling. It is assumed that most misfits in modelling temperature, also of orogenic metamorphism, occurred because the pre-orogenic/pre-intrusive burial history (sediment basin history) was not considered in very-low-grade studies (see Ferreiro Mählmann 2001; Ciulavu et al. 2008). Very-low-grade studies in high thermal settings are rare and experiences in that field are largely missing.
6.2 KI/VR correlation in geological settings influenced by pressure
In 1989, Underwood et al. found a complex KI/VR relationship comparing different basins. However, it is to be noted that KI in Underwood et al. (1989, 1991, 1992) was obtained on specimens treated with ethylene glycol, which influences the correlation (KI should be obtained from air-dried samples as indicated by Kisch and Frey 1987). Underwood et al. (1991, 1992) stated from high-pressure terranes that VR is retarded when pressure is a prominent factor of metamorphism (Fig. 13).
This is confirmed by plotting the data of Dalla Torre et al. (1996) into the graph of Underwood et al. (1991). In addition, a few other studies give hints that VR is retarded by pressure (for an overview, see Dalla Torre et al. 1997). Moreover, studies carried out in the Alps at high-pressures show a similar trend to lower VR/KI evolution compared to those observed in normal geothermal conditions. This was found in rocks of sub-blueschist to blueschist facies conditions (Ferreiro Mählmann 1994). All these studies argue for the retarding effect of high pressure on VR. In his last decade of research, Frey set up a large research project together with S.Th. Schmidt, W.B. Stern and the first author combining experimental- (Dalla Torre et al. 1997) and field-based studies in different geodynamic high temperature to high pressure settings (Belmar et al. 2002; Petrova et al. 2002; Potel et al. 2006; Ciulavu et al. 2008). The objective was to assess the debated influence of lithostatic pressure on KI and VR.
The studies conducted by the Basel group corroborated the concept that pressure is a retarding agent on VR (Dalla Torre et al. 1997; Petrova et al. 2002). In a case study from the Alps, a clear difference in the KI/VR relation was found between the sub-greenschist rocks from NE to SE Bündnerschists and the sub-blueschist rocks (Fig. 13) from the SW Northpenninic Bündnerschists of Grisons, Eastern Switzerland (Petrova et al. 2002). In the same structural unit (i.e. Northpenninic Bündnerschists), Fig. 13 shows that sub-greenschist facies rocks are more mature and present a higher KI/VR trend than rocks metamorphosed at sub-blueschist facies. This argues for pressure as a retarding agent in the KI/VR correlation. The KI/VR correlation from the SW Bündnerschists fits with the LT/HP gradient determined from the King Range (USA) by Underwood et al. (1991). Dalla Torre et al. (1996) measured in the Diablo Range (Fig. 13) much lower VR values, similar to those found by Underwood et al. (1991, 1992) in well-preserved blueschist facies rocks from the Franciscan complex.
Furthermore, a progressive increase in VR is observed with increasing deformation starting from a penetrative cleavage in the north of the Bündnerschists to quartz-ductile conditions in the south where lenticular feldspar elongation is involved. However, excluding strongly deformed samples, VR retardation was assumed based on the difference in VR/KI found between sub-greenschist and sub-blueschist metamorphic rocks from the Northpenninic Bündnerschist (Fig. 13). Nonetheless, the kinetic model of Dalla Torre et al. (1997) considering the effect of pressure on VR and VR/KI results does not explain the results in VR values measured in the Bündnerschists. This points to the deficiency of the model of Dalla Torre et al. (1997) in calculating the evolution of VR. Consequently, the first author initiated a new experimental program in Darmstadt together with Gary W. Ernst and Ronan Le Bayon (Ernst and Ferreiro Mählmann 2004; Le Bayon et al. 2007, 2011, 2012a, b; Le Bayon 2012) using VR and Raman-shift graphitisation data on vitrinite. The reason for a possible VR retardation was investigated in a structural HRTEM study by Ferreiro Mählmann et al. (2002), but this ultrafine-structure study does not contribute to a better understanding of VR retardation.
6.3 Raman microspectrometry of organic matter
Raman spectroscopy of organic matter appears to be a potential novel method to estimate metamorphic conditions of metasedimentary terranes because the Raman signal of organic material is correlated with metamorphic degree. Geothermometers were formulated (e.g. Beyssac et al. 2002; Rantitsch et al. 2004; Rahl et al. 2005) based on the correlation of organic material Raman spectra with paleotemperature estimated in organic matter-bearing metamorphic rocks. In addition to measure the Raman signal (employing 532 and 514 nm lasers), it was possible in our preliminary study to first identify the phytoclast type, the Raman laboratory in Basel (Prof. H.A. Hänni) and Mainz (Prof. L. Nasdala). This preliminary study used a synthetic graphite (Fig. 14) obtained from laser 1,080 nm sintering (1,200 °C, 99.7 % C) as standard to calibrate the Raman signal of organic matter. Our reflected-light microscopic and Raman-spectroscopic studies revealed that the different macerals present in the same sample (Fig. 14) show different steps in the maturation/graphitisation process (see also Demeny 1989). This is supported by recent studies (e.g. Quirico et al. 2009; Guedes et al. 2010) pointing out that the Raman signal strongly depends on the precursor and type of organic material and maceral. Therefore, a study of the nature of phytoclasts is indispensable prior to applying Raman spectroscopy to metamorphic organic matter. Hence, bulk organic matter Raman spectroscopic studies have to be avoided. Furthermore, the geothermometers based on the Raman signal of organic matter are questionable because their calibration neglected the influence of organic matter precursor on the Raman signal.
The “uncertainty” shown in Fig. 14 is large and fits inside the ±50 °C uncertainty given by the empirical calibration of Beyssac et al. (2002). At high-anchizone to epizone conditions the importance of the deformation effect on KI and VR was demonstrated. The range of error of ±50 °C from the Raman study is the same in magnitude as the range of possible VR increase due to strain effects (Figs. 13, 15). The range measured would give a minimum error of 100 °C for a Raman study using the discussed numerical modelling. Moreover, one can suppose that the uncertainty at very-low-grade conditions may be controlled by maceral composition and ordering. However, the Raman data are in good agreement with the indexing of mineral zones (Barrow zones) and some petrogenetic grids (Wiederkehr et al. 2011). Nonetheless, the resolution of the Raman signal of organic matter is lower than the other very low-grade metamorphic methods (KI, VR). Furthermore, no difference between the spectral evolution in a sub-blueschist and sub-greenschist facies environment is recognisable by comparing Raman studies performed in the KI/VR range of the anchizone of this review study (e.g. Judik et al. 2008; Wiederkehr et al. 2009).
Furthermore, the kinetics of the evolution of the Raman signal of organic material has to be investigated in order to determine metamorphic conditions in very-low to low-grade metasediments inasmuch as organic matter maturation is time dependent.
A combination of KI–VR–Raman signal measured in organic matter-bearing rocks should have a high potential to quantify P–T conditions in a metamorphic study once the influences of pressure and temperature on the kinetics of the evolution of the Raman signal of a well defined organic matter are determined.
6.4 Pressure influence on VR and clay mineralogy
An experimentally-based equation describing the kinetic evolution of VR as a function of pressure was proposed by Dalla Torre et al. (1997). This equation was formulated in Basel and thought to be able to be extended to VR higher than 5.0 %Rmax (meta-anthracite). Dalla Torre et al. (1997) stated from their series of laboratory maturations that pressure retards VR. Nevertheless, the study of Dalla Torre et al. (1997) considered only a few heating durations and a small range of investigated VR. In addition to the effect of heating time and temperature, the influence of pressure on VR was recently reinvestigated in a more systematic way (Le Bayon et al. 2007, 2011, 2012a, b; Le Bayon 2012). After a long debate (Le Bayon et al. 2011, 2012b and references therein), it was evidenced that VR is not only temperature- and time-, but also pressure-dependent (Le Bayon et al. 2011, 2012a, b, Fig. 16). Moreover, it is of interest to note that Ernst and Ferreiro Mählmann (2004) experimentally found that the rate of huminite/vitrinite maturation is unaffected by nature of the lignitic starting material (conifer or hardwood) and contrasting oxygen fugacity ranges defined by hematite–magnetite (HM) and magnetite–quartz–fayalite (FMQ) buffers. The recent laboratory studies of Le Bayon et al. (2011, 2012a, b) demonstrated that each magnitude of VR has its own increase kinetics, which is pressure and temperature dependent (Fig. 16). Whereas the promoting effect of temperature on VR is obvious, the role of pressure increases kinetics of VR increase and therefore on Type III organic matter maturation is complex. It depends on the magnitude of VR with respect to the key VRi = 1.34 ± 0.29 %, at which a transition to a pressure-affected vitrinite maturation takes place in experiments (Le Bayon et al. 2012b). For VR < VRi, pressure retards vitrinite maturation because increasing pressure slowes down the kinetics of VR increase and hence hinders VR increase with increasing time. This retarding effect of pressure decreases with increasing VR and is neutralized when VR attains VRi. When VR = VRi, pressure practically has no impact on vitrinite maturation. For VR > VRi, pressure promotes vitrinite maturation inasmuch as increasing pressure reduces the amount of VR increase. A deceleration with increasing VR is observed and thus pressure greatly augments VR increase with increasing time (Fig. 16). This promoting effect of pressure increases at higher maturity levels. Furthermore, the experimental work of Le Bayon et al. (2011, 2012a, b) demonstrated that pressure promotes vitrinite maturation in geological settings at 400–450 °C because the key VRi is attained in only a few minutes to a few hours. Therefore, the retardation of VR increase due to pressure is insignificant at 400–450 °C (Fig. 16, at lower and higher temperature the effect is not experimentally determined). All these recent observations on the role of pressure in vitrinite/type III organic matter maturation were surprising and the results were presented with caution at meetings and finally published (see also Le Bayon 2012) and partly contradict the first experimental approach of Dalla Torre et al. (1997). Regarding the recent evolution of our knowledge on the influence of pressure on VR, the pressure-related shifts and retardation of VR (Figs. 13, 15) must be reconsidered.
The state of our knowledge on the dependence of KI on pressure is similar to that of VR on pressure a few years ago. Only very few KI laboratory experiments were carried out to support that temperature and time are the important factors (Smykatz-Kloss and Althaus 1974; Krumm 1984). Therefore, the effect of pressure on KI has to be estimated. Probably, Martin Frey and Bernard Kübler would not have expected that reversal. Some arguments in favour of a pressure effect on KI were presented in the researches of Robert (1988), Reinhardt (1991), Dalla Torre et al. (1996) and Do Campo and Nieto (2003). Additionally, Huang et al. (1993) and Elliot et al. (1999) suggested that pressure has to be included in the existing illite–smectite kinetic models in the future. At the moment, it is basically thought that temperature, time and the K+ concentration (availability) are by far the most important parameters controlling smectite-to-illite conversion (Huang et al. 1993).
The influence of pressure on the K-white mica b cell dimension of illite is well known. Nonetheless, it was observed that the K-white mica b cell dimension of illite is very robust to survive to a second thermal overprint taking place at a pressure lower than that occurring during a first thermal episode (Potel et al. 2006). Evidently, the K-white mica b cell dimension of illite is of high interest to estimate paleo-metamorphic pressure in metasedimentary terranes.
Field comparisons combined with experimental VR/KI–P–T–t studies will contribute to better estimates of pressure conditions in metamorphic terranes by using VR or KI. The shifts in the VR/KI diagram (Fig. 15) give some strong emphasis to be interpreted in this respect and will give a first hint for interpreting geodynamic P–T–t evolutions (see also Suchý 2000).
References
Abad, I. (2002). Diagenetic and very low-grade metamorphic processes in clastic rocks. Textural and chemical evolution of phyllosilicates. Ph.D. dissertation. Spain: University of Granada.
Abad, I., Gutierrez-Alonso, G., Nieto, F., Gertner, I., Becker, A., & Cabero, A. (2003a). The structure and the phyllosilicates (chemistry, crystallinity and texture) of Talas Ala-Tau (Tien Shan, Kyrgyz Republic); comparison with more recent subduction complexes. Tectonophysics, 365, 103–127.
Abad, I., Mata, M. P., Nieto, F., & Velilla, N. (2001). The phyllosilicates in diagenetic-metamorphic rocks of the South Portuguese zone, southwestern Portugal. The Canadian Mineralogist, 39, 1571–1589.
Abad, I., Nieto, F., & Gutiérrez-Alonso, G. (2003b). Textural and chemical changes in slate-forming phyllosilicates across the external-internal zones transition in the low-grade metamorphic belt of the NW Iberian Variscan Chain. Schweizerische Mineralogische und Petrographische Mitteilungen, 83(1), 63–80.
Abad, I., Nieto, F., Gutierrez-Alonso, G., Campo, M. D. O., Lopez-Munguira, A., & Velilla, N. (2006). Illitic substitution in micas of very low-grade metamorphic clastic rocks. European Journal of Mineralogy, 18(1), 59–69.
Abad, I., Nieto, F., Peacor, D. R., & Velilla, N. (2003c). Prograde and retrograde diagenetic and metamorphic evolution in metapelitic rocks of Sierra Espuña (Spain). Clay Minerals, 38, 1–23.
Abad, I., Nieto, F., & Velilla, N. (2002). Chemical and textural characterisation of diagenetic to low-grade metamorphic phyllosilicates in turbidite sandstones of the South Portuguese zone: a comparison between metapelites and sandstones. In: S.Th. Schmidt & R. Ferreiro Mählmann (Eds.) Diagenesis and low grade metamorphism. Schweizerische Mineralogische und Petrographische Mitteilungen, 82(2), 303–324.
Abart, R., & Ramseyer, K. (2002). Deformation induced quartz-fluid oxygen isotope exchange during low-grade metamorphism: An example from the Glarus thrust, E Switzerland. In: S.Th. Schmidt & R. Ferreiro Mählmann (Eds.) Diagenesis and low grade metamorphism. Schweizerische Mineralogische und Petrographische Mitteilungen, 82(2), 273–290.
Allen, Ph.A. & Allen, J.R. (1990). Basin analysis. Oxford: Oxford Sciences.
Allen, Ph.A. & Allen J.R. (2005). Basin analysis: principles and applications. New York: Blackwell.
Aprahamian, J. (1974). La cristallinité de l’illite et les minéraux argileux en bordure des massifs cristallins externes de Belledonné et du Pelvoux (variations et relations possible avec des evénements tectoniques et métamorphiques alpins). Géologie Alpine, 50, 5–15.
Árkai, P. (1991). Chlorite crystallinity: an empirical approach and correlation with illite crystallinity, coal rank and mineral facies as exemplified by Palaeozoic and Mesozoic rocks of northeast Hungary. Journal of metamorphic Geology, 9, 723–734.
Árkai, P., Abad, I., Nieto, F., Németh, T., Horváth, P., Kis, V., Judik, K., & Jiménez-Millán J. (2012). Retrograde alteration of phyllosilicates in low-grade metapelites: A case study from the Szendrô Paleozoic, NE-Hungary (this issue).
Árkai, P., Balogh, K. & Frey, M. (1997). The effect of tectonic strain on crystallinity, apparent mean crystallite size and lattice strain of phyllosilicates in low-temperature metamorphic rocks. A case study from the Glarus overthrust, Switzerland. Schweizerische Mineralogische und Petrographische Mitteilungen, 77(1), 27–40.
Árkai, P., Fenniniger, A., & Nagy, G. (2002a). Effects of lithology and bulk chemistry on phyllosilicate reaction progress in the low-T metamorphic Graz Paleozoic, Eastern Alps, Austria. European Journal of Mineralogy, 14, 673–686.
Árkai, P., Fenniniger, A., & Nagy, G. (2003). Chemical and structural evolution of chlorite and white K-micas in various lithologies of the low-grade Graz Paleozoic (Eastern Alps, Austria). Jahrbuch der Geologischen Bundesanstalt, 143(1), 23–38.
Árkai, P., Ferreiro Mählmann, R., Suchý, V., Balogh, K., Sykorova, I., & Frey, M. (2002b). Possible effects of tectonic shear strain on phyllosilicates: a case study from the Kandersteg area, Helvetic Alps, Switzerland. In: S.Th. Schmidt & R. Ferreiro Mählmann (Eds.) Diagenesis and low grade metamorphism. Schweizerische Mineralogische und Petrographische Mitteilungen, 82(2), 273–290.
Árkai, P., Merriman, R. J., Roberts, B., Peacor, R., & Toth, M. (1996). Crystallinity, crystallite size and lattice strain of illite-muscovite and chlorite: comparison of XRD and TEM data for diagenetic to epizonal pelites. European Journal of Mineralogy, 8, 1119–1137.
Árkai, P., Sassi, F.P. & Desmons, J. (2007). Very low- to low-grade metamorphic rocks. In D. Fettes & J. Desmons (Eds.), Metamorphic Rocks: A Classification and Glossary of Terms. Recommendations of the International Union of Geological Sciences Subcommission on the Systematics of Metamorphic Rocks (pp. 36–42). Cambridge: Cambridge University Press.
Árkai, P., & Toth, M. N. (1983). Illite crystallinity: combined effects of domain size and lattice distortion. Acta Geologica Hungarica, 26, 341–358.
Barker, Ch E. (1983). Influence of time on metamorphism of sedimentary organic matter in liquid dominated geothermal systems, western North America. Geology, 11, 384–388.
Barker, Ch E. (1988). Geothermics of petroleum systems: implications of the stabilization of kerogen thermal maturation after a geologically brief heating duration at peak temperature. U.S. Geological Survey Bulletin, 1870, 26–29.
Barker, A. J. (1998). Introduction to metamorphic textures and microstructures (2nd ed.). Cheltenham: Stanley Thornes.
Barker, Ch E, & Goldstein, R. H. (1991). Fluid inclusion technique for determining maximum temperature in calcite and its comparison to the vitrinite reflectance geothermometer. Geology, 18, 1003–1006.
Barker, Ch E, & Pawlewicz, M. H. (1986). The correlation of vitrinite reflectance with maximum paleotemperature in humic organic matter. In G. Buntebarth & L. Stegena (Eds.), Paleogeothermics (pp. 79–93). New-York: Springer.
Barker, Ch E, & Pawlewicz, M. H. (1993). An empirical determination of the minimum number of measurements needed to estimate the mean random vitrinite reflectance of disseminated organic matter. Organic Geochemistry, 20, 643–651.
Battaglia, S., Leoni, L., & Sartori, F. (2004). The Kubler index in late diagenetic to low-grade metamorphic pelites: A critical comparison of data from 10 Å and 5 Å peaks. Clays and Clay Minerals, 52(1), 85–105.
Bauluz, B., Peacor, D. R., & González López, J. M. (2000). Transmission electron microscopy study of illitization in pelites from the Iberian Range, Spain, layer-by-layer replacement? Clays and Clay Minerals, 48, 64–74.
Belmar, M., Schmidt, S Th, Ferreiro Mählmann, R., Mullis, J., Stern, W. B., & Frey, M. (2002). Diagenesis, low-grade and contact metamorphism in the Triassic-Jurassic of the Vichuquén-Tilicura and Hualacén Gualleco basins, Coastal Range of Chile. In: S.Th. Schmidt & R. Ferreiro Mählmann (Eds.) Diagenesis and low grade metamorphism. Schweizerische Mineralogische und Petrographische Mitteilungen, 82(2), 375–392.
Beyssac, O., Goffe, B., Chopin, C., & Rouzaud, J. N. (2002). Raman spectra of carbonaceous material in metasediments: A new geothermometer. Journal of Metamorphic Geology, 20, 859–871.
Bostick, N.H., Cashman, S., McCollough, T.H., & Wadell, C.T. (1978). Gradients of vitrinite reflectance and present temperature in the Los Angeles and Ventura basins, California. In F. Oltz (Ed.), Symposium in geochemistry: Low temperature metamorphism of kerogen and clay minerals (pp. 65–96). California: SEPM Pacific Section.
Bouma, A.M. (1969). Methods for the study of sedimentary structures. New York: Wiley.
Bozkaya, Ö., Gürsu, S., & Göncüoğlu, M. C. (2006). Textural and mineralogical evidence for a Cadomian tectonothermal event in the eastern Mediterranean (Sandıklı-Afyon area, western Taurides, Turkey). Gondwana Research, 10, 301–315.
Bozkaya, Ö., & Yalçın, H. (2004). Diagenesis and very low-grade metamorphic evolution of clay mineral assemblages in Palaeozoic to early Mesozoic rocks of the Eastern Taurides, Turkey. Clay Minerals, 39, 481–500.
Bozkaya, Ö., Yalçin, H., & Göncüoğlu, M. C. (2002). Mineralogic and organic responses to stratigraphic irregularities: an example from the lower Paleozoic very low-grade metamorphic units of the Eastern Taurus Autochthon, Turkey. In: S.Th. Schmidt & R. Ferreiro Mählmann (Eds.) Diagenesis and low grade metamorphism. Schweizerische Mineralogische und Petrographische Mitteilungen, 82(2), 355–373.
Bozkaya, Ö., Yalçin, H., & Göncüoğlu, M. C. (2012a). Diagenetic and very low-grade metamorphic characteristics of the Paleozoic units of the Istanbul Terrane (NW Turkey) (this issue).
Bozkaya, Ö., Yalçın, H., & Göncüoğlu, M. C. (2012b). Mineralogic evidences of a mid-Paleozoic tectono-thermal event in the Zonguldak terrane, NW Turkey: Implications for the dynamics of some Gondwana-derived terranes during the closure of the Rheic Ocean. Canadian Journal of Earth Sciences, 49, 559–575.
Brack, P. (1981). Structures in the southwestern border of the Adamello intrusion (Alpi bresciani, Italy). Schweizerische Mineralogische und Petrographische Mitteilungen, 61(1), 37–50.
Brack, P. (1984). Geologie der Intrusiva und Rahmengesteine des SW-Adamello. Ph.D. dissertation, Switzerland: ETH Zürich, Nr. 7612.
Brime, C. (1999). Metamorpfismo de bajo grado: ¿diferencias en escala o diferencias en grado metamórfico? Trabajos de Geologia, 21, 61–66.
Brime, C., Castro, M., & Valin, M. L. (2002). Recognizing illitization progress from diagenesis to very low-grade metamorphism in rocks of the Cantabrian Zone (Spain). In: S.Th. Schmidt & R. Ferreiro Mählmann (Eds.) Diagenesis and low grade metamorphism. Schweizerische Mineralogische und Petrographische Mitteilungen, 82(2), 211–219.
Brime, C., & Eberl, D. D. (2002). Growth mechanism of low-grade illites based on shapes of crystal thickness distributions. In: S.Th. Schmidt & R. Ferreiro Mählmann (Eds.) Diagenesis and low grade metamorphism. Schweizerische Mineralogische und Petrographische Mitteilungen, 82(2), 203–209.
Brindley, G.W., & Brown, G. (1980). Crystal structures of clay minerals and their identification. Mineralogical Society Monograph, No: 5. London: Mineralogical Society.
Bucher, K., & Frey, M. (1994). Petrogenesis of Metamorphic Rocks (6th ed.) Winkler’s textbook. Berlin: Springer.
Bucher, K., & Frey, M. (2004). Petrogenesis of Metamorphic Rocks (7th ed.). Berlin: Springer.
Buntenbarth, G., & Stegena, L. (1986). Paleogothermics. Lecture notes in earth sciences. Berlin: Springer.
Burkhard, M., & Badertscher, N. (2001). Finite strain has no influence on the illite crystallinity of tectonized Eocene limestone breccias of the Morcles nappe, Swiss Alps. Clay Minerlas, 36(2), 171–180.
Burkhard, M., & Goy-Eggenberger, D. (2001). Near vertical iso-illite-crystallinity surfaces croscutt the recumbent fold structure of the Morcles nappe, Swiss Alps. Clay Minerals, 36(2), 159–170.
Burkhard, M., Kerrich, R., & Fyfe, W. S. (1992). Stable and Sr-isotope evidence for fluid advection during thrusting of the Glarus nappe (Swiss Alps). Contribution to Mineralogy and Petrology, 112, 293–311.
Burrus, J. (1986). Thermal modeling in sedimentary basins. 1 st . IFP Exploration research conference. Paris: Carcance. Édicion Technip.
Bustin, R. M., Ross, J. V., & Rouzaud, J. N. (1995). Mechanisms of graphite formation from kerogen: experimental evidence. International Journal of Coal Geology, 28, 1–36.
Carver, R.E. (1971). Procedures in sedimentary petrology. New York: Wiley.
Ciulavu, M., Ferreiro Mählmann, R., Seghdi, A., Schmid, S.M., & Frey, M. (2008). Metamorphic evolution of a very low- to low-grade metamorphic core complex (Danubian window) in the South Carpathians (pp. 281–315). In S. Siegesmund, B. Fügenschuh & N. Froitzheim (Eds.), Tectonic Aspects of the Alpine-Dinaride-Carpathian System. Geological Society of London, Special Publication, 298.
Colombo, A., & Tunesi, T. (1999). Alpine metamorphism of the Southern Alps west of the Giudicarie Line. Schweizerische Mineralogische und Petrographische Mitteilungen, 79(1), 183–190.
Coombs, D. S., Ellis, A. J., Fyfe, W. S., & Taylor, A. M. (1959). The zeolite facies, with comments on the interpretation of hydrothermal syntheses. Geochimica et Cosmochimica Acta, 17(1), 53–107.
Cotter-Howells, J. D., Campbell, L. S., Valsami-Jones, E., & Batchelder, M. (2000). Environmental mineralogy: Microbial interactions, anthropogenic influences, contaminated land and waste management. Letchworth: Turpin.
Dalla Torre, M., Ferreiro Mählmann, R., & Ernst, W. G. (1997). Experimental study on the pressure dependance of vitrinite maturation. Geochimica Cosmochimica Acta, 61(14), 2921–2928.
Dalla Torre, M., Livi, K. J. T., Veblen, D. R., & Frey, M. (1996). White K-mica evolution from phengite to muscovite in shales and shale matrix melange, Diablo Range, California. Contributions to Mineralogy and Petrology, 123, 390–405.
De Lapparent, L. (1923). Leçons de pétrographie. Paris: Masson et Cie.
Degens, E. T. (1965). Geochemistry of sediments. Englewood Cliffs: Prentice-Hall.
Demeny, A. (1989). Structural ordering of carbonaceous matter in penninic terranes. Acta Mineralogica-Petrographica, Szeged, 30, 103–113.
Diessel, C. F. K., Brothers, R. N., & Black, P. M. (1978). Coalification and graphitization in high pressure schists in New Caledonia. Contribution to Mineralogy and Petrology, 68, 63–78.
Diessel, C.F.K. & Offler, R. (1975). Change in physical properties of coalifed and graphitized phytoclasts with grade of metamorphism. Neues Jahrbuch Mineralogischer Monatshefte, 1975(1), 11–26.
Dietrich, V.J. (1969). Die Ophiolithe des Oberhalbsteins (Graubünden) und das Ophiolithmaterial der ostschweizerischen Molasseablagerungen ein petrographischer Vergleich. Europäische Hochschulschriften. Ph.D. dissertation, Switzerland: University Zürich., Bern:Herbert Lang & Cie AG.
Do Campo, M., & Nieto, F. (2003). Transmission electron microscopy study of very low-grade metamorphic evolution in Neoproterozoic pelites of the Puncoviscana formation (Cordillera Oriental, NW Argentina). Clay Minerals, 38(4), 459–481.
Dohrmann, R., Rüping, K. B., Kleber, K., Ufer, K., & Jahn, R. (2009). Variation of preferred orientation in oriented clay mounts as a result of sample preparation and composition. Clays and Clay Minerals, 57(6), 686–694.
Dunoyer De Segonzac, G. (1970). The transformation of clay minerals during diagenesis and low-grade metamophism: a review. Sedimentology, 15, 282–346.
Dunoyer De Segonzac, G., & Bernoulli, D. (1976). Diagenèse et métamorphisme des argiles dans le Rhétien Sudalpin et Austroalpin (Lombardie et Grisons). Bulletin Société géologique de France, 7, 18(5), 1283–1293.
Dunoyer De Segonzac, G., Ferrero, J., & Kübler, B. (1968). Sur la cristallinité de l’illite dans la diagénèse et l’anchimétamorphisme. Sedimentology, 10, 137–143.
Eberl, D. D., & Środoń, J. (1988). Ostwald ripening and interparticle-diffraction effects for illite crystals. American Mineralogist, 73, 1335–1345.
Elliot, E. C., Edenfield, A. M., Wampler, J. M., Matsoff, G., & Long, Ph E. (1999). The kinetics of the smectite to illite transformation in Cretaceous bentonites, Cerro Negro, New Mexico. Clays and Clay Minerals, 47(3), 286–296.
Erdelbrock, K. (1994). Diagenese und schwache Metamorphose im Helvetikum der Ostschweiz (Inkohlung und Illit-“Kristallinität”). Ph.D. dissertation, Germany: RWTH Aachen.
Ernst, W.G., & Ferreiro Mählmann, R (2004). Vitrinite alteration rate as a function of temperature, time, starting material, aqueous fluid pressure, and oxygen fugacity—Laboratory corroboration of prior work. In R.J. Hill, J. Leventhal, M.J. Aizenshtat, G. Baedecker, G. Claypool, R. Eganhouse, M.Goldhaber & K. Peters (Eds.), Geochemical Investigations in Earth and Space Sciences: A Tribute to Isaac R. Kaplan (pp. 341–357). The Geochemical Society, Publication, 9.
Esquevin, J. (1969). Influence de la composition chimique des illites sur la cristallinité. Bulletin du Centres de Recherche de Pau., S.N.P.A., 3/1, 147–154.
Essene, E. J., & Peacor, D. R. (1995). Clay Mineral thermometry; a critical perspective. Clays and Clay Minerals, 43, 540–553.
Ferreiro Mählmann, R. (1994). Zur Bestimmung von Diagenesehöhe und beginnender Metamorphose—Temperaturgeschichte und Tektogenese des Austroalpins und Süpenninikums in Vorarlberg und Mittelbünden. Ph.D. dissertation, Frankfurter geowissenschaftliche Arbeiten, Serie C, 14: University of Frankfurt.
Ferreiro Mählmann, R. (1995). Das Diagenese-Metamorphose-Muster von Vitrinitreflexion und Illit-“Kristallinität” in Mittelbünden und im Oberhalbstein. Teil 1: Bezüge zur Stockwerktektonik. Schweizerische Mineralogische und Petrographische Mitteilungen, 75(1), 85–122.
Ferreiro Mählmann, R. (1996). Das Diagenese-Metamorphose-Muster von Vitrinitreflexion und Illit-“Kristallinität” in Mittelbünden und im Oberhalbstein. Teil 2: Korrelation kohlenpetrographischer und mineralogischer Parameter. Schweizerische Mineralogische und Petrographische Mitteilungen, 76(1), 23–47.
Ferreiro Mählmann, R. (2001). Correlation of very low-grade data to calibrate a thermal maturity model in a nappe tectonic setting, a case study from the Alps. Tectonophysics, 334, 1–33.
Ferreiro Mählmann, R., & Frey, M. (2012). Standardisation, calibration and correlation of the Kübler-Index and the vitrinite/bituminite reflectance: an inter-laboratory and field related study. Swiss Journal of Geosciences (this issue).
Ferreiro Mählmann, R., & Giger, M. (2012). The Arosa zone in Eastern Switzerland: Oceanic, syn-sedimentary, accretional and orogenic very low-grade patterns in a tectono-metamorphic mélange. Swiss Journal of Geosciences (this issue).
Ferreiro Mählmann, R., Petrova, T., Pironon, J., Stern, W. B., Ghanbaja, J., Dubessy, J., & Frey, M. (2002). Transmission electron microscopy study of carbonaceous material in a metamorphic profile from diagenesis to amphibolite facies (Bündnerschiefer, Eastern Switzerland). In: S.Th. Schmidt & R. Ferreiro Mählmann (Eds.) Diagenesis and low grade metamorphism. Schweizerische Mineralogische und Petrographische Mitteilungen, 82(2), 253–272.
Flehmig, W. (1973). Kristallinität und Infrarotspektroskopie natürlicher dioktaedrischer Illite. Neues Jahrbuch Mineralogischer Monatshefte, 1973(3), 351–361.
Flehmig, W., & Gehlken, P. L. (1989). Zum Seladonitmolekül in Illiten paläozoischer Sedimente, seiner genetischen Beziehung und mineralogischen Auswirkumg. Zeitschrift Deutsche Geologische Gesellschaft, 140, 343–353.
Flehmig, W., & Langheinrich, G. (1974). Beziehung zwischen tektonischer Deformation und Illitkristallinität. Neues Jahrbuch für Geologie und Paläontologie Abhandlungen, 146, 325–326.
Folk, R. L. (1974). Petrology of sedimentary rocks. Austin: Hemphills.
Foscolos, A.E. (1990). Catagenesis of argillaceous sedimentary rocks. In: Diagenesis (pp. 177–188). Geoscience Canada, Reprint Series 4.
Frey, M. (1968). Die Metamorphose des Keupers vom Tafeljura bis zum Lukmanier-Gebiet (Veränderungen tonig-mergeliger Gesteine vom Bereich der Diagenese bis zur Staurolith-Zone). Ph.D. dissertation, Switzerland: University of Bern.
Frey, M. (1969a). Die Metamorphose des Keupers vom Tafeljura bis zum Lukmanier-Gebiet (Veränderungen tonig-mergeliger Gesteine vom Bereich der Diagenese bis zur Staurolith-Zone). Beiträge zur geologischen Karte der Schweiz, 137, Bern.
Frey, M. (1969b). A mixed-layer paragonite/phengite of low grade metamorphic origin. Contributions to Mineralogy and Petrology, 24, 63–65.
Frey, M. (1970). The step from diagenesis to metamorphism in pelitic rocks during Alpine orogenesis. Sedimentology, 15, 261–279.
Frey, M. (1978). Progressiv low-grade metamorphism of a black shale formation, Central Swiss Alps, with special references to pyrophyllite and margarite bearing assemblages. Journal of Petrology, 19, 95–137.
Frey, M. (1986). Very low-grade metamorphism of the Alps an introduction. Schweizerische Mineralogische und Petrographische Mitteilungen, 66(1), 13–27.
Frey, M. (1987a). Low temperature metamorphism. Glasgow and London: Blackie.
Frey, M. (1987b). The reaction-isograd kaolinite + quartz = pyrophyllite + H2O, Helvetic Alps, Switzerland. Schweizerische Mineralogische und Petrographische Mitteilungen, 67(1), 1–11.
Frey, M. (1988). Discontinuous inverse metamorphic zonation, Glarus Alps, Switzerland: evidence from illite “cristallinity” data. Schweizerische Mineralogische und Petrographische Mitteilungen, 68(1), 171–183.
Frey, M., & Burkhard, M. (1992). Mineralogisch-Petrologische Exkursion zur progressiven Alpinen Metamorphose der Zentralalpen. Beihefte zum European Journal of Mineralogy, 4(2), 103–122.
Frey, M., de Capitani, C., & Liou, J. G. (1991). A new perogenetic grid for low-grade metabasites. Journal of Metamorphic Geology, 9, 497–509.
Frey, M., Desmons, J., & Neubauer, F. (1999). Alpine Metamorphic Map 1:500 000. Schweizerische Mineralogische und Petrographische Mitteilungen, 79(1), 1–4.
Frey, M., & Ferreiro Mählmann, R. (1999). Alpine metamorphism of the Central Alps. Schweizerische Mineralogische und Petrographische Mitteilungen, 79(1), 135–154.
Frey, M., Hunziker, C., Roggwiller, P., & Schindler, C. (1973). Progressive niedriggraddige Metamorphose glauconitführender Horizonte in den helvetischen Alpen der Ostschweiz. Contribution to Mineralogy and Petrology, 39, 185–218.
Frey, M., & Niggli, E. (1971). Illit-Kristallinität, Mineralfazien und Inkohlungsgrad. Schweizerische Mineralogische und Petrographische Mitteilungen, 51(1), 229–234.
Frey, M., & Robinson, D. (1999). Low-grade metamorphism. Oxford: Blackwell Science.
Frey, M., Teichmüller, M., Teichmüller, R., Mullis, J., Künzi, B., Breitschmid, A., et al. (1980). Very low-grade metamorphism in external parts of the Central Alps: illite crystallinity, coal rank and fluid inclusion data. Eclogae Geologicae Helvetiae, 73(1), 173–203.
Gaupp, R. H., & Batten, D. J. (1985). Maturation of organic matter in Cretaceous strata of the Northern Calcareous Alps. Neues Jahrbuch für Geologie und Paläontologie Monatshefte, 1985(3), 157–175.
Gautier, D.L. (1986). Roles of organic matter in sediment diagenesis. Society of Economic Paleontologists and Mineralogists, Special Publications 38, Tulsa.
Giorgetti, G., Memmi, I., & Peacor, D. R. (2000). Retarded illite crystallinity caused by streß-induced sub-graine boundaries in illite. Clay Minerals, 35, 693–708.
Grim, R.E. (1953). Clay mineralogy. New York: McGraw-Hill.
Guedes, A., Valentim, B., Prieto, A. C., Rodrigues, S., & Noronha, F. (2010). Micro-Raman spectroscopy of collotelinite, fusinite and macrinite. International Journal of Coal Geology, 83, 415–422.
Guggenheim, S., Bain, D. C., Bergaya, F., Brigatti, M. F., Drits, A., Eberl, D. D., et al. (2002). Report of the AIPEA nomenclature committee for 2001: order, disorder and crystallinity in phyllosilicates and the use of the “Crystallinity Index”. Clay Minerals, 37, 389–393.
Harrassowitz, H. (1927). Anchimetamorphose, das Gebiet zwischen Oberflächen- und Tiefen-Umwandlung der Erdrinde. Berichte Oberhessische Gesellschaft für Natur Heilkunde Giessen, Naturwissenschaften, Abteilung, 12, 9–15.
Herwegh, M., Hürzeler, J. P., Pfiffner, O. A., Schmid, S. M., Abart, R., & Ebert, A. (2008). The Glarus thrust: excursion guide and report of a field trip of the Swiss Tectonic Studies Group (Swiss Geological Society, 14.-16.09.2006). Swiss Journal of Geosciences, 101(2), 323–340.
Hesse, R., & Ogunyomi, O. (1980). Präorogene Versenkungstiefe und Orogenese als Diagenesefaktoren für altpaläozoische Kontinentalrandbildungen der Nördlichen Appalachen in Quebec, Kanada. Geologische Rundschau, 69(2), 546–566.
Hillier, S., Mátyás, J., Matter, A., & Vasseur, G. (1995). Illite/smectite diagenesis and its variable correlation with vitrinite reflectance in the Pannonian basin. Clays and Clay Minerals, 43(2), 174–183.
Hoefs, J., & Frey, M. (1976). The isotopic composition of carbonaceous matter in a metamorphic profile from the Swiss Alps. Geochimica et Cosmochimica Acta, 40, 945–951.
Huang, W. L., Longo, J. M., & Pevear, D. R. (1993). An experimentally derived kinetic model for smectite-to illite conversion and it use as a geothermometer. Clays and Clay Minerals, 41(2), 162–177.
Hunziker, J. C., Frey, M., Clauer, N., Dallmeyer, R. D., Friedrichsen, H., Flehmig, W., et al. (1986). The evolution of illite to muscovite: mineralogical and isotopic data from the Glarus Alps, Switzerland. Contributions to Mineralogy and Petrology, 92, 157–180.
Hürzeler, J. P., & Abart, R. (2008). Fluid flow and rock alteration along the Glarus thrust. Swiss Journal of Geosciences, 101(2), 251–268.
Hutcheon, I.E. (1989). Short course in burial diagenesis. Short course handbook (vol. 15). Montreal: Mineralogical Association Canada.
Issler, D. R. (1984). Calculation of organic maturation levels for offshore eastern Canada—Implications for general application of Lopatin’s method. Canadian Journal of Earth Sciences, 21, 477–488.
Jaboyedoff, M., Kübler, B., Stadelmann, P., & Thélin, P. (2001). An attempt to correlate HRTEM and XRD determination of coherent scattering domain size of illite-smectite interstratification using «illite crystallinity». Bulletin de Géologie de l’Université de Lausanne, Bulletin de la Société Vaudoise des Sciences Naturelles, 87(4), 305–319.
Jaboyedoff, M., Kübler, B., & Thélin, P. (1999). An empirical Scherrer equation for weakly swelling mixed-layer minerals, especially illite-smectite. Clay Minerals, 34, 601–617.
Jaboyedoff, M., & Thélin, P. (1996). New data on the low-grade metamorphism in the Briançonnais domain of the Prealps, western Switzerland. European Journal of Mineralogy, 8, 577–592.
Jaboyedoff, M., & Thélin, P. (2002). PATISSIER: software to estimate the smectite content and number of consecutive illite layers in mixed-layer illite-smectite using illite-crystallinity data. In: S.Th. Schmidt & R. Ferreiro Mählmann (Eds.) Diagenesis and low grade metamorphism. Schweizerische Mineralogische und Petrographische Mitteilungen, 82(2), 221–228.
Jasmund, K. (1951). Die silikatischen Tonminerale (2nd. ed., 1955). Weinheim: Verlag Chemie.
Jasmund, K., & Lagaly, G. (1993). Tonminerale und Tone. Darmstadt: Steinkopff.
Jiang, W. T., Peacor, D. R., Árkai, P., Toth, M., & Kim, J. W. (1997). TEM and XRD determination of crystallite size and lattice strain as a function of illite crystallinity in pelitic rocks. Journal of Metamorphic Geology, 15, 267–281.
Judik, K., Rantitsch, G., Rainer, T. M., Árkai, P., & Tomljenović, B. (2008). Alpine metamorphism of organic matter in metasedimentary rocks from Mt. Medvednica (Croatia). Swiss Journal of Geosciences, 101(3), 605–616.
Kahr, G., Frey, M., & Madsen, F. T. (1996). Thermoanalytical dehydroxylation of clays and combustion of organic compounds in a prograde metamorphic Liassic black shale formation, Central Swiss Alps. Schweizerische Mineralogische und Petrographische Mitteilungen, 76(1), 165–173.
Kisch, H. J. (1966a). Zeolite facies and regional rank of bituminuous coal. Geological Magazine, 103, 414–422.
Kisch, H. J. (1966b). Carbonization of semi-anthracitic vitrinite by an analcime basanite sill. Economic Geology, 61, 1043–1063.
Kisch, H. J. (1968). Coal rank and lowest grade regional metamorphism in the southern Bowen Basin, Queensland, Australia. Geologie en Mijnbouw, 47, 28–36.
Kisch, H.J. (1969). Coal-rank and burial metamorphic mineral facies (pp. 407–424). In P.A. Schenck, & I. Havenaar (Eds.), Advances in Organic Geochemistry, 1968: Oxford: Pergamon Press.
Kisch, H.J. (1974). Anthracite and meta-anthracite cola ranks associated with “anchimetamorphism“ and “very-low-stage“ metamorphism. I, II, III. Proc K Ned Akad Wet, Amsterdam, Ser. B, 77(2), 81–118.
Kisch, H. J. (1980a). Illite cristallinity and coal rank associated with lowest-grade metamorphism of Taveyanne greywacke in the Helvetic zone of the Swiss Alps. Eclogae Geologicae Helvetiae, 73, 753–777.
Kisch, H. J. (1980b). Incipient metamorphism of Cambro-Silurian clastic rocks from the Jamtland Supergroup, central Scandinavian Caledonides, western Sweden: illite crystallinity and ‘vitrinite’ reflectance. Journal of the Geological Society, London, 137, 271–288.
Kisch, H. J. (1987). Correlation between indicators of very low grade metamorphism. In M. Frey (Ed.), Low temperature metamorphism (pp. 227–300). Glasgow: Blackie.
Kisch, H.J. (1989). Discordant relationship between degree of very low-grade metamorphism and the development of slaty cleavage. In. J.S. Daly, R.A. Cliff & B.W.D. Yardles (Eds.), Evolution of metamorphic belts (pp. 173–185). London: Geological Society Special Publication London, 43.
Kisch, H. J. (1991). Illite crystallinity: recommendations on sample preparation, X-ray diffraction settings, and interlaboratory samples. Journal of Metamorphic Geology, 9, 665–670.
Kisch, H. J., Árkai, P., & Brime, C. (2004). On the calibration of the illite Kübler-Index (illite „crystallinity”). Schweizerische Mineralalogische und Petrographische Mitteilungen, 84(2), 323–331.
Kisch, H. J., & Frey, M. (1987). Appendix: Effect of sample preparation on the measured 10 Å peak width of illite (illite-“crystallinity”). In M. Frey (Ed.), Low temperature metamorphism (pp. 302–304). Glasgow: Blackie.
Kisch, H.J., & Nijman, W. (2010). Metamorphic grade and gradient from white K-mica bearing sedimentary rocks in the Mosquito Creek Basin, east Pilbara Craton, western Australia. Precambrian Research, 176(1–4), 11–26.
Koch, J. (1989). Inkohlung durch Reibungswärme im Ölschiefer von Schandelah. Erdöl & Kohle-Erdgas-Petrochemie-Hydrocarbontechnologi, 42, 485–488.
Kossovskaya, A. G., Logvinenko, N. V., & Shutov, V. D. (1957). Stages of formation and alteration in terrigenous rocks (in Russian). Doklady Akademii Nauk SSSR, 116(2), 293–296.
Kossovskaya, A. G., & Shutov, V. D. (1961). The correlation of zones of regional epigenesist and metagenesis in terrigenous and volcanic rocks. Doklady Akademii Nauk SSSR, 139(3), 732–736.
Kossovskaya, A. G., & Shutov, V. D. (1963). Facies of regional epigenesis and metagenesis. Translation in: International Geology Review, 7(1965), 1157–1167.
Kossovskaya, A. G., & Shutov, V. D. (1970). Main aspects of the epigenesis problem. Sedimentology, 15, 11–40.
Krumm, H. (1984). Anchimetamorphose im Anis und Ladin (Trias) der Nördlichen Kalkalpen zwischen Arlberg und Kaisergebirge—ihre Verbreitung und deren baugeschichtliche Bedeutung. Geologische Rundschau, 73(1), 223–257.
Krumm, H., Petschick, R., & Wolf, M. (1988). From diagenesis to anchimetamorphism, Upper Austroalpine sedimentary cover in Bavaria and Tyrol. Geodinamica Acta, 2, 33–47.
Kübler, B. (1964). Les argiles, indicateurs de métamorphisme. Revue de l’Institut Français du Pétrole, 19, 1093–1112.
Kübler, B. (1967). La cristallinité de l’illite et les zones tout à fait supérieures du métamorphisme. Etages tectoniques. Colloques Neuchâtel, 18–21 avril 1967, 105–122.
Kübler, B. (1968). Evaluation quantitative du métamorphisme par la cristallinité de l’illite. Bulletin Centre Recherche Pau, S.N.P.A., 2, 385–397.
Kübler, B. (1984). Les indicateurs des transformations physiques et chimiques dans la diagénèse. Température et calorimétrie. In: Lagache, M. (Ed.). Thermométrie et barométrie géologiques. Société Francaise de minéralogie et de cristallographie, 2, 489–59.
Kübler, B. (1990). “Cristallinity” de l’illite et mixed-layer: brève révision. Schweizerische Mineralogische und Petrographische Mitteilungen, 70(1), 89–93.
Kübler, B., Betrixe, M.A., & Monnier, F. (1979a). Les premiers stades de la diagénèse organique et la diagénèse minérale: une tentative d’équivalence. 1ère partie: zonéographie par la maturation de la matière organique. Bulletin der Vereinigung Schweizerischer Petroleumgeologen. und Petroleumingenieure. 45/108, 1–22.
Kübler, B., & Jaboyedoff, M. (2000). Illite Cristallinity. Comptes rendus de l’Académie des Sciences Paris Série II, 331, 75–89.
Kübler, B., Pittion, J.-L., Héroux, Y., Charollais, J., & Weidmann, M. (1979b). Sur le pouvoir réflecteur de la vitrinite dans quelques roches du Jura, de la Molasse et des Nappes préalpines, helvétiques et penniques. Eclogae Geologicae Helvetiae, 72(2), 347–373.
Lanson, B. (1997). Decomposition of experimental X-ray diffraction patterns (profile fitting): a convenient way to study clay minerals. Clays and Clay Minerals, 45, 132–146.
Lanson, B., & Kübler, B. (1994). Experimental determination of coherent scattering domain size distribution of natural mica-like phases with the Warren-Averbach technique. Clays and Clay Minerals, 42, 489–494.
Larsen, G., & Chillingar, G. V. (1983). Diagenesis in sediments and sedimentary rocks (25A, 572 pp; 25B 579 pp). Amsterdam: Developments in Sedimentology, Elsevier.
Le Bayon, R. (2012). Laboratory organic matter maturation at high pressures: Heat-up effect on vitrinite reflectance. Swiss Journal of Geosciences (this issue).
Le Bayon, R., Adam, Ch., & Ferreiro Mählmann, R. (2012a). Experimentally determined pressure effects on vitrinite reflectance at 450 °C. International Journal of Coal Geology, 92, 69–81.
Le Bayon, R., Brey, G., Ernst, W. G., & Ferreiro Mählmann, R. (2007). Experimental kinetic study of carbonaceous material maturation: an appraisal of pressure and time effects on vitrinite reflectance at 400 °C. Geochimica Cosmochimica Acta, 71, 552.
Le Bayon, R., Brey, G. P., Ernst, W. G., & Ferreiro Mählmann, R. (2011). Experimental kinetic study of organic matter maturation: Time and pressure effects on vitrinite reflectance at 400 °C. Organic Geochemistry, 42, 340–355.
Le Bayon, R., Buhre, St, Schmidt, B. C., & Ferreiro Mählmann, R. (2012b). Experimental organic matter maturation at 2 kbar: Heat-up effect to low temperatures on vitrinite reflectance. International Journal of Coal Geology, 92, 45–53.
Leeder, M.R. (1995). Sedimentology, process and product. London: Chapman and Hall.
Levine, J. R., & Davis, A. (1989). Reflectance anisotropy of Upper Carboniferous coals in the Appalachian foreland basin, Pennsylvania, U.S.A. International Journal of Coal Geology, 13, 314–373.
Liou, J. G., de Capitani, C., & Frey, M. (1991). Zeolite equilibria in the system CaAl2Si2O8–NaAlSi3O8–SiO2–H2O. New Zealand Journal of Geology and Geophysics, 34, 293–301.
Liou, J. G., Shigenori, M., & Moonsup, C. (1987). Very-low grade metamorphism of volcanic and volcanoclastic roccks—Mineral assemblages and mineral facies. In M. Frey (Ed.), Low temperature metamorphism (pp. 59–113). Glasgow: Blackie.
Littke, R. (1993). Deposition, diagenesis and weathering of organic matter-rich sediments. Lecture Notes in Earth Sciences (vol. 47).
Littke, R., Urai, J. L., Uffmann, A. K., & Risvanis, F. (2012). Reflectance of dispers vitrinite in Palaeozoic rocks with and without cleavage: Implications for burial and thermal history modelling in the Devonian of Rursee area, northern Rhenish Massif, Germany. International Journal of Coal Geology,. doi:10.1016/j.coal.2011.07.006.
Logvinenko, N. V. (1956). On the late diagenesis (epigenesis) of Carboniferous rocks of the Donbass (in Russian). Akademii Nauk SSSR Doklady, 106(5), 889–892.
Lopatin, N. V. (1971). Temperature and geologic time as factors in coalification (in Russian). Izvestiya Akademii Nauk SSSR Seriya Geologicheskaya, 3, 95–106.
Mancktelow, N. S. (1985). The Simplon line: a major displacement zone in the western Lepontine Alps. Eclogae Geologicae Helvetiae, 78(1), 73–96.
Mancktelow, N. S. (1990). The Simplon fault zone. Beiträge zur Geologischen Karte der Schweiz. Neue Folge, 163, 1–74.
McIlreath, I.A., & Morrow, D.W. (1990). Diagenesis. Geoscience Canada, reprint series (vol. 4). The Runge Press, Ottawa.
Meister, P. (1999). Zur Geologie der südwestlichen Ducankette zwischen Kleinducan und Alp Darlux (Graubünden, Schweiz). Unpublished diploma thesis, ETH Zürich.
Merriman, R. J. (1991). Very low-grade metamorphism. Journal of Metamorphic Geology, Special Issue, 9(6), 663–790.
Merriman, R. J., & Frey, M. (1999). Patterns of very low-grade metamorphism in metapelitic rocks. In M. Frey & D. Robinson (Eds.), Low-grade metamorphism (pp. 61–107). Oxford: Blackwell Science.
Merriman, R. J., & Peacor, D. R. (1999). Very low-grade metapelites: mineralogy, microfabrics and measuring reaction progress. In M. Frey & D. Robinson (Eds.), Low-grade metamorphism (pp. 10–60). Oxford: Blackwell Science.
Merriman, R. J., Roberts, B., & Peacor, D. R. (1990). A transmission electron microscope study of white mica crystallite size distribution in a mudstone to slate transitional sequence, North Wales, UK. Contributions to Mineralogy and Petrology, 106, 27–40.
Merriman, R. J., Roberts, B., Peacor, D. R., & Hirons, S. R. (1995). Strain-related differences in the crystal growth of white mica and chlorite: a TEM and XRD study of the development of metapelitic microfabrics in the Southern Uplands thrust terrane, Scotland. Journal of Metamorphic Geology, 13, 559–576.
Millot, P.G. (1970). Géologie des argiles altérations, sédimentologie, géochimie. Paris: Masson et Cie.
Morrow, D.W., & Issler, D.R. (1993). Calculation of vitrinite reflectance from thermal histories: a comparison of some methods. American Association of Petroleum Geologists Bulletin, 77(4), 610–624.
Mosar, J. (1988). Métamorphisme transporté dans les Préalpes. Schweizerische Mineralogische und Petrographische Mitteilungen, 68(1), 77–94.
Mullis, J., Rahn, M. K., Schwer, P., de Capitani, C., Stern, W. B., & Frey, M. (2002). Correlation of fluid inclusion temperatures with illite “crystallinity” data and clay mineral chemistry in sedimentary rocks from the external part of the Central Alps. In: S.Th. Schmidt & R. Ferreiro Mählmann (Eds.) Diagenesis and low grade metamorphism. Schweizerische Mineralogische und Petrographische Mitteilungen, 82(2), 325–340.
Naesser, N.D., & McCulloh, T.H. (1989). Thermal history of sedimentary basins. Berlin: Springer.
Nieto, F., & Sanchez-Navas, A. (1994). A comparative XRD and TEM study of the physical meaning of the white mica «crystallinity» index. European Journal of Mineralogy, 6, 611–621.
Nievergelt, P., Liniger, M., Froitzheim, N., & Ferreiro Mählmann, R. (1996). Early to Mid Tertiary crustal extension in the Central Alps: The Turba Mylonite Zone. (Eastern Switzerland). Tectonics, 15(2), 329–340.
Niggli, E. (1960). Mineral-Zonen der alpinen Metamorphose in den Schweizer Alpen. International Geological Congress 21st., Copenhagen, 1960, part 13, pp. 132–138.
Niggli, E., & Zwart, H.J. (1973). Metamorphic map of the Alps, scale 1:1 000 000. Subcommission for the cartography of the metamorphic belts of the world. Sheet 17 of the metamorphic map of Europe. Paris: Leiden/UNESCO.
Oberhänsli, R., Bousquet, R, Engi, M., Goffé, B., Gosso, G., Handy, M., Häck, V., Koller, F., Lardeaux, J.M., Polino, R., Rossi, P., Schuster, R., Schwartz, S., & Spalla, M.I. (2004). Explanatory note to the map «metamorphic structure of the Alps, 1: 1’000’000». Mitteilungen der Österreichischen Mineralogischen Gesellschaft, 149.
Oltz, F. (1978). Syposium in geochemistry: Low temperature metamorphism of kerogen and clay minerals. Los Angeles: The Pacific Section Society of Economic Paleontologists and Mineralogists.
Pagel, M., Braun, J. J., Disnar, J. R., Martinez, L., Renac, Ch., & Vasseur, G. (1997). Thermal history constraints from studies of organic matter, clay minerals, fluid inclusions, and apatite fission tracks at the Ardeche paleo-margin (BA1 drill hole, GPF Program), France. Journal of Sedimentary Research, 67(1), 235–245.
Paproth, E., & Wolf, M. (1973). Zur paläogeographischen Deutung der Inkohlung im Devon und Karbon des nördlichen Rheinischen Schiefergebirges. Neues Jahrbuch für Geologie und Paläontologie Monatshefte, 1, 469–493.
Parker, A., & Sellwood, B.W. (1983). Sediment diagenesis. Dordrecht: D. Reidel.
Petmecky, S., Meier, L., Reiser, H., & Littke, R. (1999). High thermal maturity in the Lower Saxony Basin: intrusion or deep burial? Tectonophysics, 304, 317–344.
Petrova, T. V., Ferreiro Mählmann, R., Stern, W. B., & Frey, M. (2002). Application of combustion and TGA-DTA analysis to the study of metamorphic organic matter. Schweizerische Mineralogische und Petrographische Mitteilungen, 82(1), 33–53.
Petschick, R. (1989). Zur Wärmegeschichte im Kalkalpin Bayerns und Nordtirols (Inkohlung und Illit-Kristallinität). Ph.D. dissertation, Frankfurter geowissenschaftliche Arbeiten, Serie C, 10, University Frankfurt.
Pettijohn, F.J., Potter, P.E., & Siever, R. (1972). Sand and sandstone. New York: Springer.
Potel, S., Ferreiro Mählmann, R., Stern, W. B., Mullis, J., & Frey, M. (2006). Very low-grade metamorphic evolution of pelitic rocks under high-pressure/low-temperature conditions, NW New Caledonia (SW Pacific). Journal of Petrology, 47, 991–1015.
Potel, S., & Trullenque, G. (2012). Very low-grade metamorphism in the para-autochtonous sedimentary cover of the Pelvoux massif (Western Alps, France) (this issue).
Price, L. C. (1983). Geologic time as a parameter in organic metamorphism and vitrinite reflectance as an absolute paleogeothermometer. Journal of Petroleum Geology, 6, 5–38.
Quirico, E., Montagnac, G., Rouzaud, J.-N., Bonal, L., Bourot-Denise, M., Duber, S., et al. (2009). Precursor and metamorphic condition effects on Raman spectra of poorly ordered carbonaceous matter in chondrites and coals. Earth and Planetary Science Letters, 287, 185–193.
Rahl, J. M., Anderson, K. M., Brandon, M. T., & Fassoulas, C. (2005). Raman spectroscopic carbonaceous material thermometry of low-grade metamorphic rocks: Calibration and application to tectonic exhumation in Crete, Greece. Earth and Planetary Science Letters, 240, 339–354.
Rahn, M.K. (1994). Incipient metamorphism of the Glarus Alps: Petrology of the Taveyanne greywacke and fission track dating. Ph.D. dissertation, Switzerland: University of Basel.
Rahn, M. K., Hurford, A. J., & Frey, M. (1997). Rotation and exhumation of a thrust plane: Apatite fission-track data from the Glarus thrust, Switzerland. Geology, 25(7), 599–602.
Rahn, M. K., Mullis, J., Erdelbrock, K., & Frey, M. (1994). Very low-grade metamorphism of the Taveyanne greywacke, Glarus Alps, Switzerland. Journal of Metamorphic Geology, 12, 625–641.
Rahn, M. K., Mullis, J., Erdelbrock, K., & Frey, M. (1995). Alpine metamorphism in the North Helvetic flysch of the Glarus Alps, Switzerland. Eclogae Geologicae Helvetiae, 88(1), 157–178.
Rahn, M. K., Steinmann, M., & Frey, M. (2002). Cloritoid composition and formation in the eastern Central Alps: A comparison between Penninic and Helvetic occurences. In: S.Th. Schmidt & R. Ferreiro Mählmann (Eds.) Diagenesis and low grade metamorphism. Schweizerische Mineralogische und Petrographische Mitteilungen, 82(2), 253–272.
Ramdohr, P. (1928). Mikroskopische Beobachtungen an Graphiten und Koksen. Archiv für Eisenhüttenwesen, 1, 669–672.
Rantitsch, G. (1997). Thermal history of the Carnic Alps (Southern Alps, Austria) and its palaeogeographic implications. Tectonophysics, 272, 213–232.
Rantitsch, G., Grogger, W., Teichert, C., Ebner, F., Hofer, C., Mauer, E. M., et al. (2004). Conversion of carbonaceous material to graphite within the Greywacke Zone of the Eastern Alps. International Journal of Earth Sciences, 93, 959–973.
Reinhardt, M. (1991). Vitrinite reflectance, illite-crystallinity and tectonics: results from the Northern Appennines (Italy). Organic Geochemistry, 17(2), 175–184.
Ritter, U. (1984). The influence of time and temperature on vitrinite reflectance. Organic Geochemistry, 6(4), 473–480.
Robert, P. (1988). Organic metamorphism and geothermal history—Microscopic study of organic matter and thermal evolution of sedimentary basins. Nordrecht: Elf-Aqitaine & D. Reidel Publication company.
Ross, J.V., & Bustin, R.M. (1990). The role of strain energy in creep graphitization of anthracite. Nature, 343(6253), 58.
Rybach, L., Mueller, S., Milnes, A. G., Ansorge, J., Bernoulli, D., & Frey, M. (1980). The Swiss Geotraverse Basel-Chiasso—A review. Eclogae Geologicae Helvetiae, 73(2), 437–462.
Schaer, J. P., & Persoz, P. (1976). Aspects structuraux et pétrographiques du Haut Atlas calcaire de Midelt (Maroc). Bulletin de la Société Géologique de France, 18, 1239–1250.
Schegg, R. (1993). Thermal maturity and history of sediments in the North Alpine Foreland Basin (Switzerland, France). Ph.D. dissertation, Switzerland: Université de Genève, Thèse N° 2612.
Schegg, R. (1994). The coalification profile of the well Weggis (Subalpine Molasse, Central Switzerland): implications for erosion estimates and the palaeogeothermal regime in the external part of the Alps. Bulletin of the Swiss Association of Petroleum Geologists and Engineers, 61/136, 57–67.
Scherrer, P. (1918). Bestimmung der Grösse und der inneren Struktur von Kolloidteilchen mittels Röntgenstrahlen. Nachrichten der Gesellschaft für Wissenschaft, Göttingen, 26, 98–100.
Schmid, S. M. (1975). The Glarus overthrust; field evidences and mechanical model. Eclogae Geologicae Helvetiae, 68(2), 247–280.
Schmid, S. M., Fügenschuh, B., Kissling, E., & Schuster, R. (2004). Tectonic map and overall architecture of the Alpine orogen. Eclogae Geologicae Helvetiae, 97(1), 93–117.
Schmid, S. M., Pfiffner, O. A., Froitzheim, N., Schönborn, G., & Kissling, E. (1996). Geophysical-geological transect and tectonic evolution of the Swiss-Italien Alps. Tectonics, 15, 1036–1064.
Schmidt, S. Th., & Ferreiro Mählmann, R. (Eds.) (2002). Diagenesis and low-grade metamorphism. Schweizerische Mineralogische und Petrographische Mitteilungen, 82(2), 147–426.
Schmidt, D., Livi, K. J. T., & Frey, M. (1999). Reaction progress in chloritic minerals: an electon microbeam study of Tavayanne greywacke, Switzerland. Journal of Metamorphic Geology, 17, 229–241.
Schmidt, D., Schmidt, S Th, Mullis, J., Ferreiro Mählmann, R., & Frey, M. (1997). Very low-grade metamorphism of the Taveyanne formation of western Switzerland. Contribution to Mineralogy and Petrology, 129, 385–403.
Schönherr, J., Littke, R., Urai, J. L., Kukla, P. A., & Rawahi, Z. (2007). Polyphase thermal evolution in the Infra-Cambrian Ara Group (South Oman Salt Basin) as deduced by solid bitumen maturity. Organic Geochemistry, 38(8), 1293–1318.
Schönherr, J., Scheuvens, D., Thöni, M., & Ferreiro Mählmann, R. (2004). Possible shear heating at a basement-cover tectonic contact: The Ortles shear zone (Southern Tyrol/Italy). RST-GV meeting Strasbourg 2004, RSTGV-Abstract-00276 (vol. 18).
Schramm, J. M. (1977). Über die Verbreitung epi- und anchimetamorpher Sedimentgesteine in der Grauwackenzone und in den Nördlichen Kalkalpen (Österreich)—Ein Zwischenbericht. Geologische-paläontogische Mitteilung Innsbruck, 7, 3–20.
Sharp, Z. D., Frey, M., & Livi, K. J. T. (1995). Prograde metamorphic stable isotope variations (H, C, O) in a Triassic redbed formation, Central Swiss Alps. Schweizerische Mineralogische und Petrographische Mitteilungen, 75(1), 147–161.
Shelley, D. (1995). Igneous and metamorphic rocks under the microscope. (2nd ed., 1992), reprint 1995. London: Chapman and Hall.
Smykatz-Kloss, W., & Althaus, E. (1974). Experimental investigation of the temperature dependence of the “crystallinity” of illites and glauconites. Bulletin Groupe français des Argiles, 26, 319–325.
Środoń, J. (1979). Correlation between coal and clay diagenesis in the Carboniferous of the Upper Silesian Coal Basin. In M.M. Mortland & V.C. Farmer (Eds.), Proceedings International Clay Conference, Oxford, 1978 (pp. 251–260). Amsterdam: Elsevier.
Środoń, J., Andreoli, C., Elsass, F., & Robert, M. (1990). Direct high-resolution transmission electron microscopic measurement of expandability of mixed-layer illite/smectite in bentonite rock. Clays and Clay Minerals, 38, 373–379.
Środoń, J., Elsass, F., McHardy, W. J., & Morgan, D. J. (1992). Chemistry of illite-smectite inferred from TEM measurements of fundamental particles. Clay Minerals, 27, 137–158.
Stach, E. (1935). Lehrbuch der Kohlenpetrographie. Berlin: Bornträger.
Stach, E., Mackowsky, M.Th., Teichmüller R, M., Taylor, G.H., Chandra, D., & Teichmüller, R. (1971, 1982). Textbook of Coal Petrology (538 pp, 3rd ed.). 1st. and 3rd. edns. Stuttgart: Bornträger,,
Steck, A. (2008). Tectonics of the Simplon massif and Lepontine gneiss dome: deformation structures due to collision between the understhrusting European plate and the Adriatic indenter. Swiss Journal of Geosciences, 101(2), 515–546.
Stern, W. B., Mullis, J., Rahn, M., & Frey, M. (1991). Deconvolution of the first “illite” basal reflection. Schweizerische Mineralogisch Petrographische Mitteilungen, 71(3), 453–462.
Suchý, V. (2000). Illite crystallinity and vitrinite reflectance in Paleozoic siliciclastics in the SE Bohemian massif as evidence of thermal history—Discussion and reply. The relationship between illite crystallinity and vitrinite reflectance: What is behind it? Geologica Carpathica, 51(3), 209–214.
Suchý, V., Frey, M., & Wolf, M. (1997). Vitrinite reflectance and shear-induced graphitization in orogenic belts: A case study from the Kandersteg area, Helvetic Alps, Switzerland. International Journal of Coal Geology, 34, 1–20.
Sweeney, J. J., & Burnham, A. K. (1990). Evaluation of a simple model of vitrinite reflectance based on chemical kinetics. American Association of Petroleum Geologists Bulletin, 74(10), 1559–1570.
Taylor, G. H., Teichmüller, M., Davies, A., Diessel, C. F. K., Littke, R., & Robert, P. (1998). Organic petrology. Berlin: Gebrüder Bornträger.
Teichmüller, M. (1987). Organic material and very low-grade metamorphism. In M. Frey (Ed.), Low temperature metamorphism (pp. 114–161) Glasgow and London: Blacky.
Teichmüller, M., & Teichmüller, R. (1954). Die stoffliche und strukturelle Metamorphose der Kohle. Geologische Rundschau, 42, 265–296.
Teichmüller, M., & Teichmüller, R. (1966). Die Inkohlung im saar-lothringer Karbon, verglichen mit der im Ruhrkarbon. Zeitschrift der Deutschen Geologischen Gesellschaft, 117, 243–279.
Teichmüller, M., Teichmüller, R., & Weber, K. (1979). Inkohlung und Illit-Kristallinität—Vergleichende Untersuchungen im Mesozoikum und Paläozoikum von Westfalen. Fortschritte in der Geologie von Rheinland und Westfalen, 27, 201–276.
Thum, I., & Nabholz, W. (1972). Zur Sedimentologie und Metamorphose der penninischen Flysch- und Schieferabfolgen im Gebiet Prättigau-Lenzerheide-Oberhalbstein. Beiträge zur geologischen Karte der Schweiz, [N.F.] 144, 1–55.
Todorov, I., Schegg, R., & Wildi, W. (1993). Thermal maturity and modelling of Mesozoic and Cenozoic sediments in the south of the Rhine Graben and the Eastern Jura (Switzerland). Eclogae Geologicae Helvetiae, 86(3), 667–692.
Treloar, P.J., & O’Brien, P.J. (1998). What drives metamorphism and metamorphic reactions? London: Geological Society. Special Publications 138.
Turner, F.J. (1968). Metamorphic petrology: Mineralogical and field aspects. New York: McGraw-Hill.
Underwood, M.B., Brocculeri, T., Bergfeld, D., Howell, D.G., & Pawlewicz, M. (1992). Statistical comparison between illite crystallinity and vitrinite reflectance, Kandik region of East-Central Alaska. In: D.C. Bradley & C. Dusel-Bacon (Eds.) Geologic studies in Alaska by the U.S. Geological Survey 1991. USGS Bulletin, 2041, pp. 222–237.
Underwood, M.B., Laughland, M.M., Wiley, T.J., & Howell, D.G. (1989). Thermal maturity and organic geochemistry of the Kandic basin region, East-Central Alaska. Open-File Report, Department of the interior U.S.Geological Survey, pp. 89–353.
Underwood, M. B., Laughland, M. M., Wiley, T. J., & Howell, D. G. (1991). Correlation among paleotemperature indicators within orogenic belts: Examples from pelitic rocks of the Franciscan Complex (California), the Shimanto Belt (Japan), and the Kandik Basin (Alaska). EOS, 72, 549.
Uzarowicz, Ł., Skiba, S., Skiba, M., & Šegvić, B. (2011). Clay-mineral formation in soils developed in the weathering zone of pyrite-bearing schists: A case study from the abandoned pyrite mine in Wiesciszowice, Lower Silesia, SW Poland. Clays and Clay Minerals, 59, 581–594.
Velde, B. (1995). Origin and mineralogy of clays. Berlin: Springer.
Velde, B., & Vasseur, G. (1992). Estimation of the diagenetic smectite to illite transformation in time-temperature space. American Mineralogist, 77, 967–976.
Wang, H., Frey, M., & Stern, W. B. (1996). Diagenesis and metamorphism of clay minerals in the Helvetic Alps of eastern Switzerland. Clays and Clay Minerals, 44(1), 96–112.
Wang, H., Stern, W. B., & Frey, M. (1995). Deconvolution of the X-ray “illite” 10 Å complex: a case study of Helvetic sediments from eastern Switzerland. Schweizerische Mineralogisch Petrographische Mitteilungen, 75(2), 187–199.
Waples, D. W. (1980). Time and temperature in petroleum formation: Application of Lopatin’s Method to petroleum exploration. American Association of Petroleum Geologists Bulletin, 64(6), 916–926.
Waples, D. W., Kamata, H., & Suizu, M. (1992). The art of maturity modeling Part 1: finding a satisfactory geologic model. American Association of Petroleum Geologists Bulletin, 76(1), 31–46.
Warr, L. N., & Nieto, F. (1998). Crystallite thickness and defect density of phyllosilicates in low temperature metamorphic pelites: a TEM and XRD study of clay-mineral crystallinity-index standards. Canadian Mineralogist, 36, 1453–1474.
Warr, L.N., & Peacor, D.R. (2002). Evaluation of X-ray diffraction methods for determining the crystal growth mechanisms of clay minerals in mudstones, shales and slates. In: S.Th. Schmidt & R. Ferreiro Mählmann (Eds.) Diagenesis and low grade metamorphism. Schweizerische Mineralogische und Petrographische Mitteilungen, 82(2), 187–202.
Warr, L. N., Primmer, T. J., & Robinson, D. (1991). Variscan very low-grade metamorphism in southwest England: a diastathermal and thrust-related origin. Journal of Metamorphic Geology, 9, 751–764.
Warr, L. N., & Rice, A. H. N. (1994). Interlaboratory standardization and calibration of clay mineral crystallinity and crystallite size data. Journal of Metamorphic Geology, 12, 141–152.
Weaver, C. E. (1961). Clay minerals of the Ouachita structural belt and adjacent foreland: Univ. Texas, Bur. Economics, Geology Publications, 6120, 147–162.
Weaver, C.E. (1989). Clays, Muds and Shales. Developments in Sedimentology (vol. 44). Amsterdam: Elsevier.
Weaver, C. E., & Broekstra, B. R. (1984). Illite-mica. In C. E. Weaver (Ed.), Shale slate metamorphism in Southern Appalachians (pp. 67–199). Amsterdam: Elsevier.
Weber, K. (1972). Kristallinität des Illits in Tonschiefern und andere Kriterien schwacher Metamorphose im nordöstlichen Rheinischen Schiefergebirge. Neues Jahrbuch für Geologie und Paläontologie Abhandlungen, 141(3), 333–363.
Weh, M. (1998). Tektonische Entwicklung der penninischen Sediment-Decken in Graubüngen (Prättigau bis Oberhalbstein). Ph.D. dissertation, Switzerland: Univ. Basel.
White, D., & Thiessen, R. (1913). The origin of coal (vol. 38). Washington, D.C.: Bureau of Mines Bulletin.
Wiederer, U., Königshof, P., Feist, R., Franke, W., & Doublier, M. P. (2002). Low-grade metamorphism in the Montagne Noire (S-France): Connodont Alteration Index (CAI) in Palaeozoic carbonates and implications for the exhumation of a hot metamorphic core complex. In: S.Th. Schmidt & R. Ferreiro Mählmann (Eds.) Diagenesis and low grade metamorphism. Schweizerische Mineralogische und Petrographische Mitteilungen, 82(2), 393–407.
Wiederkehr, M., Bousquet, R., Ziemann, M. A., Berger, A., & Schmid, S. M. (2011). 3-D assessment of peak-metamorphic conditions by Raman spectroscopy of carbonaceous material: an example from the margin of the Lepontine dome (Swiss Central Alps). International Journal of Earth Sciences (Geologische Rundschau), 100, 1029–1063.
Wiederkehr, M., Sudo, M., Bousquet, R., Berger, A., & Schmid, S. M. (2009). Alpine orogenic evolution from subduction to collisional thermal overprint: The 40Ar/39Ar age constraints from the Valaisan Ocean, central Alps, Tectonics, 28, TC6009.
Wilks, K.R., Mastalerz, M., Bustin, R.M., & Ross, J.V. (1993). The role of shear strain in the graphitization of a high-volatile bituminous and an anthracitic coal. Interational Journal of Coal Geology, 22(3–4), 247–277.
Williams, D. J. A., Hofmann, B. A., & Glasspool, I. G. (2008). Coalification in Carboniferous sediments from the Lötschberg base tunnel. Swiss Journal of Geosciences, 101, 651–658.
Wilson, M. J. (1999). The origin and formation of clay minerals in soils: past, present and future perspectives. Clay Minerals, 34, 7–25.
Wilson, M. J. (2004). Weathering of primary rock-forming minerals: Processes, products and rates. Clay Minerals, 39, 233–266.
Winkler, H. G. F. (1979). Petrogenesis of metamorphic rocks (5th ed.). Berlin: Springer.
Wolf, M. (1969). Ein Inkohlungsprofil durch das Flözleere nördlich von Meschede. Erdöl und Kohle, 22(4), 185–187.
Wolf, M. (1975). Über die Beziehungen zwischen Illit-Kristallinität und Inkohlung. Neues Jahrbuch für Geologie und Paläontologie Monatshefte, 1975(7), 437–447.
Yang, C., & Hesse, R. (1991). Clay minerals as indicators of diagenetic and anchimetamorphic grade in an overthrust belt, external domain of southern Canadian Appalachians. Clay Minerals, 26, 211–231.
Yardley, B. W. D. (1989). An introduction to metamorphic petrology. Harlow: Longman Scientific & Technical.
Zaporozhtseva, A. S. (1960). On the regional development of laumontite in Cretaceous deposits of Lena coal basin. Izvestiya, Academy of Sciences, USSR, 9, 52–59.
Acknowledgments
One has to remember that all these kind of metamorphic researches based on vitrinite reflectance and Kübler-Index studies for determining P–T–t conditions in geological terranes were strongly promoted by Bernard Kübler and Martin Frey. The first author whishes specifically to appreciate the extensive and friendly e-mail discussions with Peter Árkai and Hanan Kisch. The manuscript was initiated by the invited key note lecture at EUROCLAY 2011 in Antalya on the Frey–Kübler Symposium and later finalised due to discussions with the coauthors. We like to thank the friendly expressed interest and kind support by the Turkish National Committee on Clay Science. The authors are indebted to Doug Robinson and Hanan J. Kisch as well as to Edwin Gnos for their corrections and advices.
Author information
Authors and Affiliations
Corresponding author
Additional information
Editorial handling : E. Gnos.
Rights and permissions
About this article
Cite this article
Ferreiro Mählmann, R., Bozkaya, Ö., Potel, S. et al. The pioneer work of Bernard Kübler and Martin Frey in very low-grade metamorphic terranes: paleo-geothermal potential of variation in Kübler-Index/organic matter reflectance correlations. A review. Swiss J Geosci 105, 121–152 (2012). https://doi.org/10.1007/s00015-012-0115-3
Received:
Accepted:
Published:
Issue Date:
DOI: https://doi.org/10.1007/s00015-012-0115-3