
Abstract
The manufacturability of metallic alloys using laser-based additive manufacturing methods such as laser powder bed fusion has substantially improved within the last decade. However, local melting and solidification cause hierarchically structured and crystallographically textured microstructures possessing large residual stress. Such microstructures are not only the origin of mechanical anisotropy but also pose metrological challenges for the diffraction-based residual stress determination. Here we demonstrate the influence of the build orientation and the texture on the microstructure and consequently the mechanical anisotropy of as-built Inconel 718. For this purpose, we manufactured specimens with [001]/[011]-, [001]- and [011]/[\(\overline{1} {\text{11}}\)]-type textures along their loading direction. In addition to changes in the Young’s moduli, the differences in the crystallographic textures result in variations of the yield and ultimate tensile strengths. With this in mind, we studied the anisotropy on the micromechanical scale by subjecting the specimens to tensile loads along the different texture directions during in situ neutron diffraction experiments. In this context, the response of multiple lattice planes up to a tensile strain of 10% displayed differences in the load partitioning and the residual strain accumulation for the specimen with [011]/[\(\overline{1} {\text{11}}\)]-type texture. However, the relative behavior of the specimens possessing an [001]/[011]- and [001]-type texture remained qualitatively similar. The consequences on the metrology of residual stress determination methods are discussed.
Introduction
Powder-based additive manufacturing (AM) processes such as laser powder bed fusion (L-PBF) allow the fabrication of complex structures within a single manufacturing step [1, 2]. In the L-PBF process, a laser locally melts powder particles to incrementally form a body layer-wise [1]. However, localized heat inputs induce large local temperature gradients, which result in the formation of large internal stress (IS) during production [2, 3]. Excessive IS buildup may cause delamination or cracking during manufacturing [2,3,4]. Upon cooling, these IS lead to locked residual stress (RS) in the final part [2, 3]. If not accounted for, these RS can be detrimental to the structural integrity, causing in-service part failure [3, 5,6,7]. Although these drawbacks exist, AM promises improvements in the design of lightweight structures (e.g., for aerospace applications) [8, 9]. Therefore, it is imperative to fully understand the impact of RS on the performance of AM parts, if we want to exploit these potential improvements.
In particular, AM of nickel (Ni)-based alloys such as Inconel 718 has been widely studied in open research (see e.g., [10,11,12,13,14,15,16,17]). Inconel 718 is a multiphase Ni–Cr-Fe alloy with additions of niobium (Nb) and molybdenum (Mo), as well as low amounts of aluminum (Al) and titanium (Ti) [18]. Among Ni-based alloys, Inconel 718 exhibits an excellent weldability [19, 20]. Furthermore, it retains its high temperature properties up to a temperature of 650 °C, making it suitable for jet engine applications [21]. The desired properties are obtained by inducing the precipitation of two main strengthening phases: γ´´ (Ni3Nb, tetragonal D022) and γ´ (Ni3(Al,Ti), cubic L12). Such precipitates occur when submitting the material to aging heat-treatments after production [18, 22, 23].
The large local thermal gradients occurring in L-PBF manufacturing have a further relevance for Inconel 718: parts typically contain columnar type hierarchical microstructures in conjunction with a distinct crystallographic texture [10, 13, 14, 16, 17, 24, 25]. On a smaller scale, a cellular solidification substructure forms with an inherent microsegregation of Nb, Mo and Ti at the cell walls [10, 14, 17, 25, 26]. This microsegregation is typically accompanied by dislocation entanglement [10, 13, 17, 27, 28]. It is known that the processing parameters such as the laser power, the scanning velocity, the hatching distance, the layer thickness and the scanning strategy affect the microstructure, the texture and the quality (e.g., in terms of porosity) of the build [13, 25, 29,30,31]. In the case of face centered cubic (FCC) materials (e.g., Inconel 718), it is known that the <100> directions of the crystal lattice align with the direction of heat dissipation [32]. Thus, the scanning strategy is the main driving factor for the texture formation along the scanning direction [29]. Moreover, the heat flow along the building direction highly depends on the melt pool shape [29, 30].
As a consequence of these microstructural characteristics inherent to the process, an anisotropic mechanical behavior typically prevails with a dependence of the build orientation [10, 15, 25, 30, 33,34,35]. However, the severity of the mechanical anisotropy depends on the processing conditions, as shown by Liu et al. [34]. In contrast to the macroscopic mechanical behavior, the literature on the micromechanical behavior is primarily limited to data related to a single build orientation [35,36,37,38]. The results in literature show that the elastic behavior of additively manufactured Ni-based alloys is affected by the microstructure induced by the particular AM technology used: this leads to apparent changes in the values of the plane-specific Young’s moduli (Ehkl) [36, 37]. Even though the role of texture and grain morphology on the mechanical anisotropy is well understood at the macroscopic scale, it widely remains an open question at the microscopic scale. This is one of the subjects of this work.
As mentioned previously, large RS are locked in the final as-built parts because of the localized melting. Diffraction-based RS measurements allow the determination of the RS in a non-destructive fashion. However, metrological challenges arise due to the underlying microstructure and texture; such challenges are reviewed in detail elsewhere [39]. In essence, the measured lattice plane spacings require a conversion into microscopic strain by relation to a reference value. Successively, the obtained microscopic strain is converted into a macroscopic stress by applying the (plane)-specific elastic constants as proportionality factors [40]. As both the elastic constants and the reference value have a strong impact on the magnitude of the determined RS, accurate values representative of each relevant microstructure need to be used. A further complication arises by the formation of crystallographic textures in L-PBF manufactured specimens: as they behave elastically anisotropic at the macroscopic scale [41], the plane-specific elastic constants generally become dependent on the measurement direction within the specimen. The study of the micromechanical behavior needs to take the underlying texture into account [42, 43]. In this regard, the orientation distribution function can be used as a weighting factor (the so-called stress factors) in the calculation of the direction independent elastic constants [44].
There is an additional consequence of the unique anisotropic microstructure of L-PBF alloys for the determination of RS with diffraction-based methods: In the case of monochromatic diffraction-based methods such as laboratory X-ray or steady-source neutron diffraction, a suitable lattice plane family must be selected for the determination of the RS [45]. This lattice plane family should represent the bulk behavior and exhibit a low sensitivity to the accumulation of residual strain (also referred to as intergranular or type II strain) [45]. In the case of conventionally manufactured FCC materials, the lattice plane families {111}, {422} and {311} are considered to fulfill these requirements the best [45,46,47]. However, it was shown for L-PBF manufactured stainless steel that the {311} lattice plane family may accumulate significant residual strain during tensile loading [48]. An overview of the accumulation of the residual strains and the Ehkl for different laser powder-based metal AM is given in [39].
It is apparent that two main aspects need to be addressed to gain a detailed understanding of the micromechanical behavior and its impact on the diffraction-based RS analysis. First, we need to characterize the response of the lattice planes in dependence of the build orientation to understand the elastic anisotropy of the material. Second, we ought to investigate the accumulation of the residual strains for different build orientations. Such strategy is required to understand the influence of the microstructure on the plastic anisotropy of the material and the suitability of specific reflections to represent the bulk behavior.
With this in view, we designed a strategy to investigate how changes in the build orientation and texture affect the micromechanical behavior of L-PBF as-built Inconel 718. Furthermore, we examine the Ehkl and compare them to model predictions calculated from single crystal elastic constants (SCEC) using established micromechanical models. Finally, we evaluate the accumulation of the plane-specific residual strains during plastic deformation.
Materials and methods
Sample fabrication
The specimens used in this study were built by L-PBF using an SLM 280 (SLM Solutions Group AG, Lübeck, Germany). The gas atomized Inconel 718 powder nominal composition (manufacturers certificate) is reported in Table 1. The powder with a particle size distribution between 10–45 µm and a D50 ≈ 38 µm was provided by SLM Solutions. The processing parameters suggested by the manufacturer were applied, using a layer thickness (t) of 0.06 mm: laser power (P) of 350 W, scanning velocity (v) of 800 mm s−1, spot size diameter of 0.08 mm and hatch spacing (h) of 0.15 mm, while the baseplate was pre-heated to 200 °C. This parameter set corresponds to a volume energy density (Elaser = P/vht) of ≈ 49 J mm−3. The build chamber was kept under an argon atmosphere with a constant gas flow (to prevent oxidation during manufacturing).
Both horizontal (110 × 13 × 13 mm3) and vertical (13 × 13 × 110 mm3) rectangular prisms were manufactured in separate build jobs using a bidirectional scanning strategy with a 90° interlayer rotation. The horizontal prisms have their longest direction parallel to the build plate, whereas the vertical prisms have their longest direction perpendicular to the build plate, as depicted in Fig. 1. The horizontal and vertical prisms were manufactured with an interlayer time (ILT) of 107 s and 81 s. Mohr et al. [49] showed for L-PBF 316L that such longer ILT cause insignificant heat accumulation, with a low dependence on the build height. The scanning tracks were aligned parallel to the edges of specimens for the vertical (V0°: Fig. 2a) and horizontal (H0°: Fig. 2b) builds, respectively. In addition, a second horizontal variant was built, for which the scanning pattern was rotated by 45° relative to the prism edges, while the rest of the manufacturing parameters were kept constant (H45°: Fig. 2c). After completion of the manufacturing process, the prisms were removed from the baseplate and retained in the as-built state (i.e., no heat treatments were applied).

Schematic illustration of the vertically and horizontally built prisms on the baseplate, also showing the extraction of the two tensile specimen geometries after removal from the baseplate. The cuts from which the metallography samples were extracted are highlighted in color. All dimensions are in mm

Schematic illustration of the top view of the vertical prism V0° (a) and of the horizontal prisms H0° (b) and H45° (c) showing the different scanning strategies. The hatch spacing is the same for all prisms
Microstructural analysis
For microstructural analysis, three samples were extracted from each prism (V0°, H0° and H45°), as shown in Fig. 1. All nine samples were mounted in conductive epoxy resin (Technotherm 3000, Kulzer GmbH, Hanau, Germany). Thereafter, the samples were prepared as metallographic sections (BD-T, BD-L and L–T) by subsequent grinding down to 1200 SiC Grit, followed by polishing steps of 9, 3 and 1 µm using diamond paste. BD refers to the building direction, while L and T denote the longitudinal and the transversal direction, respectively. A final polishing step using an 0.04 µm Active Oxide Polishing Suspension (OPS, Struers GmbH, Crinitz, Germany) was performed. For the sake of brevity, we focus solely on the microstructures along the direction of applied load (V0°: BD-T, H0° and H45°: L–T). For the microstructural characterization of the metallographic sections, a LEO 1530VP (Carl Zeiss Microscopy GmbH, Oberkochen, Germany) scanning electron microscope (SEM) was used, equipped with an electron backscatter (EBSD) Bruker Nano e−-Flash HD 5030 detector (Bruker Corporation, Billerica, USA).
For the EBSD analysis, an acceleration voltage of 20 kV was set at an approximate working distance of 18 mm under the standard tilt of 70°. A map with a resolution of 800 × 600 pixel was defined at a magnification of 75× at the center of each section, thereby defining a pixel size of 5 µm and a probed area of approximately 4 × 3 mm2. For data acquisition and pattern indexing, the ESPRIT 1.94 package from Bruker nano was used. For data post-processing, the open-source MTEX toolbox [50] installed within the MATLAB (The MathWorks, Inc., Natick, USA) software was used. For the analysis, grains containing less than 10 pixels were removed and a misorientation angle of 10° was used as a threshold to define high angle grain boundaries. Afterwards, the non-indexed pixels were filled by their nearest neighbor and denoising was performed using a variational spline filter [51]. Finally, the grain boundaries were smoothed using the default smoothing kernel in MTEX with 25 iterations. The average grain size (darea) was defined as the equivalent spherical diameter of the grain area weighted by the area fraction. The effective grain size (deff) along the loading direction was determined averaging the results of the line intersection method (as implemented in MTEX) along seven vertical lines. The Taylor factor (M) was calculated in MTEX using the FCC \(\left\{ {1{1} {\text{1}}} \right\}\langle 110\rangle\) slip systems with the deformation tensor \(\bf E_{{kl}}^{s} {\text{ }} = {\text{ }}\left[ {\begin{array}{*{20}c} { - (1{\text{ }} - {\text{ }}q)} & 0 & 0 \\ 0 & 1 & 0 \\ 0 & 0 & { - q} \\ \end{array} {\text{ }}} \right]\) (see [52]). The contraction ratios q = 1/2 and q = 1/3 were estimated from the ex situ tests for the vertical and the horizontal specimens, respectively. The grains cutting the image border were excluded from all calculations.
SEM images in backscattered electron (BSE) mode were acquired under an acceleration voltage of 15 kV and a working distance of 6–7 mm at different magnifications.
X-ray diffraction
X-ray diffraction measurements on the surfaces of the as-built samples (BD-L plane) and of the raw feedstock powder were carried out using the ETA X-ray diffractometer GE XRD 3003 available at the Helmholtz Zentrum Berlin (HZB), Germany. Cu Kα1+2 radiation at an acceleration voltage of 40 kV under a current of 45 mA was used together with a polycapillary semi lens (2 mm) in the primary beam. In the diffracted beam, an equatorial Soller slit (0.4°) was used in combination with a flat secondary monochromator (001-LiF). The diffraction data were acquired in angular dispersive mode ranging from 2θ = 5–155° with a step size of 0.1° and a counting time of 20 s per measurement point. The instrument was calibrated using LaB6 powder.
Ex situ mechanical testing
One tensile specimen for each build condition was manufactured from the prisms according to the geometry specified in DIN 50125:2004–01–B 6 × 30 (6 mm gauge diameter, 30 mm gauge length) [53]. The ex situ tensile tests were performed at room temperature according to DIN EN ISO 6892–1 [54] using a 100 kN Instron 4505 machine (Instron GmbH, Darmstadt, Germany). The loading direction was parallel to the build direction in the vertical specimen and parallel to the longitudinal direction in the horizontal specimens. The strain was recorded by a 632.12C-21 MTS extensometer (MTS Systems GmbH, Berlin, Germany) with a gauge length of 25 mm calibrated to a strain range of 0% to 50% according to DIN EN ISO 9513 [55]. All tests were run in displacement control at a constant strain rate of 2.5 × 10⁻⁴ s−1. The ex situ tests were primarily meant as a benchmark of the tensile behavior of each condition, to define the acquisition points for the in situ tensile tests. In addition, the 0.2% yield strength (σy), the ultimate tensile strength (UTS), the macroscopic Young’s modulus (EM) and the strain to failure (A) were determined from the obtained engineering stress–strain curves.
In situ mechanical testing
The presence of crystallographic texture, grain clustering or coarse grains may restrict the presence of certain lattice planes within the gauge volume along the scattering vector. As opposed to synchrotron X-ray diffraction, neutron diffraction allows the usage of a larger gauge volume leading to improving grain sampling statistics and thus being more representative of the bulk behavior [56]. Therefore, in this study, neutron diffraction was preferred over synchrotron X-ray diffraction.
The in situ tensile tests were performed at the pulse overlap time-of-flight (TOF) diffractometer POLDI at the Swiss Spallation Neutron Source (SINQ) at the Paul Scherrer Institut (PSI), Villigen, Switzerland. Threaded round tensile specimens with a gauge diameter of 6 mm were machined from each condition according to the beamline requirements (see [57]). The specimens were mounted in the in-house built load frame available at the beamline, which has a maximum load capacity of 30 kN. The test was performed at a strain rate of 4 × 10⁻⁴ s−1; An MTS 634.12F-25 extensometer (MTS Systems GmbH, Berlin, Germany) measured the (macroscopic) strain over the 25 mm gauge length. The test was run up to a total true strain of ≈ 10%. In the elastic region the test was run in load control mode, while it was changed (manually) to displacement control in the plastic region.
The TOF diffraction technique at POLDI uses a multi-slit chopper allowing multiple frame overlap [58]. The arrival time is consequently not unambiguously determined by its TOF, which requires additional information for data evaluation [58]. In fact, the TOF is dependent on the scattering angle, which requires the time and angular information to be recorded with a 2D detector [58]. For data evaluation a specific correlation method is used to obtain the correlated diffraction pattern [58], which can then be fitted within the open source software Mantid [59] to obtain the peak information. More detailed information on the beamline and the evaluation technique can be found in the literature [58, 60, 61].
The scattering vector (\(\bf \overrightarrow{\text{q}}\) with the absolute value Q) was aligned with the tensile direction to monitor the axial response of the lattice plane spacings (dhkl) to the external load (Fig. 3). A second test with the scattering vector \(\bf \overrightarrow{\text{q}}\) aligned to one direction perpendicular to the tensile direction to monitor the transversal response was also performed. However, since for textured materials the lateral contraction becomes direction-dependent (within the specimen itself), a crystal plasticity model would be required to relate the mechanical behavior to the texture. This is beyond the scope of this article and will be addressed in a companion publication. For the acquisition of the diffraction data a gauge volume of 3.8 × 3.8 × 3.8 mm3 was defined under an angular coverage of 2θ = 75–105°. The measurement time per point was approximately 45 min. In the plastic region, a three-minute waiting time was applied to allow for stress relaxation before the acquisition of neutron diffraction data. For single peak analysis of the γ phase, the available Gaussian function within Mantid [59] was used to fit the experimental data. Additionally, the γ-phase lattice parameter was refined using a full pattern Pawley fit [62] (using a Gaussian peak profile).

Schematic of the in situ loading setup at POLDI. The grey triangle indicates the ± 15° angular coverage of the detector. Q denotes the absolute value of the scattering vector (\(\bf \left|\overrightarrow{\text{q}}\right|\))
The lattice strain (εhkl) was calculated from the respective dhkl for each load step using:
where \(\it {\text{d}}_{0}^{\text{hkl}}\) is defined as the initial dhkl at a preload of approximately 50 N. The lattice strain is therefore relative to this macroscopically unstrained condition. It must be noted that, by nature of the diffraction technique, only elastic strains can be determined [63].
Results
Microstructure and texture
The as-manufactured microstructures characterized by SEM in backscattered electron mode reveal the typical columnar solidification structure displaying both fine- and coarse-grained regions (Fig. 4a, c). In the interdendritic regions of the build, the typical microsegregation can be observed. Furthermore, small amounts of gas porosity (< 0.005%) are present within the builds, as measured by X-ray computed tomography (see Fig. S1 in supplementary information). Additional observations using energy-dispersive X-ray spectroscopy (see Fig. S2 in supplementary information) reveal the presence of (Ti, Nb)N particles (Fig. 4c). Similar microstructures can be observed irrespective of the build orientation and scanning strategy.

BSE images revealing the microstructures of H45° in the build direction (a, b) and perpendicular to it (c, d)
The orientation-maps (Fig. 5a–c) (as measured by EBSD) show the dependence of the grain morphology and texture on the build strategy: Both V0° (Fig. 5a) and H0° (Fig. 5b) builds qualitatively display a similar texture along their loading directions, BD and L, respectively. However, the grain morphology along these two directions is significantly different. For the sample V0° columnar grains oriented along the BD are observed. As the sample H0° is observed perpendicular to the build direction, a chessboard-like pattern can be observed: this morphology is determined by the cross sectional cut through the columnar grains. The alteration of the scanning pattern for the sample H45° leads to a 45° rotation of the chessboard-like pattern with respect to the sample geometry (Fig. 5c). Figure 5d–l shows the inverse pole figures of each sample. With respect to the BD, the texture formation is not significantly affected by the scanning strategy, being mixed [001]/[011]-type (Fig. 5d–f). In the case of scanning along the geometrical axes, the texture components along L and T are comparable among the samples (Fig. 5g, h, j, k); this is expressed by the qualitatively equal [001]-type texture components of V0° (Fig. 5g, j) and H0° (Fig. 5h, k) along their L and T. In line with the rotation of the scanning pattern, H45° contrarily developed an [011]/[\(\overline{1} {\text{11}}\)]-type texture along L and T (Fig. 5i, l). In view of the loading directions, V0° displays an [001]/[011]-type texture (max. ≈ 2.7 m.r.d.) along BD (Fig. 5d), while H0° and H45° depict an [001]- (max. ≈ 3.8 m.r.d., Fig. 5h) and an [011]/[\(\overline{1} {\text{11}}\)]- (max. ≈ 2 m.r.d., Fig. 5i) type texture along L, respectively.

Orientation-maps (a–c) (probed area 1 × 0.75 mm2) and the corresponding logarithmically scaled inverse pole Figures (d–l) (probed area 4 × 3 mm2) for the sections V0° BD-T (d, g, j), H0° L–T (e, h, k) and H45° L–T (f, i, l). The viewing directions of the orientation-maps (a–c) correspond to the respective loading directions as indicated in grey color. Texture intensity is in m.r.d. (multiples of a random distribution)
The microstructural characteristics are listed in Table 2. In essence, neither the grain size nor the shape factor of the grains is significantly affected by the build orientation or scanning strategy: An average grain size of ≈ 60 µm and a shape factor (perimeter/equivalent perimeter weighted after the area fraction) of ≈ 1.5 are present in all build conditions. The large standard deviation associated to the average grain size is attributed to the wide grain size distribution.
X-ray diffraction
The X-ray diffraction peaks of the first four γ reflections observed in the data measured on the surface of the sample H0° compared to data on the feedstock powder are shown in Fig. 6. Firstly, over the complete angular range, no secondary phases could be evidently identified within the measurements’ resolution of 0.1° in 2θ (see full diffraction pattern, Fig. S3 in supplementary information). Secondly, all peaks exhibit an asymmetry at smaller diffraction angles (Fig. 6a). When the intensity is normalized to the maximum intensity of each peak, we observe that the peak asymmetry appears independent of the sample tilt angle and the sample condition (bulk/powder). This is exemplarily shown for the 200 reflection in Fig. 6b.

a The first four diffraction peaks acquired on the BD-L surface of H0° at different sample (ψ) tilts, compared to feedstock powder. b The 200 peaks of (a), normalized to the respective maximum intensities
Ex situ tensile testing
The engineering stress–strain curves measured during the ex situ tensile testing of the specimens V0°, H0° and H45° are shown in Fig. 7a. Their respective mechanical properties determined from the curves are shown in Table 3. Clear differences in the mechanical behavior can be observed: The σy of the vertical build V0° displays the lowest value of 635 MPa, while horizontal builds H0° and H45° show significantly higher values of 725 MPa and 814 MPa, respectively. The same ascending order can be observed for the UTS, while the strain to failure decreases with the increase of the tensile strength.

a Engineering stress–strain curves of the different specimens. The kink in the ex situ curve of H45° corresponds to an interruption during the test, which did not affect the overall behavior. b The true stress–strain curve for the specimen V0° acquired during the in situ test shown together with the respective ex situ response as well as the average stresses during the acquisition of neutron diffraction data (errors lie within the symbol size). The inset in (b) depicts the stress relaxation during the in situ test
In situ tensile testing
In Fig. 7b the true stress–strain curve obtained during the in situ test (blue) is shown together with the ex situ curves (red) for the specimen V0°. In addition, the yellow points indicate the average stress and strain values during the acquisition of neutron diffraction data (see inset in Fig. 7b). The ex situ stress–strain curve well matches the mechanical data obtained during the in situ test. Furthermore, we observe a stress relaxation during the acquisition of neutron diffraction data in the displacement-controlled region, which becomes more significant at higher strains. During unloading and reloading, the specimens display some hysteresis, which appears more pronounced at higher strains. This behavior was observed for each condition (see Fig. S4 in supplementary information). Thus, only the V0° specimen is exemplarily shown.
Diffraction peaks
Figure 8 shows the first four diffraction peaks of the specimen H0° during loading; the one-dimensional peak fit is also shown. In response to the macroscopic load, the diffraction peaks shift toward smaller Q values due to the applied tensile strain. In addition, a peak asymmetry similar to that observed by X-ray diffraction can be observed, while the peaks significantly broaden at higher plastic strain (εtrue = 10%). Except from an overall peak broadening, the degree of peak asymmetry of H0° seems not affected by plastic deformation, as exemplarily shown for the 200 reflection.

First four neutron diffraction peaks of H0° during in situ loading and the respective Gaussian fits of the γ phase. The black arrows depict the peak asymmetry within the acquired neutron diffraction data
Lattice strain evolution during deformation
The true stress–lattice strain plots are shown in Fig. 9. The strain response of the {111}, {200}, {220} and {311} lattice plane families is compared to the Pawley refinement. The response of the lattice parameter as calculated by the Pawley refinement is a convolution of all lattice planes considered: since, in contrast to a Rietveld refinement, the intensity is a free parameter within the Pawley refinement [62], the texture is empirically considered within the refinement.

True stress–lattice strain plots showing the response of V0° (a), H0° (b) and H45° (c). The average obtained by a full pattern Pawley refinement is additionally shown for each specimen. Except of 111 in (b), the errors in lattice strain and average true stress lie within the symbol sizes
In the elastic region, the response of the lattice strain for each reflection to the applied load is close to linear up to 500 MPa, 600 MPa, and 700 MPa for V0°, H0° and H45° respectively (Fig. 9). Therefore, the Ehkl can be quantified by performing a linear regression of the first ten points. The values obtained are shown in Table 4. As an aftereffect of the low intensity of the 111 reflection for H0° (Fig. 8), the higher error of the peak position causes the increased scatter in the applied stress–lattice strain plot (Fig. 9b). Consequently, this leads to an increased error of the linear regression (Table 4). Beyond that, the {111}, {200}, and {311} families exhibit very different values, but are independent of the build orientation and texture. The only difference exceeding the error limits can be found for the {220} of the specimen H0°, which exhibits a significantly lower value than E220 for the other two specimens. The EP obtained by the Pawley refinement reasonably describes the bulk behavior: they broadly agree with those determined from the ex situ mechanical test, which depend on the underlying texture.
In the region where macroscopic plastic deformation occurs, also lattice strains are characterized by a deviation from linearity [64]. The {220}, {111}, {200} lattice plane families and the Pawley refinement show increased nonlinearity for V0° and, to a lesser extent, for H0°. However, the {311} response remains broadly linear during the whole in situ experiment. This seems not to hold for H45°, where the {311} starts to deviate from linearity, while the {111} remains broadly linear. For H45° the response of the {200} is not shown because of its low intensity (caused by the texture in the loading direction).
Lattice micro residual strain accumulation
In Fig. 10, the residual lattice strains following unloading are plotted against the true plastic strain for each specimen. For V0° (Fig. 10a), the largest tensile residual strains develop for the {200}, while the largest compressive strains develop for the {220}. Lower compressive residual strains are accumulated for the {111} and {311}. The Pawley refinement displays nearly zero residual strain. In comparison, the magnitude of residual strains is lower for H0° as shown in Fig. 10b. However, the overall trends of the lattice planes are similar to V0°, except that the Pawley refinement exhibits larger residual strains, slightly lower than the {200}. In contrast, for the H45° build (Fig. 10c) the {311} develops tensile residual strains, while the {111}, {220}, and the Pawley refinement exhibit negligible residual strains. As the residual strains are relative to the dhkl values at preload, the initial RS state is not taken into account in this analysis.

Residual lattice strains after unloading shown in dependence of the true plastic strain for V0° (a), H0° (b) and H45° (c). The average obtained by the Pawley refinement is also shown
Discussion
Microstructure and texture
The grain structure (Fig. 5a) in the building direction corresponds well to the findings of Gokcekaya et al. [30]: for a comparable Elaser of 40–47 J mm−3 columnar <100> regions are found, separated by <110> oriented “v-shaped” grains (see also [31]). However, the texture formation is different: as opposed to the dominant <110> texture along the build direction reported in [30] and [31], we observe mixed [001]/[011]-type textures (Fig. 5d–f). In fact, at the bottom of the melt pool (depending on the curvature) the solidification occurs mainly along the building direction, which favors the <100> directions to dominate crystal growth [30]. At the melt pool flank, crystal growth is promoted at an approximate angle of 45°, causing primary <100> growth in that direction [30, 31]. Therefore, qualitatively shallower melt pools caused by different processing conditions cause an [001]/[011]-type texture to form along the building direction, as shown in [10, 34]. Thus, the difference in the texture along the building direction could be explained by the dissimilarity in the local solidification conditions associated to the processing parameters. Furthermore, a pre-heating temperature of 200 °C led to a type of microstructure, which is comparable to the microstructure obtained using an Elaser of 40 J mm−3 and pre-heating at 80 °C [30]. In fact, the processing parameters and their different consequences for the solidification conditions need to be considered when comparing the various studies.
The texture along the scanning direction is mainly determined by the relative orientation between the specimen edges and the laser tracks: for parts with simple scan strategies, such as no rotation or 90° interlayer rotation, the <100> directions of the crystals align with the laser pass directions [30, 31, 34]. Shorter hatch lengths typically increase the intensity of the texture [31]. This difference can be also found for V0° and H0°: the hatching along the length and the width of the prism H0° (Fig. 5h, k) caused a weaker texture relative to V0° (Fig. 5g, j).
Precipitation of primary and secondary phases
Although microsegregation occurs in L-PBF Inconel 718, it has been shown across several studies that only few precipitates exist in the as-built state of L-PBF Inconel 718: such particles are mainly identified as C14 Laves phase, carbides, and oxides [10, 17, 28, 65, 66]. In view of the cellular solidification structure, Rielli et al. [28] found (for Elaser = 62.5 J mm−3) that the size of the cellular solidification structure depends on the scan vector length: a chessboard strategy resulted in slower heat dissipation, which increased the interdendritic arm spacing compared to a meander-type scan strategy. In addition to the increased size of the cellular substructure, twice the volume fraction (≈ 2%) of 80% larger Laves phase has been found within the chessboard sample [28]. However, besides some Al clustering within the chessboard strategy no precipitation of the γ´´ or of the γ´ phase was observable by atom probe tomography in the dendritic core regardless of the scan strategy [28]. For the meander-type scan strategy, this agrees to diffraction measurements made in the transmission electron microscope (TEM) on the selected area: the superlattice reflections of γ´´ and γ´ were not observed [28]. Similar findings were obtained by Zhou et al. [65] (Elaser = 62 J mm−3) and Xu et al. [66] (Elaser = 62 J mm−3). Even though Gallmeyer et al. [10] observed nano-sized precipitates in high-resolution TEM micrographs of as-built L-PBF Inconel 718 (Elaser = 25 J mm−3), their small size and sparsity precluded the determination of their crystallographic structure. In fact, Zhou et al. [65] subjected as-built Inconel 718 to a direct aging procedure and observed an enrichment of γ´´ precipitates along the cellular boundaries. The selective precipitation of γ´´ at the cellular boundaries during direct aging indicates the presence of a Nb-rich supersaturated FCC solid solution in the as-built condition.
In essence, regardless of the (standard) process parameters reviewed here, precipitation of γ´´ nor γ´ has not been observed in as-built Inconel 718. This can be attributed to the sluggish precipitation kinetics of the γ´´ phase [66] in conjunction to the rapid cooling inherent to the L-PBF process. As a relatively long inter-layer time (ILT) and a pre-heating temperature of 200 °C were used alongside an Elaser of 49 J mm−3 to produce the specimens in this study, the heat accumulation is expected to be insignificant [49]; this would suppress the subsequent precipitation of γ´´ and γ´ during manufacturing. Thus, although the microstructural characterization by means of TEM was beyond the scope of the article, the specimens in this study can be considered free of γ´´ and γ´ precipitates. Our specimens likely contain low amounts of C14 Laves phase, (Nb, Ti)C, and (Nb, Ti)N.
Macromechanical behavior
As known from the literature, the classic Hall–Petch equation fails to predict the σy of as-built L-PBF Inconel 718 [10]. In particular, to decouple the different causes of the σy anisotropy in dependence of the build orientation remains challenging: The columnar microstructure effectively changes the number of grain boundaries present in the loading direction. However, we observe that the change in grain size alone is not capable to explain the change of the σy. In that context, the texture has been identified as one of the main driving factors of the mechanical anisotropy, which can be quantified by the Taylor factor [15, 25, 30, 33]. Besides, Zhang et al. [67] showed that the dislocation density is different for their horizontally and vertically built L-PBF Inconel 718 specimens. Thus, the Taylor strain hardening model has been added to the classic σy prediction by Hall–Petch for an additively manufactured high entropy alloy [68]. This has been successfully applied to as-built L-PBF Inconel 718 by Gallmeyer et al. [10], showing good agreement with the experimental data. However, this approach does not consider differences of the other strengthening mechanisms (i.e., solid solution strengthening) as described in [67]. In that context, Zhang et al. [67] quantitatively decoupled the strengthening mechanisms in L-PBF vertical and horizontal as-built Inconel 718. When we apply the approach (and the modeling parameter set) as described in [67] while considering the Taylor factor and the effective grain size listed in Table 2; we obtain the following predictions for the σy: 660 MPa, 727 MPa, and 782 MPa for V0°, H0° and H45°, respectively. However, the model does not account for the chemical gradients within the solid solution associated to the local segregation at the cell walls. Therefore, the impact on local solid solution strengthening is not considered within the model and the associated contribution to the overall strength. Instead, the strength increment of the segregated regions is only considered by the Orowan strengthening of the Laves phase. Despite these limitations in the comparability to our material, the agreement to the experimental values (Table 3) remains reasonable. Thus, the σy difference between V0° and H0° can be attributed to the potentially higher dislocation density present in the horizontal build, to the texture, and to the effective grain size. In contrast, the higher σy of H45°, compared to H0° could be explained by the stronger [011]/[\(\overline{1} {\text{11}}\)]-type texture, as quantified by the Taylor factor.
Micromechanical behavior
Elastic behavior
As a consequence of the single crystal anisotropy of nickel, it is known that the response of the lattice planes to a macroscopic load show large variations (the so-called elastic anisotropy) [69].
Figure 11a shows the comparison of the experimentally determined Ehkl with isotropic calculations using the established grain interaction models of Eshelby-Kröner [70] (spherical inclusion in an isotropic material) and Reuss [71] (isostress among grains). In regard of the selected SCEC, this study further supports the observation that the textured microstructures of L-PBF Inconel 718 are better described by the Reuss than by the Kröner model [36]. Furthermore, we show that the E200, E311, E111 are not affected by the texture, since they have similar values for the three specimens. However, some dependence of the E220 on the texture (quantified by the Taylor factor M) can be observed (Fig. 11b): As the [001] texture component increases, E220 significantly decreases. This dependence on the texture indicates a stronger interaction between {220} and {001} lattice plane families. Other lattice plane families in the vicinity of {220} seem to have less influence on E220. In fact, the stiffness difference between the {220} and {111} lattice plane families is much smaller than that between {220} and {200}, so that with increasing [011]/[\(\overline{1} {\text{11}}\)] texture components we observe an increasing insensitivity of E220 to M.

a Comparison of the experimentally obtained Ehkl with the isotropic model predictions of Reuss and Kröner, calculated with the software ISODEC (see [74]), using the SCEC of GFM-A Inconel 718 (c11 = 242.35 ± 0.66 GPa, c12 = 139.73 ± 0.42 GPa, and c44 = 104.44 ± 0.74 GPa) reported in [75]. The error limits of all experimental and model (error band width ≈ 3 GPa) data, are indicated by the shaded bands. The Voigt model is a horizontal straight line (at ≈ 215 GPa) and is not shown for the sake of clarity. b The dependence of the E220 on the Taylor factor M (i.e. on the texture type)
Overall, a good agreement between experimental data and grain interaction models can be obtained even though SCEC of conventional material are used for the calculations. It is noted that the model predictions largely depend on the choice of the SCEC. In that context, Wang et al. [37] determined the SCEC and the diffraction-elastic constants of conventional Inconel 625 at different temperatures from in situ neutron diffraction measurements on polycrystalline specimens. They obtained a good agreement between the Kröner model and the experimental data for room temperature, 600 °C and 700 °C [37]. Furthermore, they determined the Ehkl of direct energy deposited (DED) Inconel 625 at room temperature and 600 °C [37]. In general alignment with this study, their experimental data gave reasonable agreement to the Reuss model when considering the SCEC of the conventional Inconel 625 at room temperature (see [39]). In fact, Aminforoughi et al. [72] conducted an in situ tensile experiment on solution heat-treated L-PBF Inconel 718 using synchrotron X-ray diffraction in transmission geometry. In their experiment they showed that stresses calculated on the base of Reuss model elastic constants gave similar values for different lattice planes in the early stages of deformation. With increasing applied stress, some lattice planes (especially 311) exhibit a deviation of the calculated stress compared to the other lattice planes; we suppose that this splitting might be attributed to the build-up of intergranular strains due to the plastic anisotropy of the material. As the solution heat treatment conceivably precipitated δ-phase at the grain boundaries, an interphase stress may also cause such deviation to the calculated stress [38].
However, to the best of authors’ knowledge the SCEC have not been experimentally determined for L-PBF Inconel 718. Although phase-specific SCEC have been reported for direct laser metal sintered Inconel 718 by Ghorbanpour et al. [73], the values are based on homogenized calculations of the SCEC reported in Haldipur et al. [73]. In general, more research (e.g., the combination of the experimental data with a crystal plasticity model) is needed to determine the SCEC from measured diffraction-elastic constants. In particular, since the required transverse contraction of a lattice plane family {hkl} is not accessible from diffraction experiments of textured specimens (as discussed in [39, 40]), more theoretical and experimental work (using texture based approaches) is needed for AM materials.
Plastic behavior
In the plastic regime the relation between macroscopic stress and microscopic strain becomes highly nonlinear [69]. Dye et al. [69] have described the elastic and plastic anisotropy occurring in FCC metals during tensile deformation. They have shown that the elastically stiffest grains do not need to be the first to yield. Instead, these elastically stiffest grains often take the load from the surrounding softer grains, relieving the load on them. Once the {220} grains start yielding in V0° (Fig. 9a) and H0° (Fig. 9b), the {220} lattice plane family transfers the load to the {200}. This is reflected by the jump in accumulated lattice strain (Fig. 9a,b). This type of behavior is well known for conventional Inconel 718 [76] and has been reported for L-PBF Inconel 718 [35, 36, 38], DED Inconel 625 [37], as well as L-PBF austenitic (FCC) stainless steel 316L [77]. As opposed to H0° and V0°, the specimen H45° has very few {200} grains oriented along the loading direction (Fig. 5i). In this case the yielding {220} family transfers the load to the {311} (Fig. 9c). Therefore, the texture has a significant impact on the load partitioning around the σy. Once all grains have yielded, and hence slip has been initiated in all grains, the strain response (i.e. the slopes of the applied stress vs. lattice strain) is similar to that prior to plastic deformation [69]. As the texture is empirically captured within the Pawley refinement, the behavior of the lattice parameter refined with Pawley’s approach displays the same behavior as the dominant texture component upon loading. Even further, the atypical behavior of macroscopically unrepresentative reflections may skew the determined lattice parameters [63].
Accumulation of residual strain
The broad range of plastic anisotropy behaviors observed for the different specimens indicates a variation of the accumulation of residual micro strains during uniaxial deformation. The consequence of this behavior is the development of compressive micro-strains for the {220} and {111} families. This has been previously observed for conventional Inconel 718 [76] and L-PBF 316L [48]. In contrast, the {311} accumulates compressive residual strain for H0° and V0°, which does not seem to occur in conventional Inconel 718 [76]. However, in the case of a heat-treated material the load may be transferred to the different phases of Inconel 718 (e.g., δ [38] or γ´´ [35]). This may affect how the residual strains accumulate with increasing plastic load [63]. As the load partitioning between the lattice planes changes for the specimen H45°, the {311} accumulates tensile residual micro strains. In fact, this is comparable to the {200} lattice plane family of V0° and H0°.
The texture influences the load partitioning; it also determines the lattice plane that best describes the Pawley behavior. In fact, contrary to the recommendation given for conventional materials [47], the {311} family might not be the best choice for RS determination along L of specimen H45°. As discussed in Clausen et al. [45], even weak textures influence the selection of the best suited reflection for RS analysis. However, as the determination of bulk RS is a three-dimensional problem, a suitable lattice plane must contain the best behavior averaged over multiple (specimen) directions. As E311 remains unaffected by the texture, the {311} family remains suitable for RS analysis although the degree of accumulation of residual strain changes with the texture. In fact, we must consider that the {220} and {111} families accumulate even larger residual strains in V0° and H0°.
Origin of the diffraction peak asymmetry
By performing a single peak fit based on a single Gaussian function, we only consider the γ matrix in our analysis. However, the peak asymmetry we observed in both X-ray (Fig. 6) and neutron diffraction (Fig. 8) patterns has been often connected to the precipitation of secondary phases (especially γ´´ and γ´) in heat-treated Inconel 718 [36, 38, 78, 79]. Given the absence of γ´´ and γ´ precipitates in as-built Inconel 718 as discussed above, the diffraction peak asymmetry is concluded to arise from a different contribution. In fact, Liu et al. [80] already observed such peak asymmetry in cold rolled Inconel 718 and attributed this to the segregation of Nb rather than solely to the precipitation of γ´´ and γ´: as the lattice parameter of the supersaturated solution containing more Nb is larger than γ [81], the contribution of such segregations to each diffraction peak would be visible at smaller scattering angles.
In addition, we could also observe the same peak asymmetry within the gas atomized feedstock powder (Fig. 6); This was also found by Gruber et al. [82] and Parimi et al. [83], who qualitatively show chemical segregation effects for gas atomized Inconel 718 powder. Recently, Schmeiser et al. [84] observed a similar peak asymmetry for L-PBF Inconel 625 and attributed it mainly to Nb and Mo segregation at the walls of intragranular cells (see Fig. 4). Furthermore, the studies of Tucho et al. [78] on L-PBF Inconel 718 show that the homogenization of the microstructure and the annihilation of dislocations by the high temperature heat-treatment change the 111 peak shape from a broad asymmetric type to a symmetric diffraction peak. Analogously, Levine et al. [85, 86] have shown that the formation of dislocation cells during the deformation of a copper single crystal result in a broad asymmetric diffraction peak.
Based on these observations we propose an explanation for the peak asymmetry in as-built L-PBF Inconel 718: The localized higher content of Nb and Mo in the segregation regions around the cell walls increases the FCC lattice parameter and therefore shifts the peak to smaller scattering angles. In addition to a peak shift, the cell wall regions also impose a peak broadening due to their high dislocation density (tensile type III stresses [87]). Furthermore, small amounts of Laves phases (≈ 1–2%) [28, 38] present at the cell wall may also contribute to the diffraction signal. However, due to their different crystallographic structure compared to γ, their low volume fraction and the absence of visible peaks in the pattern, they are excluded as the primary cause of the diffraction peak asymmetry. This scenario is sketched in Fig. 12.

Schematic illustration for the hypothesis of the origin of diffraction peak asymmetry in as-built Inconel 718. The red dotted line depicts the cumulative diffraction signal of γ and γ* for H0°-200 at εtrue ≈ 0%. The orange line illustrates the residuals between the acquired diffraction data and the cumulative fit
Role of cell walls on deformation mechanisms
Based on the discussion above, it is noteworthy that the peak fit should theoretically be performed considering two separate FCC lattices (γ for interior and γ* for wall) with different lattice parameters. However, as described by Levine et al. [85] the fit of a single asymmetric peak with a certain number of Gaussian functions is not uniquely determined (see also [88]). Therefore, especially for peaks with small intensity (and thus less distinct asymmetry), such an approach may lead to an erroneous determination of the peak position. Thus, we consider that the single peak fits performed above reliably describe the micromechanical behavior of the γ phase. In addition, performing a two-phase peak fit (following the approach shown in Fig. 12) using peaks with large diffraction intensities, enables us to further understand how the interior and wall of the cells behave upon external load. Consequently, the two-phase peak fit was performed using the 200-peak of V0° and H0° (Fig. 13). For V0° both regions (cell wall and cell interior) behave similarly in the elastic regime and at the early stages of plasticity, where the {220} transfers load to the {200}. At larger plastic strains, the peak asymmetry increases, i.e. the γ − 200 does not accumulate significant lattice strain, while the γ* − 200 continues to build up lattice strain with applied load. This indicates that the cell interior transfers load to the cell wall during deformation and could be explained by the motion of dislocations from the cell interior to the cell wall. This scenario is corroborated by the increase of the full width at half maximum (FWHM) of γ* − 200 observed after unloading of V0° in the plastic region (Fig. 14). While the γ − 200 peak, corresponding to the cell interior, exhibits only a minor increase in the FWHM, the increase is much larger for γ* − 200 in the plastic region. Rielli et al. [28] have shown the presence of dislocations within the cell interior (referred to as the interdendritic core) in non-deformed as-built L-PBF Inconel 718. In the deformed case using TEM, Wang et al. [89] have shown that for L-PBF 316L, possessing a similar cellular substructure, dislocation trapping and retention mechanisms occur at the cell wall of material deformed to 3% tensile strain. It is therefore hypothesized that the enhanced relative increase of the FWHM for the cell wall originates from these dislocation mechanisms.

Behavior of the 200-peak for the cell interior (γ) and the cell wall (γ*) for the specimens V0° (a) and H0° (b)

Full width at half maximum (FWHM) at the unloads of the specimen V0° and H0° for the cell interior (γ), the cell wall (γ*), and the performed single peak fit (single γ) of the 200-reflection
The single γ − 200 peak fit does not fully capture the interior-to-wall dislocation behavior, as the cell wall is only a minor contributor to the peak shape. The lack of deconvolution may also explain the significant nonlinearity of the Pawley refinement of V0°: it indicates that load partitioning from another phase occurs [64]. Interestingly, such a load transfer from cell interior to cell walls is not observed in H0°: both peaks behave similarly upon loading (Fig. 13b). In fact, when comparing the FWHM at the unload positions within the deformation sequence for γ* − 200 of H0° (Fig. 14), the relative increase is less pronounced compared to V0°. This may be an effect of the cell morphology along the load directions and the texture (pure [001]-type in H0°), as both determine the motion of dislocations during plastic deformation. Future work is planned to test this hypothesis for the peak asymmetry and the analysis of intragranular misfit strains associated with the deformation of the cellular microstructure.
Conclusions
This work reports the influence of the texture and build orientation on the mechanical properties and load transfer mechanisms of as-built laser powder bed fused Inconel 718. The scanning strategy was employed to alter the crystallographic texture with respect to the loading direction of the specimens: 0°, and 45° rotation of the scanning vectors to the longitudinal direction were employed. Moreover, specimens within different build jobs were tested (horizontal and vertical variants). The consequences of the different grain morphology and the crystallographic texture were studied at the macroscopic and the microscopic scale.
The following conclusions can be drawn:
-
The variation of the scanning strategy leads to a significant change in texture for the horizontal variant: the alignment of the scan vector parallel to one geometrical axis leads to an [001]-type texture along such axis. Instead, by rotating the scan vectors 45° to the geometrical axes, an [011]/[\(\overline{1} {\text{11}}\)]-type texture is obtained.
-
On the macroscopic scale, the different yield strength in the vertical (635 MPa) and horizontal specimen (725 MPa) can be attributed to possible differences in the dislocation density and in the grain structure. The further increase of the yield strength for the rotation of the scanning vectors by 45° (814 MPa) can be explained by the difference in texture.
-
On the microscopic scale the elastic behavior is well described by the Reuss grain interaction model (isostress). Furthermore, the plane-specific diffraction elastic moduli are (apart from the {220} lattice plane family) broadly unaffected by the variations of texture with respect to the loading direction.
-
Upon yielding, several load partitioning scenarios among the different lattice planes were observed as a consequence of the range of crystallographic texture. For the specimens with an [001]-type texture the load transfers from the {220} to the {200} lattice plane family during deformation, while it is transferred to the {311} in presence of an [011]/[\(\overline{1} {\text{11}}\)]-type texture. In fact, the difference in load partitioning also affects the accumulation of micro residual strains in a comparable manner.
-
A possible explanation for the diffraction peak asymmetry observed in both X-ray and neutron diffraction data has been provided. This explanation, corroborated by the existing literature, is based on niobium and molybdenum segregation accompanied by the presence of dislocation entanglement at the cell walls.
Data availability
The datasets generated during and/or analyzed during the current study are available from the corresponding author on reasonable request.
References
Emmelmann C, Kranz J, Herzog D, Wycisk E (2013) Laser additive manufacturing of metals. Biol Med Phys Biomed. https://doi.org/10.1007/978-3-642-41341-4_6
Kruth JP, Froyen L, Van Vaerenbergh J, Mercelis P, Rombouts M, Lauwers B (2004) Selective laser melting of iron-based powder. J Mater Process Tech 149:616–622. https://doi.org/10.1016/j.jmatprotec.2003.11.051
Mercelis P, Kruth JP (2006) Residual stresses in selective laser sintering and selective laser melting. Rapid Prototyp J 12:254–265. https://doi.org/10.1108/13552540610707013
Yadroitsev I, Yadroitsava I (2015) Evaluation of residual stress in stainless steel 316L and Ti6Al4V samples produced by selective laser melting this paper investigates the residual stress distribution in SLM-made parts and suggests thermal gradient control strategies. Virtual Phys Prototy 10:67–76. https://doi.org/10.1080/17452759.2015.1026045
Lai WJ, Ojha A, Li Z, Engler-Pinto C, Su XM (2021) Effect of residual stress on fatigue strength of 316L stainless steel produced by laser powder bed fusion process. Prog Addit Manuf 6:375–383. https://doi.org/10.1007/s40964-021-00164-8
Gorelik M (2017) Additive manufacturing in the context of structural integrity. Int J Fatigue 94:168–177. https://doi.org/10.1016/j.ijfatigue.2016.07.005
Yadollahi A, Shamsaei N (2017) Additive manufacturing of fatigue resistant materials: challenges and opportunities. Int J Fatigue 98:14–31. https://doi.org/10.1016/j.ijfatigue.2017.01.001
Khorasani M, Ghasemi A, Rolfe B, Gibson I (2021) Additive manufacturing a powerful tool for the aerospace industry. Rapid Prototyp J 28(1):87–100. https://doi.org/10.1108/Rpj-01-2021-0009
Emmelmann C, Sander P, Kranz J, Wycisk E (2011) Laser additive manufacturing and bionics: redefining lightweight design. Physcs Proc 12:364–368. https://doi.org/10.1016/j.phpro.2011.03.046
Gallmeyer TG, Moorthy S, Kappes BB, Mills MJ, Amin-Ahmadi B, Stebner AP (2020) Knowledge of process-structure-property relationships to engineer better heat treatments for laser powder bed fusion additive manufactured Inconel 718. Addit Manuf 31:100977. https://doi.org/10.1016/j.addma.2019.100977
Amato KN, Gaytan SM, Murr LE, Martinez E, Shindo PW, Hernandez J, Collins S, Medina F (2012) Microstructures and mechanical behavior of Inconel 718 fabricated by selective laser melting. Acta Mater 60:2229–2239. https://doi.org/10.1016/j.actamat.2011.12.032
Caiazzo F, Alfieri V, Corrado G, Argenio P (2017) Laser powder-bed fusion of inconel 718 to manufacture turbine blades. Int J Adv Manuf Tech 93:4023–4031. https://doi.org/10.1007/s00170-017-0839-3
Calandri M, Yin S, Aldwell B, Calignano F, Lupoi R, Ugues D (2019) Texture and microstructural features at different length scales in inconel 718 produced by selective laser melting. Materials 12(8):1293. https://doi.org/10.3390/ma12081293
Deng DY, Peng RL, Brodin H, Moverare J (2018) Microstructure and mechanical properties of Inconel 718 produced by selective laser melting: sample orientation dependence and effects of post heat treatments. Mater Sci Eng, A 713:294–306. https://doi.org/10.1016/j.msea.2017.12.043
Bean GE, McLouth TD, Witkin DB, Sitzman SD, Adams PM, Zaldivar RJ (2019) Build orientation effects on texture and mechanical properties of selective laser melting inconel 718. J Mater Eng Perform 28:1942–1949. https://doi.org/10.1007/s11665-019-03980-w
Brenne F, Taube A, Pröbstle M, Neumeier S, Schwarze D, Schaper M, Niendorf T (2016) Microstructural design of Ni-base alloys for high-temperature applications: impact of heat treatment on microstructure and mechanical properties after selective laser melting. Prog Addit Manuf 1:141–151. https://doi.org/10.1007/s40964-016-0013-8
Tucho WM, Cuvillier P, Sjolyst-Kvemeland A, Hansen V (2017) Microstructure and hardness studies of Inconel 718 manufactured by selective laser melting before and after solution heat treatment. Mater Sci Eng, A 689:220–232. https://doi.org/10.1016/j.msea.2017.02.062
Cozar R, Pineau A (1973) Morphology of γ’ and γ’’ precipitates and thermal-stability of inconel 718 type alloys. Metall Mater Trans A 4:47–59. https://doi.org/10.1007/Bf02649604
Tharappel JT, Babu J (2018) Welding processes for inconel 718-A brief review. IOP Conf Ser: Mater Sci Eng 330:012082. https://doi.org/10.1088/1757-899x/330/1/012082
Lingenfelter A (1989) Welding of Inconel Alloy 718: A Historical Overview. The Minerals, Metals & Materials Society Superalloy 718 Metallurgy and Applications: 673–683. https://doi.org/10.7449/1989/Superalloys_1989_673_683
Collier JP, Song HW, Phillips JC, Tien JK (1988) The effect of varying Al, Ti, and Nb content on the phase-stability of inconel-718. Metall Trans A 19:1657–1666. https://doi.org/10.1007/Bf02645133
Paulonis DF, Oblak JM, Duvall DS (1969) Precipitation in nickel-base alloy 718. ASM Trans Quart 62:611–622
Sundararaman M, Mukhopadhyay P, Banerjee S (1992) Some aspects of the precipitation of metastable intermetallic phases in inconel-718. Metall Mater Trans A 23:2015–2028. https://doi.org/10.1007/Bf02647549
Wang XQ, Chou K (2017) Electron backscatter diffraction analysis of inconel 718 parts fabricated by selective laser melting additive manufacturing. Jom-Us 69:402–408. https://doi.org/10.1007/s11837-016-2198-1
Ni M, Chen C, Wang XJ, Wang PW, Li RD, Zhang XY, Zhou KC (2017) Anisotropic tensile behavior of in situ precipitation strengthened Inconel 718 fabricated by additive manufacturing. Mater Sci Eng, A 701:344–351. https://doi.org/10.1016/j.msea.2017.06.098
Serrano-Munoz I, Fritsch T, Mishurova T et al (2021) On the interplay of microstructure and residual stress in LPBF IN718. J Mater Sci 56:5845–5867. https://doi.org/10.1007/s10853-020-05553-y
Piglione A, Attard B, Rielli VV, Santos Maldonado C-T, Attallah MM, Primig S, Pham M-S (2021) On the constitutive relationship between solidification cells and the fatigue behaviour of IN718 fabricated by laser powder bed fusion. Addit Manuf 47:102347. https://doi.org/10.1016/j.addma.2021.102347
Rielli VV, Piglione A, Pham M-S, Primig S (2022) On the detailed morphological and chemical evolution of phases during laser powder bed fusion and common post-processing heat treatments of IN718. Addit Manuf 50:102540. https://doi.org/10.1016/j.addma.2021.102540
Wan HY, Zhou ZJ, Li CP, Chen GF, Zhang GP (2018) Effect of scanning strategy on grain structure and crystallographic texture of Inconel 718 processed by selective laser melting. J Mater Sci Technol 34:1799–1804. https://doi.org/10.1016/j.jmst.2018.02.002
Gokcekaya O, Ishimoto T, Hibino S, Yasutomi J, Narushima T, Nakano T (2021) Unique crystallographic texture formation in Inconel 718 by laser powder bed fusion and its effect on mechanical anisotropy. Acta Mater 212:116876. https://doi.org/10.1016/j.actamat.2021.116876
Nadammal N, Cabeza S, Mishurova T et al (2017) Effect of hatch length on the development of microstructure, texture and residual stresses in selective laser melted superalloy Inconel 718. Mater Des 134:139–150. https://doi.org/10.1016/j.matdes.2017.08.049
Chalmers B (1964) Principles of solidification. Wiley, New York
Du DF, Dong AP, Shu D, Zhu GL, Sun BD, Li X, Lavernia E (2019) Influence of build orientation on microstructure, mechanical and corrosion behavior of Inconel 718 processed by selective laser melting. Mater Sci Eng, A 760:469–480. https://doi.org/10.1016/j.msea.2019.05.013
Liu SY, Li HQ, Qin CX, Zong R, Fang XY (2020) The effect of energy density on texture and mechanical anisotropy in selective laser melted Inconel 718. Mater Des 191:108642. https://doi.org/10.1016/j.matdes.2020.108642
Sangid MD, Book TA, Naragani D et al (2018) Role of heat treatment and build orientation in the microstructure sensitive deformation characteristics of IN718 produced via SLM additive manufacturing. Addit Manuf 22:479–496. https://doi.org/10.1016/j.addma.2018.04.032
Schröder J, Mishurova T, Fritsch T et al (2021) On the influence of heat treatment on microstructure and mechanical behavior of laser powder bed fused Inconel 718. Mater Sci Eng, A 805:140555. https://doi.org/10.1016/j.msea.2020.140555
Wang ZQ, Stoica AD, Ma D, Beese AM (2016) Diffraction and single-crystal elastic constants of Inconel 625 at room and elevated temperatures determined by neutron diffraction. Mater Sci Eng, A 674:406–412. https://doi.org/10.1016/j.msea.2016.08.010
Capek J, Polatidis E, Knapek M, Lyphout C, Casati N, Pederson R, Strobl M (2021) The effect of γ and δ phase precipitation on the mechanical properties of inconel 718 manufactured by selective laser melting: an in situ neutron diffraction and acoustic emission study. Jom-Us 73:223–232. https://doi.org/10.1007/s11837-020-04463-3
Schröder J, Evans A, Mishurova T et al (2021) Diffraction-based residual stress characterization in laser additive manufacturing of metals. Metals 11(11):1830. https://doi.org/10.3390/met11111830
Mishurova T, Bruno G, Evsevleev S, Sevostianov I (2020) Determination of macroscopic stress from diffraction experiments: a critical discussion. J Appl Phys 128:025103. https://doi.org/10.1063/5.0009101
Hollmann A, Meixner M, Klaus M, Genzel C (2021) Concepts for nondestructive and depth-resolved X-ray residual stress analysis in the near-surface region of nearly single crystalline materials with mosaic structure. J Appl Crystallogr 54:22–31. https://doi.org/10.1107/S1600576720014016
Dölle H, Hauk V (1978) Influence of mechanical anisotropy of polycrystal (texture) upon stress evaluation by means of X-rays. Z Metallkd 69:410–417
Dölle H, Hauk V (1979) Evaluation of residual-stresses in textured materials by X-rays. Z Metallkd 70:682–685
Behnken H, Hauk V (1991) Calculation of X-ray stress factors of textured materials - comparison with experimental results. Z Metallkd 82:151–158
Clausen B, Leffers T, Lorentzen T (2003) On the proper selection of reflections for the measurement of bulk residual stresses by diffraction methods. Acta Mater 51:6181–6188. https://doi.org/10.1016/j.actamat.2003.07.002
DIN-EN-15305 (2019) Non-destructive testing - Test method for residual stress analysis by X-ray diffraction. German Institute for Standardization. Berlin, Germany. doi: https://doi.org/10.31030/1425472
DIN-EN-ISO-21432 (2021) Non-destructive testing - Standard test method for determining residual stresses by neutron diffraction (ISO 21432:2019); German version EN ISO 21432:2020. German Institution for Standardization. Berlin, Germany. https://doi.org/10.31030/3202037
Choo H, Koehler MR, White LP, Ren Y, Morin D, Garlea E (2020) Influence of defect characteristics on tensile deformation of an additively manufactured stainless steel: evolutions of texture and intergranular strain. Mater Sci Eng, A 791:139637. https://doi.org/10.1016/j.msea.2020.139637
Mohr G, Sommer K, Knobloch T, Altenburg SJ, Recknagel S, Bettge D, Hilgenberg K (2021) Process induced preheating in laser powder bed fusion monitored by thermography and its influence on the microstructure of 316L stainless steel parts. Metals 11(7):1063. https://doi.org/10.3390/met11071063
Bachmann F, Hielscher R, Schaeben H (2011) Grain detection from 2d and 3d EBSD data-specification of the MTEX algorithm. Ultramicroscopy 111:1720–1733. https://doi.org/10.1016/j.ultramic.2011.08.002
Hielscher R, Silbermann CB, Schmidl E, Ihlemann J (2019) Denoising of crystal orientation maps. J Appl Crystallogr 52:984–996. https://doi.org/10.1107/S1600576719009075
Bunge HJ (1970) Some applications of the taylor theory of polycrystal plasticity. Krist Tech 5:145–175. https://doi.org/10.1002/crat.19700050112
DIN-50125 (2004) Testing of metallic materials - Tensile test pieces. German Institute for Standardization. Berlin, Germany.
DIN-EN-ISO-6892–1 (2019) Metallic materials –Tensile testing –Part 1: Method of test at room temperature (ISO/FDIS 6892–1:2019); German and English version prEN ISO 6892–1:2019. German Institution for Standardization. Berlin, Germany. https://doi.org/10.31030/3132591
DIN-EN-ISO-9513 (2013) Metallic materials - Calibration of extensometer systems used in uniaxial testing (ISO 9513:2012 + Cor. 1:2013); German version EN ISO 9513:2012. German Institution for Standardization. Berlin, Germany. doi: https://doi.org/10.31030/1912742
Heldmann A, Hoelzel M, Hofmann M et al (2019) Diffraction-based determination of single-crystal elastic constants of polycrystalline titanium alloys. J Appl Crystallogr 52:1144–1156. https://doi.org/10.1107/S1600576719010720
Paul-Scherrer-Institut (2021) Tensile sample M12. https://www.psi.ch/sites/default/files/styles/primer_full_xl/public/import/sinq/poldi/LoadFrameUniaxialEN/04_tensile_M12.jpg?itok=217Y6anp. Accessed 02 December 2021
Stuhr U (2005) Time-of-flight diffraction with multiple pulse overlap. part I: the concept. Nucl Instrum Meth A 545:319–329. https://doi.org/10.1016/j.nima.2005.01.320
Arnold O, Bilheux JC, Borreguero JM et al (2014) Mantid-Data analysis and visualization package for neutron scattering and mu SR experiments. Nucl Instrum Meth A 764:156–166. https://doi.org/10.1016/j.nima.2014.07.029
Stuhr U, Grosse M, Wagner W (2006) The TOF-strain scanner POLDI with multiple frame overlap-concept and performance. Mater Sci Eng, A 437:134–138. https://doi.org/10.1016/j.msea.2006.04.069
Stuhr U, Spitzer H, Egger J et al (2005) Time-of-flight diffraction with multiple frame overlap part II: the strain scanner POLDI at PSI. Nucl Instrum Meth A 545:330–338. https://doi.org/10.1016/j.nima.2005.01.321
Pawley GS (1981) Unit-cell refinement from powder diffraction scans. J Appl Crystallogr 14:357–361. https://doi.org/10.1107/S0021889881009618
Daymond MR, Priesmeyer HG (2002) Elastoplastic deformation of ferritic steel and cementite studied by neutron diffraction and self-consistent modelling. Acta Mater 50:1613–1626. https://doi.org/10.1016/S1359-6454(02)00026-5
Daymond MR, Bourke MAM, VonDreele RB, Clausen B, Lorentzen T (1997) Use of rietveld refinement for elastic macrostrain determination and for evaluation of plastic strain history from diffraction spectra. J Appl Phys 82:1554–1562. https://doi.org/10.1063/1.365956
Zhou L, Mehta A, McWilliams B, Cho K, Sohn Y (2019) Microstructure, precipitates and mechanical properties of powder bed fused inconel 718 before and after heat treatment. J Mater Sci Technol 35:1153–1164. https://doi.org/10.1016/j.jmst.2018.12.006
Xu JH, Ma TR, Peng RL, Hosseini S (2021) Effect of post-processes on the microstructure and mechanical properties of laser powder bed fused IN718 superalloy. Addit Manuf. 48B:102416. https://doi.org/10.1016/j.addma.2021.102416
Zhang S, Lin X, Wang L, Yu X, Hu Y, Yang H, Lei L, Huang W (2021) Strengthening mechanisms in selective laser-melted Inconel718 superalloy. Mater Sci Eng, A 812:141145. https://doi.org/10.1016/j.msea.2021.141145
Zhu ZG, Nguyen QB, Ng FL, An XH, Liao XZ, Liaw PK, Nai SML, Wei J (2018) Hierarchical microstructure and strengthening mechanisms of a CoCrFeNiMn high entropy alloy additively manufactured by selective laser melting. Scr Mater 154:20–24. https://doi.org/10.1016/j.scriptamat.2018.05.015
Dye D, Stone HJ, Reed RC (2001) Intergranular and interphase microstresses. Curr Opin Solid State Mater Sci 5:31–37. https://doi.org/10.1016/S1359-0286(00)00019-X
Kröner E (1958) Berechnung der elastischen konstanten des vielkristalls aus den konstanten des einkristalls. Z Phys 151:504–518. https://doi.org/10.1007/Bf01337948
Reuss A (1929) Account of the liquid limit of mixed crystals on the basis of the plasticity condition for single crystal. Z Angew Math Mech 9:49–58. https://doi.org/10.1002/zamm.19290090104
Aminforoughi B, Degener S, Richter J, Liehr A, Niendorf T (2021) A novel approach to robustly determine residual stress in additively manufactured microstructures using synchrotron radiation. Adv Eng Mater 23:2100184. https://doi.org/10.1002/adem.202100184
Ghorbanpour S, Zecevic M, Kumar A, Jahedi M, Bicknell J, Jorgensen L, Beyerlein IJ, Knezevic M (2017) A crystal plasticity model incorporating the effects of precipitates in superalloys: application to tensile, compressive, and cyclic deformation of Inconel 718. Int J Plasticity 99:162–185. https://doi.org/10.1016/j.ijplas.2017.09.006
Gnäupel-Herold T (2012) ISODEC: software for calculating diffraction elastic constants. J Appl Crystallogr 45:573–574. https://doi.org/10.1107/S0021889812014252
Haldipur P, Margetan FJ, Thompson RB (2004) Estimation of single-crystal elastic constants from ultrasonic measurements on polycrystalline specimens. Rev Prog Q 23:1061–1068
Wagner JN, Hofmann M, Wimpory R, Krempaszky C, Stockinger M (2014) Microstructure and temperature dependence of intergranular strains on diffractometric macroscopic residual stress analysis. Mater Sci Eng, A 618:271–279. https://doi.org/10.1016/j.msea.2014.09.033
Chen W, Voisin T, Zhang Y, Forien J-B, Spadaccini CM, McDowell DL, Zhu T, Wang YM (2019) Microscale residual stresses in additively manufactured stainless steel. Nat Commun 10:4338. https://doi.org/10.1038/s41467-019-12265-8
Tucho WM, Hansen V (2021) Studies of post-fabrication heat treatment of L-PBF-Inconel 718: effects of hold time on microstructure, annealing twins, and hardness. Metals 11(2):266. https://doi.org/10.3390/met11020266
Ferreri NC, Vogel SC, Knezevic M (2020) Determining volume fractions of γ, γ′, γ″, δ, and MC-carbide phases in Inconel 718 as a function of its processing history using an advanced neutron diffraction procedure. Mater Sci Eng, A 781:139228. https://doi.org/10.1016/j.msea.2020.139228
Liu WC, Yao M, Chen ZL, Wang SG (1999) Niobium segregation in Inconel 718. J Mater Sci 34:2583–2586. https://doi.org/10.1023/A:1004648615561
Dehmas M, Lacaze J, Niang A, Viguier B (2011) TEM study of high-temperature precipitation of delta phase in inconel 718 alloy. Adv Mater Sci Eng 2011:940634. https://doi.org/10.1155/2011/940634
Gruber K, Smolina I, Kasprowicz M, Kurzynowski T (2021) Evaluation of inconel 718 metallic powder to optimize the reuse of powder and to improve the performance and sustainability of the laser powder bed fusion (LPBF) process. Materials 14(6):1538. https://doi.org/10.3390/ma14061538
Parimi LL, RG A, Clark D, Attallah MM (2014) Microstructural and texture development in direct laser fabricated IN718. Mater Charact 89:102–111. https://doi.org/10.1016/j.matchar.2013.12.012
Schmeiser F, Krohmer E, Wagner C, Schell N, Uhlmann E, Reimers W (2021) In situ microstructure analysis of inconel 625 during laser powder bed fusion. J Mater Sci 57:9663–9677. https://doi.org/10.1007/s10853-021-06577-8
Levine LE, Geantil P, Larson BC, Tischler JZ, Kassner ME, Liu WJ (2012) Validating classical line profile analyses using microbeam diffraction from individual dislocation cell walls and cell interiors. J Appl Crystallogr 45:157–165. https://doi.org/10.1107/S0021889812001616
Levine LE, Larson BC, Yang W, Kassner ME, Tischler JZ, Delos-Reyes MA, Fields RJ, Liu WJ (2006) X-ray microbeam measurements of individual dislocation cell elastic strains in deformed single-crystal copper. Nat Mater 5:619–622. https://doi.org/10.1038/nmat1698
Withers PJ, Bhadeshia HKDH (2001) Residual stress. part 2 – nature and origins. Mater Sci Technol 17:366–375. https://doi.org/10.1179/026708301101510087
Pinto HC, Bruno G (2003) Formation and relaxation of coherency strain in the nickel-base superalloy SC16. J Synchrotron Radiat 10:148–153. https://doi.org/10.1107/S0909049502019076
Wang YM, Voisin T, McKeown JT et al (2018) Additively manufactured hierarchical stainless steels with high strength and ductility. Nat Mater 17:63–71. https://doi.org/10.1038/Nmat5021
Acknowledgements
The authors kindly acknowledge the support of Benjamin Piesker (BAM) with the microstructural preparation of the samples and Romeo Saliwan-Neumann (BAM) for the acquisition of EBSD data. Furthermore, Luis A. Ávila C. (BAM) and Benjamin Piesker are acknowledged for conducting the ex situ tensile tests. We want to also acknowledge Alexander Ulbricht (BAM) for acquisition and analysis of the X-ray computed tomography data. In addition, we want to thank Matthias Meixner (HZB) who carried out the surface X-ray measurements. We acknowledge the Paul Scherrer Institut, Villigen, Switzerland for the provision of neutron beamtime at the instrument POLDI of the SINQ under the proposal numbers 20202019 and 20202296. This work has been partially funded by the BAM internal project AGIL.
Funding
Open Access funding enabled and organized by Projekt DEAL.
Author information
Authors and Affiliations
Contributions
JS, GB, AE and ISM contributed to conceptualization; JS, JC and EP performed data curation; JS carried out formal analysis; JS, JC, EP and GM performed investigation; JS, GM and AE provided methodology; GB and AE performed project administration; GB, JC and EP provided resources; JS, AE and GB performed supervision; JS performed visualization and writing—original draft; JS, ISM and AE performed validation; JS, AE, ISM, JC, EP, GB and GM performed writing—review and editing.
Corresponding authors
Ethics declarations
Conflict of interest
The authors declare that there are no conflicts of interest.
Additional information
Handling Editor: Sophie Primig.
Publisher's Note
Springer Nature remains neutral with regard to jurisdictional claims in published maps and institutional affiliations.
Supplementary Information
Below is the link to the electronic supplementary material.
Rights and permissions
Open Access This article is licensed under a Creative Commons Attribution 4.0 International License, which permits use, sharing, adaptation, distribution and reproduction in any medium or format, as long as you give appropriate credit to the original author(s) and the source, provide a link to the Creative Commons licence, and indicate if changes were made. The images or other third party material in this article are included in the article's Creative Commons licence, unless indicated otherwise in a credit line to the material. If material is not included in the article's Creative Commons licence and your intended use is not permitted by statutory regulation or exceeds the permitted use, you will need to obtain permission directly from the copyright holder. To view a copy of this licence, visit http://creativecommons.org/licenses/by/4.0/.
About this article

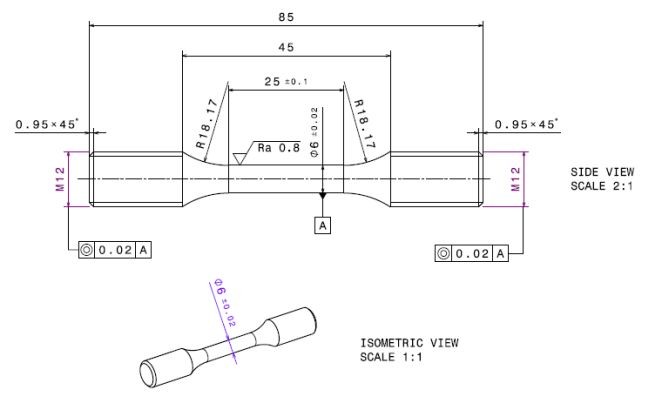
Cite this article
Schröder, J., Evans, A., Polatidis, E. et al. Understanding the impact of texture on the micromechanical anisotropy of laser powder bed fused Inconel 718. J Mater Sci 57, 15036–15058 (2022). https://doi.org/10.1007/s10853-022-07499-9
Received:
Accepted:
Published:
Issue Date:
DOI: https://doi.org/10.1007/s10853-022-07499-9