
Abstract
Objective
The aim of this study was to evaluate the efficacy and safety of the biosimilar candidate of adalimumab (HS016) compared with adalimumab (Humira) for the treatment of active ankylosing spondylitis.
Methods
A multicenter, randomized, double-blind, parallel, positive control, phase III clinical trial was conducted at 28 locations in China. Patients with active ankylosing spondylitis were randomized in a 2:1 ratio to subcutaneously receive 40 mg of either HS016 or adalimumab every other week for 24 weeks. The primary endpoint was to achieve at least a 20% improvement (ASAS20) in patients at 24 weeks according to the Assessment of Spondyloarthritis International Society criteria. The secondary endpoint included other efficacy assessment parameters, health evaluations, safety, pharmacokinetic, and immunogenicity parameters.
Results
Following the random assignment of 648 patients into HS016 (n = 416) and adalimumab (n = 232) groups, no significant difference was found in the ASAS20 response rates at 24 weeks between the HS016 (364/416, 87.5%) and adalimumab (209/232, 90.1%) treatments and the difference between the response rates (− 2.59%; 90% confidence interval [CI] − 6.77 to 1.60) was within the predefined equivalence margin (± 15%). There were also no significant differences when the secondary endpoints were compared (all p > 0.05). Similarly, the rates of treatment-emergent adverse events (TEAEs) were not significantly different between the two groups, with most TEAEs being mild to moderate. Only nine severe cases were found, including seven within the HS016 group, three (0.7%) of which were tuberculosis cases. Plasma concentrations of HS016 and adalimumab from weeks 12 to 14 were similar during the steady-state period and steady-state maximal concentration (Cmax,ss) was equivalent for HS016 (7356.6 ng/mL) and adalimumab (7600.3 ng/mL). The accumulated proportion of patients with positive human anti-human antibodies (HAHAs) at week 24 was 326/412 (79.1%) in the HS016 group and 183/229 (79.9%) in the adalimumab group (p > 0.05), while the accumulated proportion of patients with positive neutralizing antibody (NAb) tests were 72/412 (17.5%) in the HS016 group and 43/229 (18.8%) in the adalimumab group (p > 0.05).
Conclusion
HS016 resembled adalimumab in efficacy and safety over the 24-week treatment period.
Trial registration number
ChiCTR1900022520.
Adalimumab is a monoclonal immunoglobulin G1-kappa isotype (IgG1-κ) antibody approved for the treatment of ankylosing spondylitis (AS). |
In this multicenter, randomized, double-blind, parallel, positive control, phase III clinical trial carried out at 28 centers in China, patients with active AS received HS016 or adalimumab treatment. There were no differences between HS016 and adalimumab in terms of ASAS20 response rates, pharmacokinetic or immunogenic parameters, or treatment-emergent adverse events during the 24-week study period. |
HS016 was similar to adalimumab in efficacy and safety. HS016 is a useful alternative to adalimumab for the treatment of AS. |
1 Introduction
Ankylosing spondylitis (AS) is a chronic rheumatic disease that is characterized by inflammatory changes to the sacroiliac joints and spine, resulting in progressive structural damage and reduced function and quality of life [1]. AS has also been termed radiographic axial spondyloarthritis (axSpA) and non-radiographic axSpA according to the new Assessment of SpondyloArthritis International Society (ASAS) criteria [2, 3]. Non-steroidal anti-inflammatory drugs (NSAIDs) are the first-line treatment option for AS patients, followed by conventional synthetic disease-modifying antirheumatic drugs (csDMARDs) including methotrexate, leflunomide, sulfasalazine, hydroxychloroquine, azathioprine, cyclosporine, cyclophosphamide, auranofin, penicillamine, and thalidomide, which are generally not effective in the treatment of axial manifestations of spondyloarthritis, but csDMARDs are effective for particular cases of peripheral AS. In contrast, biological DMARDs, such as anti-tumor necrosis factor-alpha (TNFα) inhibitors and interleukin-17 antagonists, can elicit overall articular manifestation improvements, C-reactive protein (CRP) levels, and MRI-detectable inflammation in the sacroiliac joints or spine in AS patients after failed NSAID treatments [2]. Also, for patients with persistently high ongoing disease activity despite conventional treatments, anti-tumor TNFα therapy is recommended for AS patients [4].
Adalimumab is a fully human monoclonal antibody that binds to and neutralizes TNFα [5]. Adalimumab has demonstrated improvement in clinical signs and symptoms, physical function, and health-related quality of life in patients with active AS [6,7,8,9,10]. However, the high cost of an adalimumab regimen limits its use for AS patients on low incomes. As an alternative, adalimumab biosimilars at a lower cost have been developed and are expected to benefit more AS patients with limited incomes and also healthcare systems in general since some countries provide biologics at no cost to patients [11].
HS016 is a biosimilar candidate of adalimumab and is related to the human IgG1 antibody (approximately 148 kDa) and has virtually the same amino acid sequence as adalimumab. The results of structural stability, pharmacodynamics (PD), pharmacokinetics (PK), and safety (data not shown) in preclinical studies have verified that HS016 is indeed similar to adalimumab.
Herein, we present the results of a multicenter, randomized, double-blind, and parallel, positive control, phase III clinical trial comparing outcomes following treatment with HS016 or adalimumab for 24 weeks in patients with active AS. Our objective was to validate the equivalence of the adalimumab biosimilar candidate, HS016, to the reference, adalimumab, in terms of efficacy and safety, as well as from the results of post-treatment Health Assessment Questionnaires for spondyloarthropathies, PK assessments including drug plasma concentrations (area under the plasma drug-concentration–time curve [AUCτ] and steady-state maximal concentration [Cmax,ss]), and human anti-human antibody (HAHA) and neutralizing antibody (NAb) developments.
2 Patients and Methods
2.1 Study Design
A randomized, double-blind, positive control, multicenter clinical trial was conducted in 28 centers across China. This trial was designed according to the regulations of the Chinese Center for Drug Evaluation. Patients were randomly assigned to HS016 or adalimumab (Humira, Abbvie Ltd, Maidenhead, UK) groups at a ratio of 2:1. Furthermore, HS016 or adalimumab were injected subcutaneously (40 mg in 0.8 mL) once every 2 weeks for 24 weeks (Supplementary Figure 1, see electronic supplementary material [ESM]). The study was performed in accordance with Good Clinical Practice and Provisions for Drug Registration issued by the National Medical Products Administration, and the guidelines in the Declaration of Helsinki for research on humans. The study protocol and all amendments were reviewed by the independent ethics committee at each center and all patients provided written informed consent. This trial is registered with the Chinese Clinical Trial Registry (ChiCTR), number ChiCTR1900022520.
2.2 Study Population
Patients aged 18–65 years with active AS fulfilling the 1984 modified New York classification criteria [12], as well as patients who were refractory to more than one type of NSAIDs or DMARDs during standard treatment for > 4 weeks were enrolled. Inclusion criteria were a body mass index ≥ 20 kg/m2 and ≤ 28 kg/m2 and a bodyweight ≥ 50 kg and ≤ 85 kg, and at least one of the following: (1) a Bath Ankylosing Spondylitis Disease Activity Index (BASDAI) score ≥ 4 (range 0–10 cm); (2) a visual analog scale (VAS) score for total back pain ≥ 4 (range 0–10 cm); and (3) morning stiffness duration ≥ 1 hour. Patients with complete spinal rigidity (fusion), those who underwent spinal or joint surgery within 24 weeks of the study, and those who received anti-TNFα agents within 12 weeks of randomization were excluded from the study. Interferon Gamma Release Assay (IGRA) tests were performed for the detection of latent tuberculosis. For details of the inclusion and exclusion criteria, see Supplementary Appendix 1 in the ESM.
2.3 Randomization and Masking
For this trial, a randomized, double-blind design was employed to ensure that researchers and patients were blinded to the trial grouping. It consisted of a stratified block randomization method with a block size of 6, which allocated the experimental and the control groups according to a 2:1 ratio. Stratification factors included age (< 40 years, ≥ 40 years) and CRP (< 28 mg/L, ≥ 28 mg/L) in addition to the center. A project random list was generated by a third-party contract research organization (CRO), which contained treatment groups and random numbers. The random table was loaded into the Central Random System (IWRS). After each test center determined that the patients met the inclusion criteria, patients were randomized through the IWRS system and a random number assigned. The IWRS provided the patient’s random and drug numbers based on the randomized treatment group and the test center administered the medication to the patient based on the drug number. The IWRS system did not directly provide treatment group information.
2.4 Assessments
The primary endpoint was the proportion of patients who achieved a 20% improvement from baseline according to the Assessment of Spondyloarthritis International Society criteria (ASAS20) at week 24 [13]. The secondary endpoints were an ASAS20 response rate at week 12, ASAS40, ASAS5/6 response rates, BASDAI 50% improvement and severity of morning stiffness assessed at weeks 12 and 24. Health-evaluation endpoints included improvement in the results of the Health Assessment Questionnaire for spondyloarthropathies (HAQ-S) and Short-Form 36 Health Survey version 2 (SF-36V2) at weeks 12 and 24. Safety assessments included monitoring of vital signs, clinical laboratory abnormalities, and adverse events (AEs), serious AEs (SAEs) and treatment-emergent AEs (TEAEs). Significant AEs were defined as AEs besides SAEs that led to the use of targeted medical treatments, combined treatments, and/or termination of involvement in the trial.
The primary endpoints in the PK profile were the AUCτ and Cmax,ss. PK assessments also involved measuring HS016 and adalimumab plasma concentrations during the steady-state period (12–14 weeks of treatment) and other PK parameters. The PK parameters of subgroups positive and negative for HAHA and NAbs were also determined.
2.5 Immunogenicity Tests
Bridging ElectroChemiLuminescence Immunoassay assay (ECLIA) was used to detect HAHAs, which consisted of screening and immunosuppression confirmation. Screening tests were used to detect HAHA positivity and the signal-to-noise ratio (S/N) of samples was used for data analyses. When the S/N was greater than or equal the screening cut point (SCP), the samples were further tested for immunosuppression. In this confirmatory test, sufficient amounts of the drug were added to the screening positive samples (if necessary, the sample could be appropriately diluted during the confirmatory test) for signal suppression, and the sample was determined to be HAHA positive (MSD QuickPlex SQ120, Meso Scale Discovery Inc., MD, USA) if the sample showed an immune-depletion of the soluble drug. Finally, HAHA-positive samples were quantified and measured for NAbs, which was based on the principle that L-929 cells were highly sensitive to the killing and inhibition of rhTNF activity under the action of actinomycin D. If there were no NAbs (Nab negative) in the sample, then the tested drug could neutralize the killing and inhibitory effect of rhTNF on L-929 cells so that they could grow and proliferate normally. The ATP content of living cells was quantified after 20 hours of culture, and the relative luminescence units (RLU) read on a Gen5 Secure v2.04 (BioTek Instrument Inc., VT, USA) was high. If the samples tested were Nab positive, the RLU value was low.
2.6 Statistical Analysis
Based on the instructions for adalimumab and relevant clinical studies, the ASAS20 response rate in patients with active AS at week 24 after adalimumab treatment should be 51%, and the placebo group should reach 19% [7, 9]. Therefore, the ASAS20 rate at week 24 for this study was expected to be 50%, with a boundary value of 15% ([drug group − placebo group]/2, approximately 16%). To determine whether the effects of adalimumab and HS016 were equivalent (indicated by a 90% confidence interval [CI]), we followed methodology from a previous study [14] and an agreement with Center for Drug Evaluation, National Medical Products Administration (NMPA) [15]. We aimed for results within an equivalence margin of ± 15%, with a two-sided α level of 0.05 and 90% power (experimental and control groups allocated at a 2:1 ratio); the required sample sizes of 362 and 181 were calculated for the HS016 group and adalimumab group, respectively. With an assumed dropout rate of 10%, the total sample size was set at 603; 402 in the HS016 group and 201 in the adalimumab group.
All efficacy endpoints were evaluated using the full analysis set, which included all participants with analysis based on treatment. A project randomization table (including treatment groups and randomization numbers) was generated by a third-party contract research organization and loaded into the interactive web-response system. The randomized, double-blind design ensured blinding of researchers, healthcare personnel, and patients to the grouping. For the primary endpoint, the Clopper–Pearson method was used to calculate the 95% CI for the proportion of patients who achieved the ASAS20 response rate. The differences in the compliance rate between the two groups and the 90% CI were then calculated with the equivalence test. If the 90% CI fell within the range − 0.15 to 0.15, it was considered to meet the equivalence standard. Predicted values generated from a mixed-effect model in repeated measurement (MMRM), and a covariance analysis model based on the last observation carried forward (LOCF), were used to fill in the missing data for VAS scores in the overall evaluation of disease activity, night back pain, total back pain, Bath Ankylosing Spondylitis Functional Index (BASFI), and morning stiffness or VAS scores related to BASDAI (last two items in BASDAI), which were used in derivative calculations of ASAS20 after treatment for 24 weeks. The Cochran–Mantel–Haenszel χ2 test considered the center effect used to compare any differences in the primary and secondary endpoints between the two groups. Importantly, the missing-data processing method for secondary endpoints was the same as that for the primary endpoint.
Safety data were analyzed using the safety set (SS). The incidence of TEAEs, SAEs, and significant AEs was carefully documented.
PK endpoints were summarized descriptively for the PK population, and a 90% CI within the range 80–125% was considered to meet the equivalence standard. A sample size of approximately 294 patients was chosen (with a random ratio of 2:1, 196 cases in the HS016 group and 98 cases in the adalimumab group) to achieve 80% power to demonstrate equivalence between the HS016 and adalimumab groups for the AUCτ and Cmax,ss values. All statistical analysis was carried out using SAS version 9.2 software (SAS, Cary, NC, USA). Notably, the scores changed before and after treatment, and each time point was compared using paired t tests. Independent sample t tests were also used to assess any differences between the two groups.
3 Results
3.1 Patient Disposition
A total of 1068 individuals were screened, of whom 419 did not meet the inclusion criteria or withdrew consent. Therefore, 649 patients were randomized, but only 648 received treatment. Of the 648 patients, 570 (87.8%) completed the trial, 362/416 (87.0%) for HS016 and 208/232 (89.7%) for adalimumab (Fig. 1). Withdrawal due to AEs occurred in the HS016 group (30 patients [7.2%]) and in the adalimumab group (13 patients [5.6%]). The PK population consisted of 297 patients (HS016, n = 188; adalimumab, n = 109). Medication adherence (actual dosage/planned dosage × 100) was 87.7% in the HS016 group and 90.5% in the adalimumab group for a medication adherence distribution of 80–120%, with strict compliance with treatment duration (160.41 ± 30.83 days and 162.21 ± 29.21 days for the HS016 and adalimumab treatments, respectively).
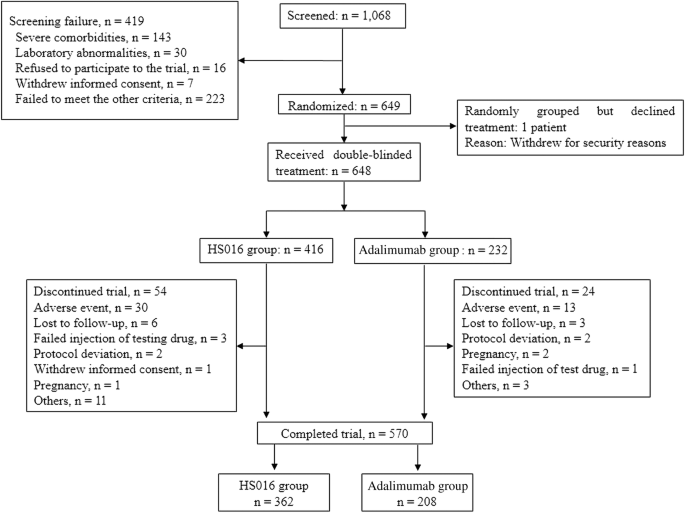
Flow of patient enrolment, randomization and trial inclusion. The reasons for patient withdrawal at each stage are shown
3.2 Baseline Demographics and Clinical Characteristics of Patients
Most patients in the HS016 (85.3%) and adalimumab (78.4%) groups were < 40 years old and mainly males (86.3% and 87.9%, respectively). The disease duration was 6.4 ± 5.2 and 6.5 ± 5.7 years for each group, respectively. Overall, baseline disease characteristics and health status scores were comparable between the two groups (Table 1).
3.3 Clinical Efficacy
3.3.1 ASAS20
The ASAS20 response rates at week 24 in the HS016 and adalimumab groups were 87.5% (364/416) and 90.1% (209/232), respectively (Fig. 2a). The risk difference between the two groups was − 2.59% (90% CI − 6.77 to 1.60, p = 0.324), which was within the pre-specified equivalence margin (± 15%). This finding demonstrated the clinical equivalence between HS016 and adalimumab. The ASAS20 response rates at week 12 were 79.6% (95% CI 75.4–83.3) in the HS016 group and 81.0% (95% CI 75.4–85.9) in the adalimumab group (Fig. 2b), with no significant difference between the groups (p = 0.654). The ASAS20 response rates increased with treatment duration from 46.4% (HS016) and 47.4% (adalimumab) after treatment at week 2. In the follow-up treatment, this rate continued to increase until week 12; this increasing tendency appeared to decline slightly until week 24. Overall, the proportion of ASAS20 response patients in both groups was similar at each time point examined.

ASAS20 response rates following HS016 or adalimumab treatment. a ASAS20 response rates at week 24. The RD 90% CI was within the pre-specified equivalence margin (± 15%), demonstrating clinical equivalence between HS016 and adalimumab. b Changes in ASAS20 response rates throughout 24 weeks of treatment. ASAS20 Assessment of Spondyloarthritis International Society criteria for a 20% improvement, CI confidence interval, RD ratio difference
3.3.2 Responses to Treatment
We evaluated the effectiveness of the treatment by assessing the response rates for ASAS40, ASAS5/6, and BASDAI improvement, severity of morning stiffness, and by using HAQ-S and SF-36V2 (physical component score [PCS] and mental component score [MCS]) (Table 2); these data were assessed at weeks 12 and 24. However, no significant differences were found in any of the variables between the HS016 and adalimumab groups at 12 or 24 weeks for ASAS40 and ASAS5/6 responses. Similarly, the proportion of patients with a BASDAI 50% improvement at 12 and 24 weeks was not significantly different between the two groups. A difference, however, existed between the two groups regarding the severity of morning stiffness, but at weeks 12 and 24 the trend did not reach statistical significance. A similar trend was found for the mean changes in HAQ-S compared with baseline, but similarly, statistical significance was not reached at 12 or 24 weeks between the HS016 and adalimumab groups. Lastly, the PCS and MCS scores were not significantly differ between the two groups at 12 and 24 weeks (Table 2). The response rates for ASAS40 and ASDAS-CRP were not significantly different between the HS016 and adalimumab groups throughout the 24 weeks of treatment (Fig. 3).

ASAS40 response rate (a) and ASDAS-CRP (b) throughout 24 weeks of treatments. ASAS40 40% improvement from baseline according to Assessment of Spondyloarthritis International Society criteria, ASDAS Ankylosing Spondylitis Disease Activity Score, CRP C-reactive protein
3.4 Safety
We detected 1573 TEAEs among 352/416 (84.6%) patients in the HS016 group, and 751 TEAEs among the 200/232 (86.2%) patients in the adalimumab group (Table 3). Most TEAEs associated with the drugs in the two groups were mild to moderate (260 [67.1%] HS016-treated patients and 152 [65.5%] adalimumab-treated patients), but some were considered to be severe (7 [1.7%] patients in the HS016 group, 3 of which were cases of tuberculosis, and 2 [0.9%] patients in the adalimumab group) (Supplementary Table 1, see ESM). No significant difference was found in the incidence of TEAEs related to the experimental drugs, or of SAEs or significant AEs between the two groups. Significant AEs with a high incidence rate were related to upper respiratory infection (URI), abnormal liver function, and nasopharyngitis.
Additionally, SAEs with the highest incidence were infectious diseases, accounting for 1.4% in the HS016 group and 1.3% in the adalimumab group. No deaths occurred during the trial period. The incidence of TEAEs leading to early patient withdrawal from the trial was 5.3% in the HS016 group and 6.5% in the adalimumab group. In addition, results of routine blood biochemistry and blood electrolyte measurements, urine tests, electrocardiography, vital-sign assessments, and physical examinations of patients in the HS016 group were similar to the safety results following adalimumab treatment; namely, either normal or abnormal, with no clinical significance (data not shown).
3.5 Immunogenicity
The proportion of patients who tested positive for HAHAs at each time point did not differ significantly between the two groups (Table 4). In fact, the accumulated proportion of patients with positive HAHAs at week 24 was 326 (79.1%) in the HS016 group and 183 (79.9%) in the adalimumab group. We also performed NAb tests in HAHA-positive patients and found that the accumulated proportions of patients who tested positive for NAbs at each time point were similar between the two groups. The number (proportion) of patients at week 24 was 72 (17.5%) in the HS016 group and 43 (18.8%) in the adalimumab group.
3.6 Pharmacokinetics
The PK population was 188:109, with a somewhat unbalanced proportion, and the expected number of 196 cases in the HS016 group was not achieved. We plotted the plasma concentrations of HS016 or adalimumab (following repeated subcutaneous injections of 40-mg doses) from week 12 to week 14 (Supplementary Figure 2a, see ESM). Here, we found that HS016 and adalimumab plasma concentrations were similar during the steady-state period. Notably, the steady state Cmax,ss was equivalent for HS016 (7356.6 ng/mL) and adalimumab (7600.3 ng/mL) (90% CI 82–116%), while the AUCτ (1,903,819.4 h·ng/mL and 1,993,029.9 h·ng/mL) were not equivalent in the overall PK population (90% CI 78–121%) (Supplementary Figure 2b, see ESM). The AUCτ and Cmax,ss (as well as average concentration at steady state [Cav,ss], minimum concentration at steady state [Cmin,ss], and half-life [t½]) values in the HAHA-positive population were approximately half the values found in the HAHA-negative population, with no significant differences between the HS016 and adalimumab groups (Supplementary Table 2, see ESM). Clearance rates in the HAHA-positive population were nearly twice those found in the HAHA-negative population. However, the clearance rates in the NAb-positive population in both groups were higher than those in the NAb-negative population, whereas the AUCτ and Cmax,ss in the NAb-positive population were approximately one-third of those in the NAb-negative population. Although the generation of HAHA increased the clearance rate in both groups, AUCτ, Cmax,ss, and other PK parameters were similar between the HS016 and adalimumab groups.
3.7 Correlations Between Anti-drug antibody (ADA) Titer, HAHA, NAb and ASAS20 Response Rates, Primary Pharmacokinetic Parameters and TEAEs
In order to find clinical responses according to the HAHA status, we analyzed the relationships between ADA titer and PK parameters, TEAEs, and the ASAS20 response rate at week 24. In the overall HAHA-positive patients, there were no significant differences between the HS016 and adalimumab groups regarding all included items, and also whether they had a high or low ADA titer. However, the PK parameters AUCτ and Cmax,ss were significantly lower within the HS016 and adalimumab groups when their intragroup ADA titers were high. In HAHA-negative patients, the ASAS20 response rate at week 24 was significantly higher in the adalimumab group compared with the HS016 group, whereas PK parameters and TEAEs were not significantly different in the two groups. However, there was no difference in clinical response, PK parameters, and TEAEs in the NAb-positive adalimumab and HS016 groups (Table 5).
4 Discussion
During the last few decades, the introduction of anti-TNFα medication has revolutionized the treatment of patients with AS [16], and adalimumab has been proven to be effective in reducing spinal and sacroiliac joint inflammation in various trials [6,7,8,9,10], but the development of biologic agents has contributed to an increase in healthcare costs. However, biosimilars of drugs that are no longer under patent protection have been rapidly developed [17] as they offer alternatives with greater affordability for patients and healthcare systems [11, 18]. It has been estimated that biosimilars might reduce healthcare-related costs by US$54 billion from 2017 to 2026 in the US alone [19]. Studies that aimed to introduce biosimilars for anti-TNFα medications included switching from an originator treatment to a biosimilar [20,21,22] and direct comparisons of the originator and biosimilar [14, 23]. An expert consensus has been published with five overarching principles and eight consensus recommendations for the use of biosimilars for the treatment of rheumatological diseases, which is based on a systematic literature review including abstracts and annual meetings of the American College of Rheumatology (ACR) and European League Against Rheumatism (EULAR) [24]. This study compared the efficacy and safety of the novel adalimumab biosimilar candidate, HS016, and adalimumab treatments for Chinese AS patients. We found no significant differences in efficacy and safety between the drugs. Similarly, the HAQ-S and SF-36 scores did not differ significantly between the treatment groups, suggesting similar quality-of-life improvements. ASAS20 response rates after one treatment dose (week 12) were 79.6% for HS016 and 81.0% for adalimumab and were without significant difference. The ASAS20 values were somewhat higher in the present trial compared with similar previous adalimumab AS treatment studies at 58.2% [9] and 67.2% [7]. The high response rate in our study might be attributed to the low proportion of patients previously treated with biological agents (Table 1). Compared with previous data in AS patients, the positive rate of HAHAs and NAbs was significantly higher in this study population, which might be attributed to the improved antibody detection method (Bridging-ECLIA) used in the present study. In addition, due to the cost in clinical practice, AS patients may first choose small molecule therapeutic drugs with acceptable efficacy, and few of the randomized patients had received TNFα inhibitors for AS treatment before, which might have had an influence on HAHA and NAb-positive rates. However, the comparison of effects of ADA titers and NAb-positive cases on ASAS20 response rates, primary PK parameters, and TEAEs showed that there was no significant difference between the adalimumab and HS016 groups, although the ADA titer volume showed effects in the intra group comparisons.
Similar to other TNFα inhibitors [9], we found that HS016 was generally well tolerated by patients with AS. In fact, most TEAEs were mild or moderate in severity and the incidence of SAEs was low, with 4.3% in the HS016 group and 2.6% in the adalimumab group. The rate of TEAEs and SAEs did not significantly differ between the two groups.
Cmax,ss was equivalent for HS016 and adalimumab (90% CI 82–116%), thereby satisfying the criteria set for the PK equivalence of HS016 versus adalimumab. However, the 90% CI for the AUCτ was 78–121%, but almost within the predefined margins of 80–125%, which may be related to the larger geometric CV% in both groups (165.92% in the HS016 group and 124.99% in the adalimumab group). The geometric means of AUCτ and Cmax,ss in the HAHA-negative subset of patients were higher than those in the overall PK population (Supplementary Table 2, Supplementary Figure 2, see ESM), which correlated with the results obtained with another biosimilar anti-TNFα drug (infliximab) for AS treatment [25].
Nocebo refers to effects complementary to placebo and have been proposed to be the causes of withdrawal of treatment due to adverse events in placebo-arm participants treated for rheumatic and musculoskeletal diseases (RMDs). In addition, lower biosimilar retention rates than in previous RCTs have been attributed to nocebo effects after transition from bio-originator to biosimilar therapeutics [26]. However, since in the present study the patients were blinded to their treatment drugs, a direct nocebo effect caused by awareness of treatment with a biosimilar could be excluded.
Limitations of the present study were the relative short treatment duration of 24 weeks, which did not capture long-term effects of the medications, and the short follow-up times, in addition to a generalization limitation and a lack of MRI as well as peripheral arthritis, enthesitis, uveitis, and other data.
5 Conclusions
An equivalent biosimilar (HS016) to the reference drug, adalimumab, was successfully assessed through an analysis of efficacy, safety, and immunogenicity. Based on our findings, HS016 should be considered as an affordable alternative for the treatment of Chinese patients with AS.
References
Braun J, Sieper J. Ankylosing spondylitis. Lancet. 2007;369(9570):1379–90. https://doi.org/10.1016/S0140-6736(07)60635-7.
Sieper J, Poddubnyy D. Axial spondyloarthritis. Lancet. 2017;390(10089):73–84. https://doi.org/10.1016/S0140-6736(16)31591-4.
Taurog JD, Chhabra A, Colbert RA. Ankylosing spondylitis and axial spondyloarthritis. N Engl J Med. 2016;374(26):2563–74. https://doi.org/10.1056/NEJMra1406182.
Braun J, van den Berg R, Baraliakos X, Boehm H, Burgos-Vargas R, Collantes-Estevez E, et al. 2010 update of the ASAS/EULAR recommendations for the management of ankylosing spondylitis. Ann Rheum Dis. 2011;70(6):896–904. https://doi.org/10.1136/ard.2011.151027.
Mounach A, El Maghraoui A. Efficacy and safety of adalimumab in ankylosing spondylitis. Open Access Rheumatol. 2014;6:83–90. https://doi.org/10.2147/OARRR.S44550.
Haibel H, Rudwaleit M, Brandt HC, Grozdanovic Z, Listing J, Kupper H, et al. Adalimumab reduces spinal symptoms in active ankylosing spondylitis: clinical and magnetic resonance imaging results of a fifty-two-week open-label trial. Arthritis Rheum. 2006;54(2):678–81. https://doi.org/10.1002/art.21563.
Huang F, Gu J, Zhu P, Bao C, Xu J, Xu H, et al. Efficacy and safety of adalimumab in Chinese adults with active ankylosing spondylitis: results of a randomised, controlled trial. Ann Rheum Dis. 2014;73(3):587–94. https://doi.org/10.1136/annrheumdis-2012-202533.
Lambert RG, Salonen D, Rahman P, Inman RD, Wong RL, Einstein SG, et al. Adalimumab significantly reduces both spinal and sacroiliac joint inflammation in patients with ankylosing spondylitis: a multicenter, randomized, double-blind, placebo-controlled study. Arthritis Rheum. 2007;56(12):4005–14. https://doi.org/10.1002/art.23044.
van der Heijde D, Kivitz A, Schiff MH, Sieper J, Dijkmans BA, Braun J, et al. Efficacy and safety of adalimumab in patients with ankylosing spondylitis: results of a multicenter, randomized, double-blind, placebo-controlled trial. Arthritis Rheum. 2006;54(7):2136–46. https://doi.org/10.1002/art.21913.
van der Heijde D, Schiff MH, Sieper J, Kivitz AJ, Wong RL, Kupper H, et al. Adalimumab effectiveness for the treatment of ankylosing spondylitis is maintained for up to 2 years: long-term results from the ATLAS trial. Ann Rheum Dis. 2009;68(6):922–9. https://doi.org/10.1136/ard.2007.087270.
Pelechas E, Voulgari PV, Drosos AA. ABP 501 for the treatment of rheumatoid arthritis. Expert Opin Biol Ther. 2018;18(3):317–22. https://doi.org/10.1080/14712598.2018.1430760.
Van Der Linden S, Valkenburg HA, Cats A. Evaluation of diagnostic criteria for ankylosing spondylitis. Arthritis Rheum. 1984;27(4):361–8.
Sieper J, Rudwaleit M, Baraliakos X, Brandt J, Braun J, Burgos-Vargas R, et al. The assessment of SpondyloArthritis International Society (ASAS) handbook: a guide to assess spondyloarthritis. Ann Rheum Dis. 2009;68(Suppl 2):ii1–44. https://doi.org/10.1136/ard.2008.104018.
Cohen S, Genovese MC, Choy E, Perez-Ruiz F, Matsumoto A, Pavelka K, et al. Efficacy and safety of the biosimilar ABP 501 compared with adalimumab in patients with moderate to severe rheumatoid arthritis: a randomised, double-blind, phase III equivalence study. Ann Rheum Dis. 2017;76(10):1679–87. https://doi.org/10.1136/annrheumdis-2016-210459.
Center for Drug Evaluation NMPAN. Key considerations in clinical trial design of a biosimilar drug for adalimumab solution for injection. 2018. http://www.cde.org.cn/dzkw.do?method=largePage&id=314814
Jones A, Ciurtin C, Ismajli M, Leandro M, Sengupta R, Machado PM. Biologics for treating axial spondyloarthritis. Expert Opin Biol Ther. 2018;18(6):641–52. https://doi.org/10.1080/14712598.2018.1468884.
Dorner T, Kay J. Biosimilars in rheumatology: current perspectives and lessons learnt. Nat Rev Rheumatol. 2015;11(12):713–24. https://doi.org/10.1038/nrrheum.2015.110.
Lyman GH, Zon R, Harvey RD, Schilsky RL. Rationale, opportunities, and reality of biosimilar medications. N Engl J Med. 2018;378(21):2036–44. https://doi.org/10.1056/NEJMhle1800125.
Mulcahy AW, Hlavka JP, Case SR. Biosimilar cost savings in the United States: initial experience and future potential. Rand Health Q. 2018;7(4):3.
Jorgensen KK, Olsen IC, Goll GL, Lorentzen M, Bolstad N, Haavardsholm EA, et al. Switching from originator infliximab to biosimilar CT-P13 compared with maintained treatment with originator infliximab (NOR-SWITCH): a 52-week, randomised, double-blind, non-inferiority trial. Lancet. 2017;389(10086):2304–16. https://doi.org/10.1016/s0140-6736(17)30068-5.
Park W, Yoo DH, Miranda P, Brzosko M, Wiland P, Gutierrez-Urena S, et al. Efficacy and safety of switching from reference infliximab to CT-P13 compared with maintenance of CT-P13 in ankylosing spondylitis: 102-week data from the PLANETAS extension study. Ann Rheum Dis. 2017;76(2):346–54. https://doi.org/10.1136/annrheumdis-2015-208783.
Kaltsonoudis E, Pelechas E, Voulgari PV, Drosos AA. Maintained clinical remission in ankylosing spondylitis patients switched from reference infliximab to its biosimilar: an 18-month comparative open-label study. J Clin Med. 2019. https://doi.org/10.3390/jcm8070956.
Xu H, Li Z, Wu J, Xing Q, Shi G, Li J, et al. IBI303, a biosimilar to adalimumab, for the treatment of patients with ankylosing spondylitis in China: a randomised, double-blind, phase 3 equivalence trial. Lancet Rheumatol. 2019;1(1):e35–43. https://doi.org/10.1016/S2665-9913(19)30013-X.
Kay J, Schoels MM, Dorner T, Emery P, Kvien TK, Smolen JS, et al. Consensus-based recommendations for the use of biosimilars to treat rheumatological diseases. Ann Rheum Dis. 2018;77(2):165–74. https://doi.org/10.1136/annrheumdis-2017-211937.
Park W, Hrycaj P, Jeka S, Kovalenko V, Lysenko G, Miranda P, et al. A randomised, double-blind, multicentre, parallel-group, prospective study comparing the pharmacokinetics, safety, and efficacy of CT-P13 and innovator infliximab in patients with ankylosing spondylitis: the PLANETAS study. Ann Rheum Dis. 2013;72(10):1605–12. https://doi.org/10.1136/annrheumdis-2012-203091.
Kravvariti E, Kitas GD, Mitsikostas DD, Sfikakis PP. Nocebos in rheumatology: emerging concepts and their implications for clinical practice. Nat Rev Rheumatol. 2018;14(12):727–40. https://doi.org/10.1038/s41584-018-0110-9.
Author information
Authors and Affiliations
Corresponding author
Ethics declarations
Funding
This work was supported by the Chinese National Key Technology R&D Program, Ministry of Science and Technology (Grant number: 2017YFC0907601); Medicine and Health Technology Innovation Project, Chinese Academy of Medical Sciences (Grant number: 2019-I2M-2-008) and ZHEJIANG HISUN PHARMACEUTICAL CO., LTD. Open access publication of this article was funded by Haisun BioRay Bio-pharmaceutical., Ltd.
Conflict of interest
All authors declare that they have no conflicts of interest.
Ethical approval
All procedures performed in studies involving human participants were carried out in accordance with the ethical standards of the Peking Union Medical College Hospital and Chinese Academy of Medical Sciences (no. 001402) and the 1964 Helsinki declaration and its later amendments or comparable ethical standards.
Informed consent
Informed written consent was obtained from all individual participants included in the study.
Author contributions
ML and XZ contributed to the study conception and design. Material preparation, data collection and analysis were performed by all authors. The first draft of the manuscript was written by JS and LH; all authors commented on subsequent versions of the manuscript. All authors read and approved the final manuscript submitted to the journal.
Data availability
The datasets generated during and/or analyzed in the current study are available from the corresponding author on reasonable request.
Electronic supplementary material
Below is the link to the electronic supplementary material.
Rights and permissions
Open Access This article is licensed under a Creative Commons Attribution-NonCommercial 4.0 International License, which permits any non-commercial use, sharing, adaptation, distribution and reproduction in any medium or format, as long as you give appropriate credit to the original author(s) and the source, provide a link to the Creative Commons licence, and indicate if changes were made. The images or other third party material in this article are included in the article's Creative Commons licence, unless indicated otherwise in a credit line to the material. If material is not included in the article's Creative Commons licence and your intended use is not permitted by statutory regulation or exceeds the permitted use, you will need to obtain permission directly from the copyright holder.To view a copy of this licence, visit http://creativecommons.org/licenses/by-nc/4.0/.
About this article

Cite this article
Su, J., Li, M., He, L. et al. Comparison of the Efficacy and Safety of Adalimumab (Humira) and the Adalimumab Biosimilar Candidate (HS016) in Chinese Patients with Active Ankylosing Spondylitis: A Multicenter, Randomized, Double-Blind, Parallel, Phase III Clinical Trial. BioDrugs 34, 381–393 (2020). https://doi.org/10.1007/s40259-020-00408-z
Published:
Issue Date:
DOI: https://doi.org/10.1007/s40259-020-00408-z