
Abstract
Unlike previous studies on the minimum wage, which focused on its effect on total teenage employment, we examine its effect on covered employment. A covered job was defined to be one paying the minimum wage or more. Using contemporary wages to classify workers this way may inflate the estimated effect of minimum wages on covered employment. To avoid this bias, covered jobs are identified using a logit procedure run over years in which the minimum age was not increased. We find that minimum wages reduced covered employment significantly more than total employment. We also show that covered employment may be overstated in the period following an increase in the minimum wage.

Notes
The term minimum wage refers to the binding minimum wage defined as the higher of the state or federal minimum wage.
It might seem that full service restaurants would have a sizeable number of minimum wage workers. Yet, their labor force largely consists of tipped servers, most of whom were paid the tipped minimum wage, which was not increased when the Federal minimum wage was increased.
Some of the other results in the paper only controlled for 90 % of the variation in the minimum wage.
Schiller (1994) found that that "below the minimum wage" workers are more likely to be employed in small firms (median size of 18 employees). Axtell (2001) found that in 1997, 47.6 % of the 5,541,918 firms in the U.S. employed 4 or fewer workers and that 65.8 % employed 9 or fewer workers.
As of July 2008, the federal minimum wage was $6.55 per hour. Appendix Table 7 presents the history of the federal minimum wage. States may impose their own minimum wage and the higher of the state or federal minimum wage is binding. The federal minimum wage for tipped employees is lower than the standard minimum wage. As of July 2008, the tipped minimum wage was $2.13 per hour. States may also set their own tipped minimum wage.
Their estimation accounts for the likelihood that the minimum wage is binding in a state. The ratio of the minimum wage to adult wages is regressed on the fraction of teenagers that are employed. A −0.41 effect is found.
The largest sample is for March 1990 in California with 716 observations. 50 % of the state/month cells have fewer than 104 observations, 75 % have fewer than 136 observations and 90 % have less than 336 observations.
The states without tip-offsetting are Alaska, California, Minnesota, Montana, Nevada, Oregon and Washington.
Federal laws impose a tipped minimum wage of $2.13 for restaurant employees. States may impose their own tipped minimum wage. The higher of the two is binding. The federal minimum wage has remained relatively unchanged through time. In the 1980’s the tipped minimum wage was $2.01 and currently the tipped minimum wage is $2.13.
Adults ages 30 to 39 were selected as a group that is close to teenagers but whose wages are only slightly affected by the minimum wage.
Two criteria for selecting lags were employed – the first based on the Akaike Information Criterion (AIC), the second based on the significance of lags. As each additional lag is added, it must be significant.
These time periods were selected by examining the average monthly reported wage to see when the wage leveled off after the minimum wage hike.
The fit of the method is tested in two ways: First, in an out of sample test, the logit coefficients reported in Appendix Table 9 are used to estimate the fraction of covered teenage workers for each bracket in the years 1986 and 2003. The actual and estimated fractions of covered teenage workers are compared. Second, by running the logit over the 1995 to 2001 period for each bracket then using the results to estimated the coverage probabilities for the 1987 to 1994 period for each bracket. The actual and estimated probabilities are compared. The results are available upon request.
The occurrence of measurement error in the CPS is documented in the literature with a large emphasis on income reporting. In general, measurement error leads to false results and makes the underlying economic relationships difficult to discern. The estimates may be biased or inconsistent if the dependent variable is limited in some way, say to be greater than zero (Hausman 2001). The interested reader is referred to: Bound and Krueger, 1991; Bollinger, 1998; Roemer, 2000; Cavanagh and Sherman, 1998 and Abrevaya and Hausman, 1999.
Information on the methodology of the Current Population Survey is available at: http://www.bls.census.gov/cps/bmethdoc.htm
Only the second hike of each minimum wage increase is a valid test of this hypothesis since an observation starting within a year of the first hike will almost always include the second hike. Results for 1990 and 1996 are presented in Appendix Table 10.
These time periods were selected by examining the average monthly reported wage to see when the wage leveled off after the minimum wage hike.
See Table 1
The fraction of the workforce covered by the minimum wage can be regarded as the average of the probability of each worker reporting that they are covered.
The variable ‘big state’ is equal to one for the following states: New Jersey, Massachusetts, North Carolina, Florida, Pennsylvania, Texas, Illinois, New York, Ohio, Michigan and California. This was determined by looking at the sample size by state. A natural break occurs between Washington and New Jersey as can be seen in Fig. 1.
Fig. 1 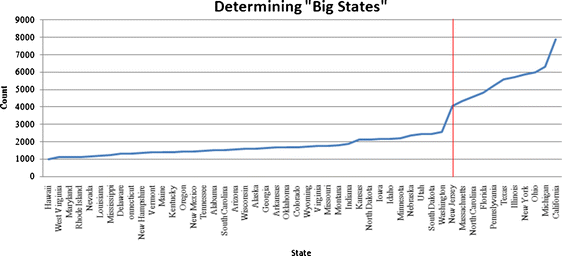
Determining “Big States”
In years such as 1992, 1993, 1998 and 1999 when the federal minimum wage was not increased nor was it increased in the following year the average teenage worker (in the matched data set) experienced wage growth of 9.4 % to 11.4 %. The average teenager (in the matched data set) whose first observation was in 1992 and 1993 experienced wage growth of 9.4 % (N = 1467 and 1515 respectively). The average teenager (in the matched data set) whose first observation was in 1998 and 1999 experienced wage growth of 11.4 % (N = 1322 and 1214 respectively).
The smaller sample size in 1990 reflects the fact that only 10 % of all teenage workers (not just those in the matched sample) were paid exactly the minimum wage, in contrast to the 36 % being paid the exact minimum wage in 1991. The percents are for teenagers, 16 to 19, for the year following the minimum wage hike (April to March).
The first-difference regression form used above was used here, but with the addition of the interaction of the minimum wage and the fraction covered variable. The usual procedure of adding the fraction affected as a separate variable was not done as its high correlation with the state fixed effects terms prevented the estimation of the regression. The interaction of this term and the minimum wage variable (in log form) had a negative coefficient (−0.369 with an error term of 1.049). The minimum wage coefficient was +0.107 with a standard error of 0.90. If 80 % of a state’s teenage jobs were covered, the net effect of the minimum wage was −0.188 (0.092 and an F-stat with a probability of 0.041). The interaction result was sensitive to the number of autoregressive terms.

References
Abrevaya J, Hausman J (1999) Semiparametric estimation with mismeasured dependent variables: an application to duration models for unemployment spells. Annales DEconomie et de Statistique 55–56:243–275
Ahn T, Arcidiacono P, Wessels W (2011) The distributional impacts of minimum wage increases when both labor supply and labor demand are endogenuous. J Bus Econ Stat 29(1):12–23
Ashenfelter O, Smith RS (1979) Compliance with the minimum wage law. J Polit Econ 87(2):333–350
Bollinger CR (1998) Measurement error in the current population survey: a nonparametric look. J Labor Econ 16(3):576–594
Bound J, Krueger AB (1991) The extent of measurement error in longitudinal earnings data: Do Two wrongs make a right. J Labor Econ 9(1):1–24
Brown C, Gilroy C, Kohen A (1982) The effect of the minimum wage on employment and unemployment. J Econ Lit 20(2):487–528
Burkhauser RV, Couch KC, Wittenburg DC (2000) A reassessment of the New economics of the minimum wage literature with monthly data from the current population survey. J Labor Econ 18(4):653–680
Burnette J, Holmes JM, Hutton PA (2007) The effect of minimum wage increases on 16–19 year olds: a difference-in-differences analysis. Working paper
Card D (1992a) Using regional variation in wages to measure the effects of the federal minimum wage. Ind Labor Relat Rev 46(1):22–37
Card D (1992b) Do minimum wages reduce employment? a case study of California, 1987–89. Ind Labor Relat Rev 46(1):38–54
Card D, Krueger AB (1994) Minimum wages and employment: a case study of the fast-food industry in New jersey and Pennsylvania. Am Econ Rev 84(4):772–793
Card D, Krueger AB (1995) Myth and measurement: the new economics of the minimum wage. Princeton University Press, Princeton
Currie J, Fallick BC (1996) The minimum wage and the employment of youth: evidence from the NLSY. J Hum Resour 31(2):404–428
Deere D, Murphy KM, Welch F (1995) Employment and the 1990–1991 minimum-wage hike. Am Econ Rev 85(2):232–237
Dube A, Lester TW, Reich M (2010) Minimum wage effects cross sate borders: estimates using contiguous counties. Rev Econ Stat 92:945–964
Falk A, Fehr E, Zehnder C (2006) Fairness perceptions and reservation wages – the behavior effects of minimum wage laws. Q J Econ 121(4):1347–1381
Hausman J (2001) Mismeasured variables in econometric analysis: problems from the right and problems from the left. J Econ Perspect 15(4):57–67
Haugen S (2003) Characteristics of minimum wage workers in 2002. Monthly Labor Review pp. 37–40
Haugen S, Mellor EF (1990) Estimating the number of minimum wage workers. Mon Labor Rev 113(1):70–74
Neumark D (2001) The employment effects of minimum wages: evidence from a Pre-specified research design the employment effects of minimum wages. Ind Relat 40(1):121–144
Neumark D, Wascher W (1992) Employment effects of minimum and submimimum wages: panel data on state minimum wage laws. Ind Labor Relat Rev 46(1):55–81
Neumark D, Wascher W (2002) State-level estimates of minimum wage effects: new evidence and interpretations for disequilibrium methods. J Hum Resour 37(1):35–62
Neumark D, Wascher W (2008) Minimum Wages. MIT Press, Cambridge and London
Orazem PF, Mattila JP (2002) Minimum wage effects on hours, employment and number of firms: the Iowa case. J Labor Res 23(1):3–23
Sabia J, Burkhauser R (2010) Minimum wages and poverty: will a $9.50 federal minimum wage really help the working poor? South Econ J 76(3):592–623
Schiller BR (1994) Below-minimum-wage workers: implications for minimum wage models. Q J Econ Finance 34(2):131–143, Summer
Wessels W (2001) The effect of minimum wages on the labor force participation rates of teenagers. Employment Policies Institute paper
Williams N, Mills JA (2001) The minimum wage and teenage employment: evidence from time series. Applied Economics 33(3):285–300
Yaniv G (1994) Complaining about noncompliance with the minimum wage law. Int Rev Law Econ 14(3):351–362
Conflicts of interest
This paper is taken in part from the doctorate thesis of the first author. The views and conclusions expressed in this paper are those of the authors alone and do not necessarily represent or reflect the opinions or policies of RTI International.