
Abstract
This study explores the relationship between economic and political inequalities and access to public goods provisioning in Pakistan. We construct measures of political inequality and political patronage using voting data, and economic inequality measures using representative household data. Firstly, we find a strong concave relationship between economic inequality and access to residential supply of natural gas. Secondly, we find that the presence of strong-men who can capture large vote shares is associated with higher access to natural gas. We uncover an optimal size of patrons: Patrons have an insignificant positive effect on access when patrons capture less than 20% of the votes and an insignificant negative effect when they capture more than 30%. At 20%, they have a positive effect that is significant in both a statistical and an economic sense.
1 Introduction
Inequalities in income, health, and education pose significant challenges for developing country governments. Such inequalities, both in their horizontal and vertical dimensions, are important not just because they signal significant deprivations for disadvantaged groups but also because they are often accompanied by political tensions, and in extreme cases, civil wars (Kanbur and Venables 2003; Stewart 2008; Deiwiks et al. 2012; Lessmann 2014). More recent literature has also pointed to the importance of ethnic inequality for public goods provisioning (Baldwin and Huber 2010; Alesina et al. 2012). This literature finds a strong inverse relationship between ethnic inequality and access to public goods. A related stream in the literature looks at the impact of historical inequalities emanating from colonial practices on the ability of local communities to engage with the state (Banerjee and Iyer 2005). The most important result of this literature is that inequalities constructed a century ago may continue to have repercussions today.
We build on this earlier work, particularly Alesina et al. 2012, by drawing attention to the importance of the political process in the link between horizontal inequalities and public goods provisioning in Pakistan. Our thesis is that while historical inequalities between groups such as those in land may, cetris paribus, be detrimental in terms of development, these very inequalities can be counterbalanced by the presence of potential political patrons who, in return for votes, negotiate with the state for access to public goods. The particular good in question in this paper is the residential supply of natural gas, which not only requires substantial investment in the delivery infrastructure, but is also highly subsidized in the Pakistani context.Footnote 1 It is reasonable to assume that capturing such high levels of rents requires either a high level of collective action and/or intervention by a powerful political patron.
We operationalize our analysis by constructing districtFootnote 2 level measures of income and land inequality, and access to natural gas using data from the 2010 PSLM survey. The choice of 2010 is motivated by the fact that 2010 witnessed the passage of an instrumental piece of legislation—the 18th Amendment to the Constitution, which devolved power from the federal to the provincial governments. Control of natural resources including natural gas was thus devolved to the provinces as well. Since natural gas occurs primarily in two provinces, this could, theoretically, hinder the ability of areas in other provinces to secure a steady supply of gas. The data from 2010 would reflect the traditional structure of politics around gas provisioning while the later data sets would reflect a renegotiation. Since there is likely to be a lag between the consolidation of political power and the provision of services, we used the closest preceding election data—the 2008 election. It can be argued that the two years between 2010 and 2012 is too short a time span for a full renegotiation to have worked out and so do not make use of the 2012 PSLM. However, later rounds of the PSLM and voting data—2015 and 2013 respectively—would still be appropriate. Since we do not have access to the 2015 PSLM, we make use of the 2010 district representative PSLM (and the 2008 polling dataset) for our regression analysis.
The election data is used to identify district level political patrons as politicians who received 10% or more of the votes polled in their constituency. We distinguish between patrons who received more than 10, 20 or 30% of the votes as both an indicator of patron strength and a measure of political competitiveness. District representative household survey data allows us to construct horizontal and vertical measures of income and land inequality and access to natural gas.
Our results show that variation in district level horizontal inequalities in land and income are non-linear: positively associated with the level of public goods provisioning at lower levels of inequality and negatively associated at higher levels. We also find that positive association could be driven by the presence of political strong-men in highly unequal districts: the presence of an additional competitor who garners 20% or more of the votes polled in his constituency increases access to natural gas significantly. However, the presence of an additional contender who garners 40% or more of the votes reduces access to natural gas. These two results combined suggest that the presence of competing strong-men increases access to public goods.
Besides highlighting the role of political patronage our paper contributes to the literature in two ways. First, ours is among the first studies to systematically link variations in inequalities within a country to variations in access to public goods. Secondly, to the best of our knowledge, ours is the first systematic exploration of group inequalities as well as their effect on public goods provisioning in Pakistan.
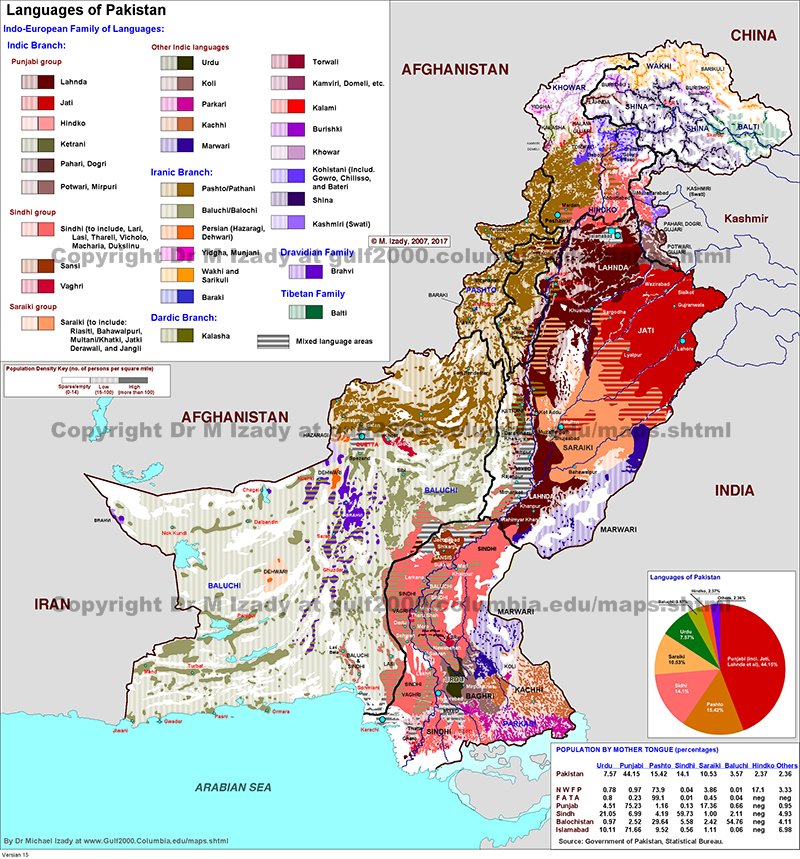
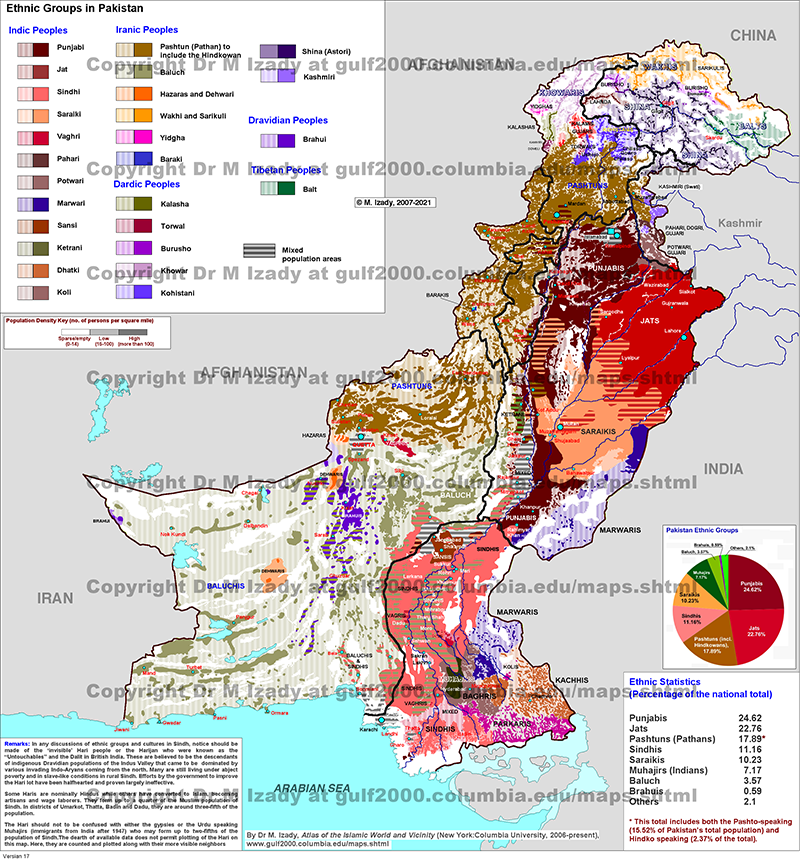
Pakistan presents an interesting case for studying group inequalities. A federation of four provinces—the primary political units of the country—each dominated by a different ethnic group, Pakistan is a religiously homogenous but ethnically diverse country (see “Appendix A”: Fig. 1). The division of British India into Pakistan and India witnessed massive migration streams that rendered Hindus, Christians, and Sikhs a tiny minority in the country.Footnote 3 The resultant religious homogenization, coupled with overlapping provincial and linguistic boundaries, provided the space for linguistic ethnicity to emerge as one of the dominant cleavages in society. Despite immense local diversity, regional and resource politics have, over time, led to the consolidation of sixFootnote 4 major ethnic groups around corresponding major languages—the Baloch, Muhajir,Footnote 5 Pashtun, Punjabi, Seraiki, and Sindhis. We formulate our ethnicity-based analysis on these major cleavages.

Studying natural gas provisioning in Pakistan in the context of group inequality is also particularly meaningful. Only two of the four provinces produce the bulk of local natural gas. Yet, the 2010 data shows that Punjab, which does not produce gas but is politically dominant, has an average rate of provisioning that is 9% points higher than Balochistan, a province that produces a large share of gas but is politically weak.
Despite deep cleavages around ethnic identity, systematic work on group inequality and marginalization is scarce. Existing work focuses primarily on various dimensions of vertical inequalities in the Pakistani context. Ethnic and regional trends in horizontal inequalities (HI) are conspicuous by their absence. The existing work on vertical inequalities in Pakistan shows persistence of inequalities over time, regions, as well as over generations (see Burki et al. 2015 for a detailed study of multi-dimensional time trends in vertical inequality for Pakistan). Similar to other countries such as those in West and East Africa, Pakistan too has a history of ethnic based conflict over resources (Mohmand and Gazdar 2007), with marginalized groups typically seeing exclusion from public goods and services (Cheema and Naseer 2010, 2013). The perseverance in inequality as well as the marginalization of disadvantaged groups can be understood in the context of divisive politics and an elite capture of state institutions such that interactions between various inequalities work to perpetuate initial differences (Stewart and Langer 2008). Given this, we expect to see a persistent trend in inequalities in human capital, income, and wealth at the between group level. Similarly, we expect high group inequalities to be associated with low goods’ provisioning if inequality increases the cost of collective action, thus reducing the negotiation power of a community relative to the state. However, the presence of a powerful patron, even in the midst of inequality, can act as a counterweight and provide access to the state in exchange for votes.
The rest of the paper is organized as follows. In the following section, we present details of the existing work on inequality in Pakistan, while also providing some discussion of the motivating forces driving these inequalities. We briefly review the literature in Sect. 3. Section 4 outlines the data and methods used. Section 5 presents the empirics. We start the section by reporting the trends in horizontal inequality for three time periods, and then proceed to our regression analyses/Sect. 6 concludes.
2 Multi-Dimensional Inequality in Pakistan
Pakistan is marked by inequality in several spheres—asset, income, nutritional, educational, and public services to name just a few. This section highlights the nature and dimensions of inequality experienced in Pakistan, paying special attention to their inter-linkages, the differential experiences across regions and provinces, as well as the ‘durability’ of these inequalities such that they become ‘traps’ (Tilly 1999; Rao 2006).
2.1 Inequality in Income, Human Capital, and Public Goods
Work on inequality in income or consumption for Pakistan in the vertical dimension shows that between 1990 and 2011–12, inequality remained quite low, yet stable, with higher inequality in the more economically diverse urban areas of the country, and in Sind (Burki et al. 2015). While the overall low values for income inequality found in Burki et al. (2015) could be due to the under-representation of rich households in survey data, the other patterns highlighted in their study speak to the underlying structural regime that perpetuates inequality over years, and across regions. Here, the elite capture of state institutions such as those involved in tax-collection protect the rich from downward and the poor from upward mobility such that 40% of sons born in the bottom income quintile remain in the bottom, while 52% sons born in the rich group remain rich (Burki et al. 2015).
Cheema and Naseer (2013) find similar persistence of inequality vis-à-vis educational achievement in Punjab. They observe a divergence between non-propriety, marginalized groups and propriety groups such that the former group appear to have fallen a generation behind the latter in terms of educational attainment. Cheema and Naseer (2013) also find these inter-class differences to be higher in landed estates as compared to those with more egalitarian land regimes. Given the close relationship between land, social status and power in Pakistan, inequality in land or wealth and thereby inequality in power and social status appear to interact to sustain inequality traps across classes. Burki et al. (2015) find similar divergence in educational attainment in their multi-year study for Pakistan between richer and poorer households.
Along with inequality in consumption and education, there is also evidence of inequality traps in occupations with persistence in occupational choice across father-son pairs (Burki et al. 2015). Similarly, the country has considerable nutritional inequality manifesting as stunting and under-nourishment across classes, richer and poorer districts, provinces, and particularly across genders (Di Cesare et al. 2015; Haq and Arshid 2009). This spatial aspect of inequality seen in the case of nutrition-based measures in Pakistan is also evident in the case of public goods such as roads (Burki et al. 2015), as well as educational and health facilities.
Overall, a look at the inequality work on Pakistan shows that there is persistence in inequality at a multi-dimensional level, ranging from human capital to income. The underlying mechanisms that sustain these inequalities are largely rooted in differential access to the state by richer and poorer groups manifesting in not just, for example, a regressive tax system but more importantly poor public goods delivery that could counter multi-dimensional inequality traps (Jamal 2006).
2.2 Interactions Between Various Inequalities
In order to understand how inequalities interact consider the case of inequality in income, public goods, and education. Pakistan’s dual school system—public versus private—has been shown to have wide differences in quality (Andrabi et al. 2015). The high-quality private schools in turn also tend to be more expensive. Given that quality education is expensive, it is expected that only the rich will be able to afford it. If the poor have minimal representation in state legislatures, they will not only be unable to pressure the state into provision of quality, subsidized state schools, but if the labor market rewards school quality, we will also see a diverging income time trend between the rich and the poor.
Yet, Pakistan has seen a veritable mushrooming of private schools all over the country. And while it has been argued that the low cost private schools have no better quality than public schools, the jump in school supply does not explain the growing vertical inequality in school attainment observed in the country. Cheema and Naseer (2013) found stagnant inter-generational educational attainment in villages with schools, in spite of increased provisions of schools at the district level. Their work then suggests that at the inter-class level the issue lies in the demand for schooling rather than its supply. Here, Jacoby and Mansuri’s (2011) analysis can provide some insight. Their work on schooling in rural Punjab and Sind finds that ethnic heterogeneity manifests as an inability of marginalized ethnicities from accessing public schools due to social sanctions from higher ethnic groups.
Aside from issues of access related to social heterogeneity, there is a wealth of literature documenting the negative link between heterogeneity and public goods provision (see Banerjee et al. 2006 for a partial review) as well as maintenance: Khwaja (2009) observes that socially heterogeneous communities in North Pakistan have poorer maintenance of public goods. In this regard, the literature highlights the presence of a trust deficit in heterogeneous communities resulting in coordination and collective action problems, and thus an under-provision of public goods. Likewise, preferences for public goods in socially and economically heterogeneous communities are likely to be more diverse which would again lead to coordination issues and poor provision levels, particularly when wealthy members of a community who have state access derive little private benefit from local public services (Cheema et al. 2012). We discuss these effects in more detail below.
3 Literature Review
The discussion above suggests several undercurrents in the research on inequality in Pakistan: firstly, measures are largely limited to vertical and not horizontal inequality; and secondly, the stagnation of the measures across time is suggestive of inequality traps (for a detailed discussion of the latter see Burki et al. 2015: chapter 3). In passing, note that this persistence in inequality is not unique to Pakistan and is prevalent enough for Charles Tilly (1999) to have come up with a name for it—‘durable inequality’.Footnote 6 Rao (2006) subsequently formalized these ideas in the framework of what he called ‘inequality traps’, defining them as ‘situations where the entire distribution is stable because the various dimensions of inequality (in wealth, power, and social status) interact to protect the rich from downward mobility and the poor from being upwardly mobile’ (Rao 2006).
The perseverance of inequality across time and generations can be understood in the context of interactions between various inequalities and how these can reinforce each other. For example, Wilkinson (1996) draws attention to how income inequality can lead to inequality in health outcomes which, in turn, reinforces income inequality. Access to different stocks of capital may involve similar traps. Different levels of social capital allow access to prestigious schools which not only endow a person with higher levels of human capital but also cultural and social capital which allow the possibility of higher levels of physical (or alternatively economic) capital.
While the discussion above is in the context of vertical inequality, it can be reproduced for horizontal inequalities with some adjustments. There is an enormous literature on wage differentials by race and gender i.e. on the ‘capability’ of different groups of people to convert human capital into earnings. One possible route is the interaction between human capital and social capital: network effects may provide one group with better possibilities than other groups (Munshi 2014). While another considers how differential income or wealth across groups could affect the provision of such public goods as health and education facilities resulting in poorer provision of public amenities to disadvantaged communities thereby perpetuating inequalities (see Ferreira 2001 for a discussion on the interaction between wealth, education and political inequalities).
In fact, a large literature has generated compelling evidence that public goods provisioning, redistributive policies, and effective governance are all adversely affected by group inequality (Alesina et al. 2001). Theoretically, if, in a diverse society, different groups have different rankings of public goods then the desired good will be more distant to the chosen one (Luttmer and Singhal 2011). If preferences are in turn shaped by a person’s position on the income distribution, group inequality leads to divergent preferences, leading to lower public goods provision and increased political tensions (Deshpande 2000).
A related finding from the literature on urbanization is how the rich including the middle class often want to ‘isolate’ themselves. This desire might be particularly strong when wealth is correlated with group identity, in which case ethnic inequality may lead to segregation (Alesina and Zhuravskaya 2011) show that ethnic and linguistic segregation correlate negatively with proxies of effective governance).
If the overlap between political and economic inequality also corresponds to group cleavages then ethnic minorities or less powerful groups could have a limited supply of public goods. In such areas, the rich might compensate for the diminished supply of public good by just directly purchasing the corresponding private group. For instance, purchasing water from private providers rather than relying on public supply.
Yet, high economic inequality may well see the emergence of patrons, which could result in provision of public goods. In this regard, high inequality could witness the formation of the kind of clientelist networks described in Powell (1970) as a ‘…tie… between two parties unequal in status, wealth and influence’ (pp. 412) with the ‘low-status actor (client)’ receiving material benefits and the patron receiving less tangible rewards such as loyalty, deference, esteem, or political power. The patron may also serve to gain financially if political office brings privileged access to government contracts.
Such clientelism has been described as a form of ‘interest-group’ politics. And not only has it been observed to be most rampant in areas of high inequality with severely hierarchical social relations, it has been used to explain receipt of material favours including public goods in exchange for political support (Wantchekon 2003; Manzetti and Wilson 2007; Baldwin 2013). In fact, Wantchekon (2003) finds that even while operating within the patron-client framework, voters respond to public policy and place pressure on politicians, sometimes through local patrons (Baldwin 2013), to deliver. Here then, political competition is likely to matter. At the same time though, patrons have an incentive to under-provide those public goods that cannot be targeted (Lizzeri and Persico 2001).
When it comes to the link between public good provisioning and inequality, the literature then highlights several conflicting factors at play. High inequality could be associated with both upward and downward pressure on provision of public goods depending on the relative strength of the negative impact of divergence of preferences and collective action failures, and the positive effect of patrons to provide goods in exchange for (political) favours.
4 Data and Methods
We make use of three sets of data for our analysis—the Population Census, the Pakistan Social and Living Standards Measurement Survey (PSLM)/Pakistan Integrated Household Survey (PIHS)/Household Income Expenditure Survey (HIES), and data obtained from the Electoral Commission of Pakistan.
4.1 Population Census
The census, which was started by the British in 1871, was envisioned as a decennial activity. Post-independence, censuses were carried out in 1951, 1961, 1972, 1981, and 1998. The only census for which all district reports are readily available is the 1998 census. The 1998 census reports 52 tables—40 on population data and 12 on housing data for 104 districts in four provinces of the country. Of the 52 tables, 27 are based on complete count information and 27 are based on sample count information (8 per cent single stage stratification).
Several observations merit mention at the outset. Firstly, the information on language, religion, literacy, level of education, and access to water and energy, is based on complete count. Secondly, the census does not make public individual level data so it is impossible to calculate literacy levels by religious or linguistic group.
4.2 PIHS 1990–91/PSLM 1990–91, 1996–97, 2007–08, 2010–11, 2012–13, 2013–14, 2014–15
The PIHS 1996–97, some rounds of the PSLM and the HIES are the only data set that contains information on language. The PIHS questionnaire records information on the ‘language in which the interview was conducted’. While other PIHS data rounds conducted in 1995–96, 1998–99, and 2000–01 collected data on language, they do not report it. Efforts to get the language data from the Pakistan Bureau of Statistics (PBS) have been unfruitful.Footnote 7
It is also worthwhile to note the manner in which the PSLM rounds are run. While all PSLM rounds are nationally, provincially, and regionally representative, district representative samples of the PSLM began to be collected in 2004–05. Moreover, since 2004, only alternative rounds of the PSLM are district representative. For example, while the 2010–11,Footnote 8 2012–13, and 2014–15 rounds are district representative, the 2013–14 round is not. While our regression analysis requires the use of rounds that are district representative, technically speaking for our trend analysis we can use either type of data so long as the language variable is present. For the sake of consistency and to increase the length of our time trend analysis we restrict our trend analysis to all those rounds of the PSLM that are not district representative.
With regard to the language variable in the PIHS questionnaire, the following observations merit attention: if the interview was conducted in a regional language one can be confident that the respondent identifies with that language ethnically. If, on the other hand, the interview is conducted in Urdu, the national language of Pakistan, the questionnaire does not provide any additional identifiers of ethnicity, and we cannot be certain if the respondent’s ethnicity is indeed ‘Urdu-speaking’. To resolve this problem one must understand the data collection protocol of the Federal Bureau of Statistics (FBS).
The FBSFootnote 9 interviewing team is composed of a man and a woman who interview male and female heads of households respectively. Several teams are sent to cover a primary sampling unit (PSU) and the regional languages spoken in that PSU are kept in mind. It is ensured that, at the very least, the female interviewer speaks the regional language. Since there could be several regional languages spoken in a multi-ethnic PSU, the FBS has several teams with the appropriate language mix. For example, a team interviewing in Sindh is constituted of people who are fluent in Sindhi, Seraiki, Punjabi, and Pashto. Additionally, all team members speak Urdu. The supervisor of each team identifies the households to be surveyed, enquires about the ‘language spoken at home’ and assigns an interviewer who speaks that language.
The above does not preclude the possibility that those who speak a specific language at home may in fact belong to an entirely different ethnic group. In particular, those who speak Urdu at home may well be in fact be Sindhi or Pashtun. In fact, especially for the Muhajir ethnic group, we are cognizant that the Urdu speaking populations in the other provinces do not identify themselves as Muhajir. However, several points are worth noting in this regard: (1) Although there is no empirical evidence, anecdotal evidence suggests that households tend to speak that language within the home which is the dominant language of that ethnic group; (2) Households that choose to speak a language different from that of their ethnicity are likely systematically different from those households that choose to speak the language of their ethnicity. Hence, the two group identities, and the concomitant networks, are distinct enough to warrant separate identifiers; and (3) In the analysis in our paper, we have identified Muhajirs as Urdu speaking people in Sindh only. We have done this given anecdotal evidence regarding the inclination of ethnic Sindhis to not speak Urdu at home. Urdu speaking households in other provinces are an ambiguous category and we have not included them in the main ethnic categories, but have refined these wherever possible especially for our regression analysis (see discussion in Sect. 5.2).
4.3 Election Commission of Pakistan
The Pakistan Election Commission provides data on the voting distribution for each electoral constituency. The Commission data records the number of votes obtained by each candidate, but does not provide any additional information on the constituency. We use this information to construct a measure of voting inequality that highlights the margin with which a candidate wins an electorate. This then serves to provide information on the level of political competition within each district.
4.4 Variable Construction
4.4.1 Public Good Provisioning
For our dependent variable we consider access to natural gas by a household within the 2010 district representative round of the PSLM. The measure is based on household level data (i.e. does the household have a gas connection). All household that report ‘yes’ are aggregated to the district level to capture the proportion of households that have the good within the district. Table 1 provides summary statistics of our public good provision levels.
Comparing the 2010 levels to 1998 indicates that there has been a marked improvement in coverage. However, here it is important to note that the remarkable change between 1998 and 2010 may not just be a reflection of significant improvement in public goods provision in the intervening 12 odd years, but may also be an artefact of data collection. As Kemal et al. (2003) point out, census and survey data are not strictly comparable. Secondly, the reduction of gas provisioning in 2014 is also noteworthy: an exploration of this data-set revealed that the share of rural households in 2014 was much larger than in 2010. The corresponding figures for the years are 82.24 and 64.99% respectively. This said, the discussion around sampling frame in the data documents did not reveal any significant changes in sampling or survey methodology. While the table reports an average for the districts, individual data points are even more striking. For Qillah Abdullah District, for example, the change between 2010 and 2014 was a drop of 68% points! The documentation did indeed mention that survey teams had difficulty in several districts because of an ethnic insurgency in the Balochistan province and the ‘War on Terror’ in the KP province. For this reason, we will focus on the earliest data-set with district level representation—2010 for our regression results. For the trends analysis we will document all data sets while reminding readers of possible caveats. Finally, while the average provisioning of gas is quite low, there is tremendous variation across districts—sparsely populated districts have virtually zero average provision levels.
4.4.2 Dimensions of Inequality
Our primary variables of interest are vertical and horizontal group-based measures to capture group-level inequality. For our regression analysis, the former has been constructed at the district level, i.e. for the entire population, while the latter considers the inequality between the different ethnic/linguistic groups within each district.
We calculate different measures of inequality for several variables—land, income, education—details on the formulae for each of the HI measures are provided in “Appendix B”. In particular, we calculate:
Group Gini (GGini), which compares every group with every other group. Similar to the Gini, which is a measure of overall inequality, the values for the GGini lie between 0 and 1, where the closer the value is to zero the lower the level of inequality.
Group Coefficient of Variation (GCOV), which measures differences from the mean for each group giving more weight to extremes. Given ethnic population shares, a higher GCOV implies a higher level of between-group inequality.
Group Theil Index (GTheil), like the GCOV but unlike the GGini, compares each group with the mean. The GTheil is particularly sensitive to the lower end of the distribution.
We present all three inequality measures for our trend analysis, but restrict ourselves to the Theil measures for income and land when representing vertical and horizontal inequality in the regression analysis. We choose the Theil for our regression analysis since unlike the Gini and the COV this is especially sensitive to extreme instances of inequality. Moreover, the Theil and the COV measures are highly (and significantly) correlated. Yet, particularly when it comes to the within Theil inequality measure, it is not possible to include zeros in its estimation. Our analysis then is restricted to those that earn income and those that own land.
Our choice of variables capturing economic inequality in the regression analysis is driven by the fact that the inequality measures constructed for these variables are expected to drive the mechanisms through which communities negotiate with the state for public goods provision. For example, land inequality, besides capturing wealth, also has a particular social meaning. The British colonial government established different land tenure arrangements with varying levels of inequality and social equality, mainly as a means to co-opt powerful elite and kinship groups. Even today, social status and power remain tied to land—and in particular agricultural land—ownership, mediating patron–client networks of access for a wide range of goods and services including both public goods as well as private ones such as formal sector jobs. Given this, our land inequality measures are based off of agricultural land only.
Similarly, we expect that those ethnicities who are at the higher end of the incomeFootnote 10 distribution will not only also have the necessary networks of access in place to enjoy greater public goods provisioning but may also have very different preferences vis-à-vis the type of public goods that they require relative to poorer groups. Thus, on the one hand, an increase in inequality may mean that poorer groups see spill-over benefits from the bargaining that richer groups may be able to do with the state for the provisioning of non-exclusionary public goods. Yet simultaneously, we may see a decline in provision levels if higher inequality is linked with a divergence in preferences for the public good leading to collective action issues. It is also worth noting here that income and education between group inequality is highly (and significantly) correlated. Hence, while we report the trends in education inequality in Sect. 5.1 we drop the education inequality measure in our subsequent regression analysis.
Additionally, we make use of the fact that certain districts have higher levels of political competition than others to construct a measure of vote inequality. We construct inequality measures of the votes to capture this voting distribution. If one person gets all the votes, the Gini in that constituency would be 1 and if all candidates get equal votes, the Gini would be 0. Since there are a number of constituencies in each administrative district (the unit of analysis in our regressions) we construct an aggregate measure of inequality as a weighted average of the constituency measures, with population shares serving as weights. Since the number of candidates can vary from one constituency to another, the regression controls for the number of candidates in each constituency. It could be argued, in a party-based election, where specific parties cater to the interests of specific ethnic groups, that the inequality of votes captures the political aspect of group inequality.
Overall, Table 2 reveals that on average within-group inequality is generally higher than between-group inequality at the district level. Moreover, group-based inequality, both in the horizontal and vertical dimensions, is higher with respect to land. This is unsurprising given the historical background of land inequity and the continued importance of land, especially agricultural, in the socio-economic power context in Pakistan.
Notwithstanding some fluctuation in the point-estimators, the measures of both between and within group inequality are statistically similar to each other across years suggesting a distribution possessing some inertia. This is reasonable since both income and land are variables that can be expected to be resilient within a short span of time (2010–2014).
4.4.3 Diversity Controls
Along with our inequality measures that capture economic difference between and within groups, we capture diversity in our regressions through a fractionalization index while also controlling for the total number of ethnic groups in each district. By adopting this strategy we are able to answer whether it is economic differences or just diversity per se that is associated with public goods provision issues.
The fractionalization index a standard Herfindahl Index (\(F = 1 - \mathop \sum \nolimits_{i = 1}^{N} s_{i}^{2}\)), where s is the proportion of the group in the population and N is the total number of groups; this then gives the probability that any two people chosen randomly will belong to different ethnic groups). Although we have access to both the 2010 PSLM as well as the 1998 Census, we include fractionalization measures based only on 1998 data thereby providing a control for how past diversity levels in the district may have affected public goods provisioning. Table 3 summarizes the additional controls, highlighting that on average there are in excess of two ethnic groups per district (with a minimum of one and a maximum of five).
4.4.4 Other Controls
We also considered adding several other controls such as the proportion of the population that has completed primary level of education for each district in 2010, the proportion of the district that was urban in both 2010 and 1998, as well as the supply of such public goods as roads and schools. All of these measures are expected to affect each region’s ability to effectively bargain with the state for goods provision, while also giving us a sense of the relative strength of the district’s labour market and/or level of development of the region which would factor into the state’s decision when supplying public services. However, we found that such developmental controls were highly correlated with past levels of gas provisioning within the district, and so were dropped.
5 Empirics
5.1 Trend in Inequality Measures
While the Burki et al. (2015) work provides a detailed look at time trends of several measures of vertical inequality in Pakistan, no work has as yet considered the trends in horizontal inequality in Pakistan. We focus our attention on documenting these trends in this section. In addition to noting the provincial and urban–rural trends in inequality for four time periods—1990,Footnote 11 1996, 2006, and 2013—we also consider ethnicity based inequality trends for 1996, 2006, and 2013. For this, we consider the six main ethnic groups in Pakistan corresponding to major languages—the Baloch, Muhajir, Pashtun, Punjabi, Seraiki, and Sindhis.
5.1.1 Education Inequality
Educational inequalities have long been a matter of policy concern in developing countries. Literature inspired by Sen (1980) views education as crucial for a person’s functioning and capacity to flourish, if not desirable in its own right. Memon (2013) suggests that human capital differences account for a significant share of the ethnic wage gap. Finally, as discussed in Sect. 1, a large literature finds that inequalities in human capital are correlated with inequalities in income and health.Footnote 12
There is much less agreement on how to measure inequality, though. While early attempts to measure inequality focused on years of education, this measure has been criticized because it ignores quality of schooling. A year of schooling in large cities in Pakistan like Karachi or Lahore for example, may not compare with a year of schooling in Baluchistan’s Noshki district, one of the country’s poorest areas. Andrabi et al. (2015), for example, suggest that variations in school quality within a district lead to a difference in children’s test scores (achievement is presumably a better measure of education than attainment).
Having noted this important criticism, we proceed with measuring inequality of attainment for two reasons. Firstly, since there is no nationally representative data set on test scores, we cannot measure inequality of achievement. Secondly, it seems reasonable to assume that the subaltern group, on average, would not only have a lower level of attainment but also less quality. Similarly, the dominant group, on average, could be expected to have not only a higher level of attainment but also quality. To that extent, inequality of attainment would be a lower bound for the inequality of achievement.
Table 4 presents the results of the three HI measures implemented on years of education for the 15–25 years-of-age cohort. The main finding is that inequality across the cleavages shows a great degree of persistence over the 1996–2013 period, and in fact is showing evidence of increasing when we consider the 2013 figures. Moreover, when we add the 1990 provincial and regional numbers, we find some evidence of a u-shaped trend when we look at the regional (urban–rural) inequality estimates. This pans out with the general u-shaped growth and inequality relationship as well as the observation in Burki et al. (2015) that increased urbanization may well lead to higher inequality. This said, where the increasing trend comes from a single data point (PSLM 2013) confirmation must await the release of the HIES 2015/16.
Table 5 reports the ethnic inequality measures for education for different age cohorts. The first noteworthy finding is that across all years and for all the Gcov and the Ggini measures, inequality is much higher in the 45+ cohort than in 15–25 cohort. This is consistent with the idea of convergence over time. Additionally, we again see a u-shaped trend in educational inequality across ethnicities over the 17-year span examined here, for all of the age cohorts. This suggests that while cleavages across cohorts may be converging, those across ethnicities are increasing as the overall structure of the Pakistani economy has changed in the intervening time period.
5.1.2 Income Inequality
Discussions on inequality in physical capital generally tend to focus on different types of assets including land, as well as other consumer durables. However, we faced severe data limitations when it came to tracking the horizontal inequality in land and other durable assets over the three waves of the PSLM. Similarly, income data was also only available for two rounds (see Table 6).
Here two points bear mention. First, ethnic and rural/urban inequality appear to be more significant cleavages for income inequality than the province. Secondly, in most of the indicators and across most cleavages, there is evidence of persistence. The ethnicity GCOV and GTheil are almost the same across the 6 year period. As is the Ggini across the rural urban cleavage. The most remarkable increase in inequality is measured by the GCOV across the provincial cleavage. Since the GCOV involves the squares of values, it is quite possible that there are significant changes in the tails of the income distribution that are contributing to this dramatic increase. Both KP and Balochistan are perceived to have lagged behind the other two provinces in the 2007–2013 period. At the same time, since 2007 there have been military operations in these two provinces which may also affect the quality of the data.
5.2 Regression Analysis
We explore the link between group inequalities and public services following Alesina et al. (2012) and Baldwin and Huber (2010). Recall that for reasons of survey quality, we measure gas provisioning, group inequality in land and income using the 2010 district representative PSLM survey data. This approach, forces us to change strategy from the one employed in the preceding section: group inequality measures at the national or provincial level such as those reported above will not suffice since this limits the number of observations and robs correlations of any statistical power. For example, correlating nutritional and educational inequality would be tantamount to one number each for three years per measure. Since there is a large number of districts (105) in the country, this allows for a richer environment for exploring interactions.
In particular, we posit that gas provisioning in 2010 is a function of inequality—vertical, horizontal, and political. Here, we expect that given the history of inequality traps and in light of the stagnating trends in inequality as documented in Table 2 above, current vertical and horizontal measures of land and income inequality carry within them information that reflects historical inequality levels. Thus, we use concurrent measures of gas provisioning, and land and income inequality. At the same time, there is likely to be some lag before political patronage is able to translate into public goods provisioning. For political inequality then, we use data from the 2008 election. Similarly, path dependency is likely to play a major role in public goods provisioning. Therefore, we control for past levels of gas by using the 1998 census data on average gas provisioning within each district.Footnote 13 Finally, we also include our diversity controls—a fractionalization index for each index based off of the census data, and the number of ethnic groups in each district. Keeping with academic tradition we use the measure of fractionalization from 1998 to minimize endogeneity between diversity and public goods (through migration).
Unlike in the trend analysis where data prevented identification of districts, for the regression analysis detailed district identification allowed us to take a finer approach to categorizing households into ethnic groups. In particular, along with the six primary language categories we were able to break-down the ‘others’ language category included in the dataset into ethnic groups beyond the key six highlighted above to provide a more nuanced measure of between-ethnic based inequalities in the various regions. Here, we relied on our own field-based knowledge to define four additional ethnic groups.Footnote 14 For example, there is a large ethnic Hazara presence in the Abbotabad and Mansehra districts. This group speaks a language that is very different from the dominant Pashtu but does not have a code of its own. It would, however, be reasonable to assume that the language coded as ‘others’ in these districts is Hindko—the language spoken by ethnic Hazaras. There were a large number of observations that could not be identified precisely: Urdu speaking people in Balochistan, for example, could belong to any ethnic category. Often the only two ethnic groups in a district were either Baloch or unidentified. Ignoring this population would have meant forcing the measure of group inequality to zero. We therefore coded these populations as “Urdu speaking people in Balochistan”; while this category does not have any political or social significance, it allows us to see if they as a group have a different income/land distribution than the Baluch. We followed a similar exercise in Khyber Pakhtun-Khwa.
Finally, we dropped any group whose number was less than 30 within a district allowing for increased statistical robustness.
5.2.1 Comparing Between- and Within-Group Inequalities
One concern with including both between- and within-group inequalities in the regression analysis relates to the level of correlation between these two measures. We explore this by looking at the overall correlation between the horizontal and vertical measures for each of our variables of interest. Table 7 reports the correlation levels for the between- and within-group measures for our primary variables of interest.
As is evident, the horizontal and vertical measures are weakly correlated. Furthermore, upon examining the horizontal inequality for districts with the highest levels of vertical inequality, we do not find that the regions that are the most deprived in terms of the first inequality measure are also the worst performers in terms of the other. In fact, since the number of ethnic groups in our data varies from one to seven, there are districts that have no ethnic fractionalization and therefore their between-group inequality measures are zero. For these districts then, our variables capturing vertical inequality effectively become the only inequality measures.
5.2.2 Regression Results: Proportion of Households in a District with Natural Gas
We start our regression analysis by first looking at the effect of previous gas levels in the district (Gas’98) and that of fractionalization (Table 8). Gas’98, which measures the proportion of households in a district that had access to gas in 1998 serves to capture path dependency. We also include fractionalization in our base regression since a large literature has found a strong negative association between fractionalisation—a measure of diversity—and public goods provisioning.
Not only do these expectations pan out, but a look at the R2 for the two regressions suggests that previous provisioning levels explain most of the variation in current gas levels. In fact, even additions of the inequality variables in later regressions do not see substantial increases in the R2. Thus, there is a high level of path dependency. A simple explanation would be that the marginal costs of providing a household with gas decreases as the share of households with gas in a district increases. Once the delivery infrastructure is largely in place, adding an extra household is not expensive. A second, more complex explanation could be that, for historically low levels of provisioning, the political process could not be harnessed to increase provisioning—marginalized communities have been unable to use the political process to increase access to services. Similarly, relatively well-off communities with historically higher levels of provisioning in 1998 have increased their access to services regardless of political inequality. Moreover, column 2 in Table 8 suggests that given historical provisioning, higher diversity reduces the provisioning of gas. This is consistent with the bulk of literature that suggests that higher diversity reduces the probability of effective collective action. The coefficient on fractionalization remains strongly significant in all of the specifications and stable in magnitude as well—ranging from 0.19 to 0.27 but mostly a few percentage points around −0.22. This implies that a 0.1 change in fractionalization would lead to a decrease in gas provisioning, on average, from 0.23 to 0.21%.
Next we add in our vertical and horizontal inequality measures. We run separate regressions for all three categories of inequality—income, land, and political. For each analysis we also include a control for the number of ethnic groups since measures of horizontal inequality are very sensitive to the number of groups over which inequality is measured.
Particularly when it comes to exploring income effects it is important to consider that richer districts may have higher levels of the public good simply because it may be easier for such areas to access the state. Column 1 in Table 9 shows the effect of average district income. While we find a positive significant link between average district income and gas levels, the effect of average income becomes insignificant when we include our inequality measures.
More importantly while Column 2 in Table 9 shows no significant effect of the within measure, horizontal income inequality and gas provisioning have a significant and positive link. Not only is the effect very significant, the magnitude of the coefficient is also very large. In the base regression in column 2, the effect of horizontal inequality is 8 times that of fractionalization: an increase in inequality of 0.1 points increases access to gas by almost 17% points—a very large effect by any measure.
Once we add the square of horizontal income inequality, (column 3) we find that this relationship is actually non-linear. At low levels of inequality an increase in inequality increases access while the relationship reverses at higher levels of inequality. One possible conjecture to explain this result involves noting that the Theil measure of inequality is particularly sensitive to the tails of the relevant distribution. In what follows, we explore the possibility of patrons in the upper-tail who may be driving such a result. Our hypothesis is that such a patron could, by rallying people around him, overcome the negative effects of group inequality on collective action. Such a patron could also have privileged access to the state.
Theoretically, however, defining patrons from the upper centiles of the income distribution is problematic because of truncation of the income data in the PSLM and the subsequent under-representation of richer households (See Burki et al. 2015). Given that the Pakistan specific literature discusses patron-client networks with particular reference to landed patrons, we turn to its exploration for the case of land instead.
Column 1 in Table 10 again shows a positive link between our HI measure—in this case (agricultural) land—and gas provisioning. The addition of a square term (Column 2) however again suggests that this relationship is non-linear. The negative relationship at higher levels of inequality is consistent with the literature. In order to explain the positive association at lower levels of inequality from a patron-client perspective we run two additional regressions. Column 3 in Table 10 includes the number of households within the district who own land in excess of 100 acres,Footnote 15 along with an interaction term between our patron and HI variables, while column 4 in Table 10 includes the number of households within the district who own land in excess of 400 acres, and again an interaction term between our patron and HI measures. In both cases, the effect of the patron is statistically significant, while the sign and significance of the HI measure continues to hold as well. Yet, the direction of the effect of the two types of patrons differs. While provisioning is decreasing in the number of households with 100 acres of land (i.e. the smaller patron), it is increasing in the number of households with land in excess of 400 acres.
With respect to the smaller patron, it could be that as their number rises and the constituent group gets further fragmented the provision of a non-excludable public good that is difficult to target declines. In contrast, patrons who own agricultural land in excess of 400 acres are considerably more powerful than those with a 100 acres due to the link between land and social as well as political power. This suggests that the results may be driven by the link between landholding and the political process where patrons are using public goods provisioning as a means to garner more votes. We investigate this through our political inequality regressions.
Column 1 in Table 11 indicates no significant effect of our overall political inequality measure. While this measure is based off of the vote gap between the winner and the runner-up, in order to identify whether political patrons at the district level have any impact on gas provisioning we run additional regressions. For these we calculated how many political candidates were able to command a significant chunk of the vote 10% versus 20 versus 30 and so on and so forth, with the influence of the patron increasing in the electorate that (s)he commands. Given that constituency size can vary by district, we weighted this political patron variable by size of the constituency. Columns 1 through 5 in Tables 11 and 12 in “Appendix C” show the effects of political patrons of differing strength. While there is no significant effect of the number of candidates who are able to attract 10% of the vote, as the number of candidates who command 20% of the vote increases, there is an increase in provisioning.
This indicates that as competition increases politicians are amenable to public demand. In contrast, when we look at political patrons who draw from 40 to 90% of the votes (column 5 in Tables 11 and 12 in “Appendix C”), not only is there no significant effect but the sign is negative. Not only are these political patrons likely to be extremely powerful but since they have no political competition, they have no incentive to meet public good demands. Finally, columns 6 and 7 in Table 11 explore how political patronage interacts with land-based patronage to effect gas provisioning. We include the 400-acre landed patron in the regression with the 20-percent political patron variable (column 6), and also include an interaction term between the two variables (column 7). Two results are note-worthy: (1) The significance and direction of the political patron variable does not change even in the presence of (large) landed patrons, and (2) The presence of a landed patron has no statistical bearing on gas provisioning once we control for the political process. Together, these factors suggest that not only does political competition matter but that landed elite are not pushed to deliver public goods unless doing so provides a means to consolidate political power.
6 Conclusion
This study shows that ethnic inequalities in land and income are significantly associated with access to a subsidized public good. We also document a strong relationship between political competition and public goods provisioning. While recent literature has documented the (negative) association of public goods and group inequality, we are unaware of any work that has looked at the intersection of horizontal inequalities and political competition. This paper is an effort to fill this gap.
First, by using voting data from the 2008 election we construct measures of political competition and patronage for each district in Pakistan. We augment this data by constructing district level measures of income and land inequality, both horizontal and vertical, using Household survey data from 2010. We find that measures of horizontal income and land inequality are non-linearly associated with natural gas provisioning. At lower levels of ethnic inequality, an increase in inequality is associated with higher access to the public good while this association reverses at higher levels of ethnic inequality. Second, we find that districts with very large land holding patrons are associated with higher gas provisioning. Thirdly, the effect of these large patrons becomes insignificant when we control for political competition. In particular, we find that districts where political competition is high i.e. when there are a number of agents who can garner at least 20% of the vote, have higher access to the public good. On the other hand, districts where an agent can garner 40% or more of the votes cast and does not face much competition, are associated with lower provisioning.
These findings generate several concerns. Firstly, the concave relationship between group inequality and public goods provisioning suggests that areas with very high inequalities will systematically lag behind less unequal areas. This implies that areas with high proportions of economically excluded communities are precisely the ones that are left behind by the state. The positive side, however, is that political entrepreneurs can potentially leverage these inequalities and lack of provisioning to garner votes. To the extent that political entrepreneurship is endogenous, this warrants further work into studying the emergence of local level political leadership.
Change history
12 March 2019
The article Patronage and Public Goods Provisioning in an Unequal Land, written by Hadia Majid and Rashid Memon, was originally published electronically on the publisher's internet portal (currently SpringerLink) on March 2018 without open access.
With the copyright holders decision to opt for Open Choice the copyright of the article changed on February 2019 to © UNU-WIDER 2019, and this book is licensed under the terms of the Creative Commons Attribution-NonCommercial-ShareAlike 3.0 IGO License (<ExternalRef><RefSource>https://creativecommons.org/licenses/by-nc-sa/3.0/igo/</RefSource><RefTarget Address="https://creativecommons.org/licenses/by-nc-sa/3.0/igo/" TargetType="URL"/></ExternalRef>), which permits any noncommercial use, sharing, adaptation, distribution, and reproduction in any medium or format, as long as you give appropriate credit to the UNU-WIDER, provide a link to the Creative Commons licence and indicate if changes were made. If you remix, transform, or build upon this book or a part thereof, you must distribute your contributions under the same licence as the original.
Notes
Natural gas for residential consumption is priced at 6 times less than that for commercial consumption.
The basic geographical unit of administration in Pakistan.
According to the Pakistan Census of Population 1998, 96 per cent of Pakistan’s population is Muslim (GOP 1998: 355).
There were seven large ethnic groups prior to Bangladesh’s separation in 1971, with Bengalis being the most populous.
Muhajir—literally migrant—is a term that the Urdu speaking population in Sindh use to identify their group politically.
Discussing different mechanisms that allow inequalities to persist, Tilly focuses on the relations of exploitation between dominant and subordinate groups and the maintenance of institutions and practices that support these relationships.
The remainder of this section relies heavily on the Bureau of Statistics website http://www.pbs.gov.pk/content/pakistan-social-and-living-standards-measurement.
2010–11 is the only year for which we have both the general as well as the district representative surveys of the PSLM.
The following is based on a telephone conversation with a bureaucrat closely linked to FBS.
There has been some discussion within the literature on the limitations surrounding the use of income based inequality measures (see for instance, Burki et al. 2015). Alternatives to income inequality measures include those related to wealth and consumption. We argue that our land inequality measure is in fact a proxy for wealth inequality. Secondly, consumption data within the PSLM is only obtained for a sub-sample of the surveyed population rendering its use inapplicable for our regression analysis. Thirdly, the critique that survey data underestimates income-inequality because of the inability to survey households at the higher end of the distribution applies equally to consumption inequality.
Note that while the PSLM 1990-91 does not have language and so we are unable to calculate ethnicity based inequality measures, we include this year for our provincial and regional inequality measures so as to give a longer time trend.
Note that the 1998 values are not from a round of the PSLM but from the census i.e. these are the population values and not survey estimates. Since the 1998 data is actual data, it captures the earlier differences across districts exactly. Since the survey data is representative at the district level, regardless of whether it is comparable with the 1998 census, it should capture the differences across districts in gas provisioning in 2010.
Our seven distinct ethnic groups are Urdu-speaking, Punjabis, East Punjabis, Sindhis, Seraikis, Baluchis, Hazara.
We find that the 95th percentile of land is about 100 acres. Therefore, we define a potential patron as someone who lies in the top 5 percent of the land distribution i.e. a household that has more than a 100 acres of land.
References
Alesina, A., Glaeser, E., & Sacerdote, B. (2001). Why doesn’t the US have a European-style welfare system? (No. w8524). National bureau of economic research.
Alesina, A., Michalopoulos, S., & Papaioannou, E. (2012). Ethnic inequality. (NBER Working Paper No. 18512). Retrieved from National Bureau of Economic Research website:http://www.nber.org/papers/w18512.
Alesina, A., & Zhuravskaya, E. (2011). Segregation and the quality of government in a cross section of countries. The American Economic Review,101(5), 1872–1911.
Andrabi, T., Das, J., & Khwaja, A. I. (2015). Report cards: The impact of providing school and child test scores on educational markets. (Policy Research Working Paper WPS 7226). Retrieved from World Bank Website http://documents.worldbank.org/curated/en/789721468191341184/pdf/WPS7226.pdf.
Baldwin, K. (2013). Why vote with the chief? Political connections and public goods provision in Zambia. American Journal of Political Science,57(4), 794–809.
Baldwin, K., & Huber, J. D. (2010). Economic versus cultural differences: Forms of ethnic diversity and public goods provision. American Political Science Review,104(4), 644–662.
Banerjee, A., & Iyer, L. (2005). History, institutions, and economic performance: the legacy of colonial land tenure systems in India. The American Economic Review,95(4), 1190–1213.
Banerjee, A., Iyer, L., & Somanathan, R. (2006). Public action for public goods. In T. Paul Schultz (Ed.), Handbook of agricultural economics, vol. 4 (forthcoming).
Bedard, K., & Ferrall, C. (2003). Wage and test score dispersion: some international evidence. Economics of Education Review,22(1), 31–43.
Blau, F. D., & Kahn, L. M. (2005). Do cognitive test scores explain higher US wage inequality? The Review of Economics and Statistics,87(1), 184–193.
Burki, A. A., Memon, R., & Mir, K. (2015). Multiple Inequalities and Policies to Mitigate Inequality Traps in Pakistan. Department of Economics, Mushtaq Ahmad Gurmani School of Humanities and Social Sciences, Lahore University of Management Sciences.
Cheema, A., Naqvi, A. A., & Siddiqi, B. (2012). Land rights and long-run development: Evidence from Pakistan. Available online at https://editorialexpress.com/cgi-bin/conference/download.cgi?db_name=CSAE2013&paper_id=974. Accessed 25 Jan 2017.
Cheema, A., & Naseer, F. (2010). Poverty, mobility and institutions in rural Sargodha: evidence for social protection reform. Report submitted to the Planning and Development Department (P&DD) of the Government of Punjab.
Cheema, A., & Naseer, M. F. (2013). Historical inequality and intergenerational educational mobility: The dynamics of change in rural Punjab. The Lahore Journal of Economics,18, 211. (special edition).
Deiwiks, C., Cederman, L. E., & Gleditsch, K. S. (2012). Inequality and conflict in federations. Journal of Peace Research,49(2), 289–304.
Deshpande, A. (2000). Does caste still define disparity? A look at inequality in Kerala, India. The American Economic Review,90(2), 322–325.
Di Cesare, M., Bhatti, Z., Soofi, S. B., Fortunato, L., Ezzati, M., & Bhutta, Z. A. (2015). Geographical and socioeconomic inequalities in women and children’s nutritional status in Pakistan in 2011: An analysis of data from a nationally representative survey. The Lancet Global Health,3(4), e229–e239.
Ferreira, F. H. (2001). Education for the masses? The interaction between wealth, educational and political inequalities. Economics of Transition,9(2), 533–552.
Haq, R., & Arshid, N. (2009). Inequality and welfare by food expenditure components. Pakistan Development Review,48(4 Part II), 755–768.
Jacoby, H., & Mansuri, G. (2011). Crossing boundaries: Gender, caste and schooling in rural Pakistan. (Policy Research Working Paper WPS 5710). Retrieved from World Bank website http://documents.worldbank.org/curated/en/941421468073730366/pdf/WPS5710.pdf.
Jamal, H. (2006). Does inequality matter for poverty reduction? Evidence from Pakistan’s poverty trends. The Pakistan Development Review, 45(3), 439–459.
Kanbur, R., & Venables, A. J. (2003, October). Spatial inequality and development. In Introduction to an edited volume of papers from the Cornell-LSE-WIDER conference on Spatial Inequality and Development.
Kemal, A. R., Irfan, M., & Mahmood, N. (2003). Population of Pakistan: an analysis of 1998 population and housing census. Pakistan Institute of Development Economics, Islamabad.
Khwaja, A. I. (2009). Can good projects succeed in bad communities? Journal of Public Economics,93(7), 899–916.
Lessmann, C. (2014). Spatial inequality and development—is there an inverted-U relationship? Journal of Development Economics,106, 35–51.
Lizzeri, A., & Persico, N. (2001). The provision of public goods under alternative electoral incentives. American Economic Review, 91(1), 225–239.
Luttmer, E. F., & Singhal, M. (2011). Culture, context, and the taste for redistribution. American Economic Journal: Economic Policy,3(1), 157–179.
Manzetti, L., & Wilson, C. J. (2007). Why do corrupt governments maintain public support? Comparative Political Studies,40(8), 949–970.
Memon, R. (2013). Wage Discrimination in Pakistan’s Labor Markets: The Impact of Ethnicity. Mimeo. Lahore University of Management Sciences.
Mohmand, S., & Gazdar, H. (2007). Social structures in rural Pakistan. Thematic paper prepared under TA4319, Determinants and Drivers of Poverty Reduction and ADB’s Contribution in Rural Pakistan. ADB, Islamabad.
Munshi, J. (2014). A Method for Constructing Likert Scales. Available at https://papers.ssrn.com/sol3/papers.cfm?abstract_id=2419366. Accessed 01 Oct 2016.
Powell, J. D. (1970). Peasant society and clientelist politics. American Political Science Review,64(2), 411–425.
Rao, V. (2006). On “Inequality Traps” and Development Policy (No. 9588). Washington: The World Bank.
Sen, A. K. (1980). Equality of what? In S. McMurrin (Ed.), Tanner lectures on human values. Cambridge: Cambridge University Press.
Stewart, F. (Ed.). (2008). Horizontal inequalities and conflict: Understanding group violence in multiethnic societies. Houndsmills: Palgrave MacMillan.
Stewart, F., & Langer, A. (2008). Horizontal Inequalities: Explaining Persistence and Change. In F. Stewart (Ed.), Horizontal Inequalities and Conflict: Understanding Group Violence in Multiethnic Societies (pp. 54–82). Houndmills, UK: Palgrave Macmillan.
Tilly, C. (1999). Durable inequality. California: University of California Press.
Wantchekon, L. (2003). Clientelism and voting behavior: Evidence from a field experiment in Benin. World Politics,55(3), 399–422.
Wilkinson, R. G. (1996). Unhealthy societies: The afflictions of inequality. London: Routledge.
Acknowledgements
This paper was prepared under a grant administered by United Nations University UNU-WIDER. We are grateful to Maheen Javaid, Amna Naveed, and Syeda Warda Riaz for exceptional research assistance. We are also thankful to Rachel Gisselquist, Carla Canelas, Nishant Chaddha, two anonymous referees and to participants at the UNU-WIDER workshop for their comments and feedback.
Funding
This study was funded by UNU-WIDER (Grant number CP-59).
Author information
Authors and Affiliations
Corresponding author
Ethics declarations
Conflict of interest
We declare that there is no conflict of interest in the researching and writing of the paper “Patronage and public goods provisioning in an unequal land”.
Additional information
The original version of this article was revised due to a retrospective Open Access order.
Appendices
Appendix A
See Fig. 1.
Appendix B
HI Fomulae.
where \(\bar{\varvec{y}}_{\varvec{r}} = \frac{1}{{\varvec{n}_{\varvec{r}} }} \sum \nolimits_{\varvec{i}}^{{\varvec{n}_{\varvec{r}} }} \varvec{y}_{{\varvec{ir}}}\) is mean value for group r; R is group r’s population size; pr is group r’s population share; \(\varvec{y}_{{\varvec{ir}}}\) is the variable of interest e.g. years of education of the ith member of group r; yr is the value of yfor group; and yis the total of the variable of interest in the sample.
Note that we use population weighted formulae for each of our inequality measures since without population weighting changes in the position of a very small group would have the same effect on the index as that of a large group.
Appendix C
See Table 12.
Rights and permissions
This article is distributed under the terms of the Creative Commons Attribution 4.0 International License (http://creativecommons.org/licenses/by/4.0/), which permits unrestricted use, distribution, and reproduction in any medium, provided you give appropriate credit to the original author(s) and the source, provide a link to the Creative Commons license, and indicate if changes were made.
About this article

Cite this article
Majid, H., Memon, R. Patronage and Public Goods Provisioning in an Unequal Land. Soc Indic Res 145, 805–830 (2019). https://doi.org/10.1007/s11205-017-1707-0
Accepted:
Published:
Issue Date:
DOI: https://doi.org/10.1007/s11205-017-1707-0