
Abstract
In educational, social or organizational studies, open-ended concept maps are used as an instrument to collect data about and analyze individuals’ conceptual knowledge. Open-ended concept map studies devoted to knowledge and learning apply a variety of methods of analysis. This literature review systematically summarizes the various ways in which open-ended concept maps have been applied in previous studies of knowledge and learning. This paper describes three major aspects of these studies: what methods of analysis were used, what concept map characteristics were considered, and what conclusions about individuals’ knowledge or understanding were drawn. Twenty-five studies that used open-ended concept maps as a research instrument were found eligible for inclusion. In addition, the paper examines associations between the three aspects of the studies and provides guidelines for methodological coherence in the process of such analysis. This review underscores the importance of expatiating on choices made concerning these aspects. The transparency provided by this method of working will contribute to the imitable application of open-ended concept maps as a research tool and foster more informed choices in future open-ended concept map studies.”
1 Introduction
Concept maps were introduced by Novak and Gowin to activate or elaborate (prior) knowledge. “Concept maps are graphical tools for organizing and representing knowledge. They include concepts, usually enclosed in circles or boxes of some type, and relationships between concepts indicated by a connecting line linking two concepts” (Novak and Cañas 2008, p.1). Concept maps have a wide variety of applications and are an increasingly popular learning and strategy tool (e.g. Novak and Cañas 2008; Stevenson, Hartmeyer and Bentsen 2017). It is on the rise as an instructional method (e.g. Nair and Narayanasamy 2017), to aid in curriculum design (e.g. Buhmann and Kingsbury 2015) and as an assessment tool (e.g. Marriott and Torres 2016). In recent years, concept maps have been used more widely as a research instrument. This includes the application of concept maps to study knowledge, explore mental models and misconceptions, or to describe people’s opinions. Figure 1 provides an example of a concept map. The focus question or prompt for the example in Fig. 1 could have been “What is a concept map?” or the topic provided could have been ‘Concept maps’.
Example of a hierarchical concept map by Ed Dole (adapted from Dori 2004)
The words enclosed in circles are concepts, also referred to as nodes. These concepts are connected with arrows, or links, that are indicated with linking words, explaining the relation between the concepts. A proposition is a concept-link-concept combination, for instance ‘concept maps–include—hierarchies’. In this example, there are four hierarchies or strings of concepts stemming from the root concept ‘concept maps’. Links between concepts from the same hierarchy are called links. Links between concepts from different hierarchies are cross-links.
A concept map assignment includes: concepts or nodes, links or linking lines, linking phrases, and the concept map structure, and all these aspects can be either respondent driven or provided by the instructor (Ruiz-Primo 2000). For instance respondents think of concepts themselves, or are provided a list of concepts they can use for their concept map. In most studies that apply concept maps, at least one of these four aspects of the task is instructor-directed; most commonly, the concepts to be used are provided (Ruiz-Primo et al. 2001). In open-ended concept maps respondents choose their own terms for nodes, links or linking lines, linking phrases and structure, therefore they resemble the respondents’ knowledge structure (Cañas, Novak and Reiska 2013; Ruiz-Primo et al. 2001). Open-ended concept maps are graphical tools in which respondents are invited to represent their personal construction of knowledge, without instructor-directed aspects. In an open-ended concept map assignment, only a topic or prompt is provided to the respondents. For instance Ifenthaler, Masduki and Seel (2011) asked respondents to create a concept map to depict their understanding of research skills, Beyerbach (1988) asked students to draw a concept map for teacher planning and Çakmak (2010) asked respondents to generate a concept map concerning teacher roles in teaching process.
Open-ended concept maps are commonly applied to explore student knowledge, to evaluate what or how students learn or to explore misconceptions in student knowledge (Greene et al. 2013; Stevenson et al. 2017). The application of open-ended concept maps to study knowledge and learning faces new challenges concerning application and analysis, as this application transcends the traditional, strictly defined, quantitative use of concept maps in other domains, such as engineering, mathematics and psychology (Wheeldon and Faubert 2009). When exploring knowledge and learning, the strictly defined quantitative use of concept maps is believed not to do justice to the personal and idiosyncratic nature of people’s understanding (Novak 1990). Open-ended concept maps are therefore used to study people’s knowledge and understanding of complex phenomena, such as leadership or inclusive education. They are also used when respondents’ knowledge is expected to be fragmented, or when the misconceptions and/or limited nature of people’s understanding are part of the study (Greene et al. 2013; Kinchin, Hay and Adams 2000).
The variation in outcomes using open-ended concept maps as a research instrument reduces the comparability and leads to difficulty in data analysis (Watson et al. 2016a; Yin et al. 2005). Previous studies describe limitations concerning methods of analysis. Several studies argue that quantitative analysis neglects the quality or meaning and learning (Bressington, Wells and Graham 2011; Buhmann and Kingsbury 2015; Kinchin et al. 2000). Others argue that it is an insufficient evaluation of values or perceptions as expressed by respondents (Jirásek et al. 2016). Some studies address contradicting outcomes when methods of analysis are compared, and they question the validity and reliability of concept map analysis and concept maps as a research instrument (Ifenthaler et al. 2011; Kinchin 2016; Watson et al. 2016a; West et al. 2002). Cetin, Guler and Sarica (2016) claim that it is unclear how the reliability and validity of open-ended concept map analysis can be determined. Additionally, Ifenthaler et al. (2011) argue that some of the methods of analysis applied in previous studies have questionable reliability and validity. Tan, Erdimez and Zimmerman (2017) complement these statements by addressing the lack of clarity they perceived in the existing methods of analysis when choosing a method of analysis for their study.
This literature review explores the analysis of open-ended concept maps in previous studies. Firstly, we contemplate what aspects of the process of analysis to consider for this review, based on the quality appraisal of the process of analysis in qualitative research. Creswell (2012) emphasizes the interrelation of the steps concerning data gathering, interpretation and analysis in qualitative research. Accordingly, Huberman and Miles (2002) proposed three central validities for assessing the quality of qualitative research: descriptive, interpretative and theoretical. These are respectively concerned with the data collected or the characteristics of the data that are considered, how data are interpreted or analyzed, and the conclusions that are drawn. These three aspects should be aligned or coherent to increase the quality of research, and are therefore explored in previous open-ended concept map studies. The method of analysis applied, concept map characteristics measured, and conclusions drawn, and the associations between these aspects are explored (Chenail, Duffy, George and Wulff 2011; Coombs 2017). The research question is: Which methods of analysis are applied to open-ended concept maps when studying knowledge and learning, and how are these associated with concept map characteristics considered and conclusions drawn?
2 Method
To answer the research question, we extract information concerning method of analysis applied, concept map characteristics measured, and conclusions drawn from previous open-ended concept map studies. Following guidelines for critical interpretative synthesis reviews, this review combines an aggregative and interpretative approach to critically understand the analysis in previous studies (Gough and Thomas 2012). The aggregation entails the representation of clusters for each aspect based on cross-case analysis, as presented in the results. Subsequently, patterns among these aspects are explored and interpreted, leading to considerations for future studies concerning these three aspects and their methodological coherence.
2.1 Selecting articles (inclusion)
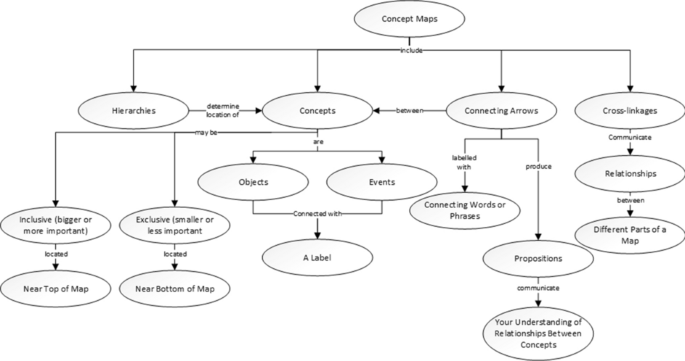
This review applies a comprehensive search strategy to include all relevant studies (Verhage and Boels 2017). Scientific articles are selected from three databases: the Education Resources Information Center (ERIC); PsycINFO; and the Web of Science (WOS). The keywords for the search are ‘concept map’, and ‘analysis’ or ‘assessment’ or ‘scoring’. Studies are included from 1984 onward, when Novak and Gowin established the term ‘concept map.’ Due to the broad social science disciplines included in WOS, a further selection is made based on the predetermined WOS Category ‘Education educational research’, to exclude for instance geographical studies that map cities, and are not concerned with knowledge or learning but spatial planning. The combined search yields 451 studies in ERIC, 198 studies in PsycINFO and 498 studies in WOS.
Three reviews of concept maps studies are used in a selective search strategy: the open-ended concept map studies described in these reviews are included in this study (Anohina and Grundspenkis 2009; Ruiz-Primo and Shavelson 1996; Strautmane 2012). Based on the snowballing technique with these reviews, 85 additional studies are included, and 1316 in total, as depicted in Fig. 2. The first review by Anohina and Grundspenkis (2009) presented manual methods of analysis, and addressed the feasibility of automating these methods. The reviews by Ruiz-Primo and Shavelson (1996) and Strautmane (2012) related methods of analysis to the openness of the concept mapping assignments. These reviews did not explore the associations between the methods of analysis and the conclusions drawn in these studies. Our review is one of the first to address the associations between the methods of analysis, the concept map characteristics considered and the conclusions drawn, instead of focusing on these aspects separately. This coherence is relevant to explore as it enhances the rigor and quality of qualitative studies, by ensuring an appropriate alignment of these aspects within studies (Davis 2012; Poucher et al. 2020).
Search and selection strategy
2.2 Screening articles (exclusion)
The selected articles are screened. 254 duplicates are excluded. Next titles and abstracts are screened. In order to increase the quality of this process, the inclusion and exclusion criteria are discussed with co-researchers until consensus is reached. 703 articles did not apply concept maps, or concept maps were used as learning tool, instructional tool, for curriculum design or to analyze answers, texts or interviews. These are excluded. For the remaining 359 studies that apply concept maps as research instrument, step 2 of the screening is based on the methods section. Studies are included based on the following inclusion criteria:
-
Concept maps were used as a research instrument;
-
The study was an empirical study;
-
Respondents made their own concept map; and
-
An open-ended concept map assignment was applied.
In seven studies, other visual drawings than concept maps were used. In 31 studies, concept map analysis was described based on theory instead of empirical data. In 71 studies, concepts map were constructed by the researcher based on interviews, together with the respondent during an interview or at group level based on card sorting techniques. In 154 studies, at least one of the aspects of the concept mapping task was instructor-directed. Studies are included if one or more focus questions or one central concept was provided.
The critical appraisal of the methods section, leads to two additional exclusion criteria (Verhage and Boels 2017). Seventy studies applied another research instrument alongside concept maps. For these studies, the results sections are read to discover whether concept maps were evaluated separately. In 30 studies, concept map analysis was combined with interviews or reflective notes. 36 studies compared concept map scores with results from other research instruments, such as knowledge tests or interviews. These studies were excluded because the method of analysis or conclusions for the concept maps was not described separately. This is problematic for our research purposes, as this study is concerned with concept map analysis and conclusions based on concept maps analysis, and not analysis and conclusions based on other instruments. Four studies that applied two instruments—but reported on the analysis of concept maps separately—are included.
For step 3 of the selection process, the full texts of the remaining 30 studies are read. Five studies are excluded; in two studies, different concept map characteristics are summed up and not described separately. One study calculated correlations between different concept map characteristics, and two studies drew conclusions purely on group level, resulting in 25 studies being included in this review, as depicted in Fig. 2.
2.3 Data selection from articles
Information on the following topics is extracted from the articles: the method of analysis, the concept map characteristics, the conclusions, the rationale behind the choices made, and general or descriptive information. A data selection scheme is developed which depicts the extracted information (Table 1). To increase the reliability of the data selection, this scheme was continuously discussed and adjusted by the authors over the entire selection process. Reliability was further ensured by using signal words, based on common terms used in the studies. For three of the studies included, the data selection was performed independently by two researchers. Both researchers selected statements from the articles concerning the items described in Table 1. One researcher included 79 statements and the other 94 statements. The statements selected by the researchers overlapped completely. The 15 statements only selected by one researcher were discussed and added to the data. A total of 109 citations were extracted from these three studies.
2.4 Data analysis
Data analysis is performed by using the selected articles for within- and cross-case analysis (Miles and Huberman 1994). In this review, the cases are the articles included. The first step of analysis is to order the extracted information in a meta-matrix (see "Appendix A") that presents all relevant condensed data for each case or article separately (Miles and Huberman 1994). If no explicit statements are found, information is added by using the within-case analytic strategy of ‘overreading’ (Ayres, Kavanaugh and Knafl 2003). For instance, for a study that counted specific concept map characteristics but did not describe the method of analysis any further, the method of analysis was described as quantitative analysis. To prepare data for cross-case analysis, different labels for the same aspect are unified. For instance, ‘counting nodes’ is relabeled as ‘number of nodes.’
The second step entails coding the selected statements concerning the research object, research design, methods of analysis, concept map characteristics, and conclusions drawn in the articles, using a cross-case analysis approach. Preliminary coding of statements concerning methods of analysis is based on the way studies refer to their method of analysis. However, the same term was sometimes used to refer to more than one analysis method, while in other cases, multiple terms were used to refer to a single method. Thus, the designation of clusters based on how the studies referred to their methods of analysis proved inconclusive and ambiguous.
Different distinctions between methods of analysis are found in the literature. For example, in the review by Anohina and Grundspenkis (2009) the use of an expert’s map is one choice, as well as the choice for quantitative or qualitative analysis and structural or relational analysis, to make a distinction between methods of analysis. In the review by Strautmane (2012), the criteria for similarity analysis, e.g. “proposition similarity to expert’s CM”, or “convergence with expert’s CM”, are described as separate criteria. Also in the review by Ruiz-Primo and Shavelson (1996), comparison with a criterion map, is described as a separate method of analysis. In this review, the distinction between quantitative, qualitative, similarity and holistic analysis is chosen, as these methods of analysis consider the concept map characteristics distinctively and they are based on different principles and theoretical assumptions. Holistic analysis is a separate method of analysis, as it is based on a rubric, and similarity is a separate analysis, as it is based on a reference map. Moreover, these four methods of analysis lead to different types of conclusions, and are therefore considered as distinctive ways to analyze and interpret data from concept maps. In conceptual terms, these four methods of analysis are mutually exclusive, as they estimate the concept map characteristics differently. However, when applied to analyze data, they can be combined: similarity analysis compares concept maps to a reference map, either qualitatively or quantitatively.
The statements concerning concept map characteristics are unified; for instance, ‘breadth and depth’ or ‘hierarchical structure of the map’ were both coded as structural complexity. All concept map characteristics related to the semantic content of the map, referred to as ‘terms used’, ‘content comprehensiveness’, ‘correctness’ or ‘sophistication’, are clustered as semantic sophistication. The conclusions are clustered in the same way as the methods of analysis. Conclusions about numbers of concept map characteristics are labelled as quantitative, conclusions about descriptions are labelled as qualitative, conclusions about overlap with a reference map are labeled as similarity and conclusions about the quality of the map as a whole are labelled as holistic.
For the same three studies that two researchers selected statements from independently, the statements were coded by two researchers independently. A total of 109 statements were coded. Krippendorf’s alpha of the inter-rater agreement was 0.91. The discrepancies in coding were all related to concept map characteristics. For instance, counting cross-links was coded as interlinkage by one researcher and as structural complexity by the other researcher, while the validity of links was labeled as semantic sophistication by one researcher and category representation by the other. The first author coded the data from the remaining 22 articles included in the review and consulted the co-authors when in doubt.
The third step of the analysis was exploring the associations between the methods of analysis, concept map characteristics and conclusions drawn. Across all articles, the associations between the choices made in these three areas were explored. For instance, for all studies that applied quantitative analysis, the concept map characteristics considered were explored and listed. This showed that quantitative analysis was concerned with specific concept map characteristics, e.g. size, structural complexity, category representation, interlinkage or complexity index. Subsequently, the conclusions drawn were explored for each combination of methods of analysis and concept map characteristics considered. Based on the associations found across articles between the methods of analysis applied, the concept map characteristics considered and the conclusions drawn, considerations for methodological coherence between these aspects were formulated.
3 Results
Twenty-five empirical studies from 1988 through 2018 used open-ended concept maps. Twenty-one of these studies consisted of multiple measurements, most commonly a pre-test/post-test design. Four of these studies compared two experimental groups, and two compared an experimental and control group. Two of the four studies that consisted of one measurement compared two experimental groups. In two studies, respondents received their previous concept map to adjust in the post-test, and in one study respondents could choose to adjust their previous map or to start a new one. Concept maps were either made on paper with pen, on sticky notes or on a computer, most commonly with the CMapTool, developed by the Florida Institute for Human and Machine Cognition. "Appendix A" provides the meta-matrix of these studies, including all selected information. For each aspect (method of analysis, concept map characteristics, and conclusions) the categorization or clustering based on the cross-case data analysis is presented in separate paragraphs. How concept map characteristics are associated with methods of analysis is described in the paragraph concerning the concept map characteristic. How conclusions drawn are related to concept map characteristics and methods of analysis is described at the end of the paragraph concerning conclusions drawn.
3.1 Methods of analysis
The different methods of analysis as described in the studies are extracted and presented in the table below. The explanation of these methods of analysis is provided after Table 2.
Based on these studies it appears that the same term was sometimes used to refer to more than one analysis method, while in other cases, multiple terms were used to refer to a single method. These varieties increase the ambiguity experienced with concept map analysis, as described by Watson et al. (2016b). Based on the ways in which concept map characteristics are estimated, we propose the following distinction: quantitative, similarity, holistic and qualitative analysis. Quantitative analysis, or counting concept map characteristics, was performed absolutely or relatively—for example, the number of links was counted separately or calculated in relation to the number of nodes. Category representation was also determined absolute, as the number of nodes belonging to a category, or relative, dividing the number of nodes belonging to a category by the total number of nodes in a map. These different calculations can result in different conclusions. According to Besterfield-Sacre and colleagues (2004, p. 113), quantitative analysis “fails to capture the quality of that content. Further, these scoring methods can be time consuming, lack standards, and may introduce inappropriate bias.”
Similarity analysis described or calculated the percentage of overlap and/or discrepancy compared to a reference map. To calculate percentage of overlap, the terms used by respondents need to be aligned with the reference map. Similarity analysis provided insights into the (degree of) overlap and discrepancies with a reference map and was performed manually or in an automated manner (Ifenthaler et al. 2011).
Holistic analysis included scoring the structure or content for the concept map as a whole. Besterfield-Sacre and colleagues (2004) developed the scoring rubric that was commonly used for holistic analysis. They developed this rubric to score the overall comprehensiveness, organization and correctness of the map, based on the topics experts discussed while analyzing concept maps. Holistic analysis was determined on an inter-rater basis and is a cognitive complex task for which subject matter knowledge is necessary; this scoring is subjective (Borrego et al. 2009; Yaman and Ayas 2015).
Qualitative analysis of semantic content was performed in most studies, either inductively or deductively to determine categories. Qualitative analysis was the only way to explore concept maps content inductively.
Most studies applied more than one method of analysis. Quantitative analysis was applied in 19 studies, qualitative analysis also in 19 studies, holistic analysis in six studies and similarity analysis in five studies. Why methods of analysis were chosen is described in several studies. Ritchhart and colleagues (2009, p. 152) stressed that qualitative analysis “allowed us to best represent all of the data from the maps”. Beyerbach (1988, p.339) applied qualitative analysis, as it revealed “the nature of growth of student teachers’ thinking [..] and conceptual development”. Quantitative analysis was chosen as it “demonstrates the student learning gains” (Borrego et al. 2009, p.14). Similarity analysis was performed as “Comparisons of the students' maps to an expert's map will provide information regarding how much is learned from the course and whether the concepts that are learned and included in the maps are done so "correctly" and as intended according to the expert-the faculty instructor” (Freeman and Urbaczewski 2002, p. 42). Besterfield-Sacre et al. (2004, p. 109) choose holistic scoring to explore students’ conceptual understanding, as an increase in understanding results “in higher quality maps as reflected by the holistic score.”
3.2 Concept map characteristics
This section describes what concept map characteristics were measured, how and why. Table 3 provides an overview of the results. The concept map characteristics described in this review concern characteristics as portrayed in the included studies. These include characteristics concerning the structure of concept maps, such as size, structural complexity and type of structure, and characteristics concerning the content of concept maps, for instance the terms used or categories represented in concept maps. The different concept map characteristics as portrayed in the included studies are presented below.
3.2.1 Size
The number of nodes was referred to as the size or extent, and considered as “a simple indicator for the size of the underlying cognitive structure” (Ifenthaler et al. 2011, p. 55). Size was established by counting the number of unique or correct nodes or propositions. Invalid nodes were included to study mental models or when misconceptions were important.
3.2.2 Structural complexity
Structural complexity is concerned with how complex the structure of a concept map is. The concept map nodes and links were used to study structural complexity quantitatively, holistically or in similarity. The scoring system for structural complexity from Novak and Gowin (1984), based on the number of hierarchies, cross-links and examples, was applied in seven studies, and these measures were adjusted in four of these studies. Specific aspects of structural complexity, were breadth or number of hierarchies and depth or hierarchy level (Beyerbach 1988; Read 2008). Other references to structural complexity, all calculated based on the number of links, are complexity, connectedness or dynamism and these measures are more commonly used for non-hierarchical concept maps (Ifenthaler et al. 2011; Tripto et al. 2018; Weiss et al. 2017). Freeman and Urbaczewski (2002, p. 45) computed structural complexity as the number of relationships depicted in the map beyond the minimal amount necessary to connect all of the concepts linearly. Ifenthaler and colleagues (2011) included computations from graph theory, such as unlinked nodes that are not connected to the other nodes, the cyclic nature of a map, i.e. if all nodes can be reached easily, or the longest and/or shortest paths from the central node. Structural complexity was also scored based on a rubric, taking into account the overall organization of the map. For instance a score of 1 if the concept map is connected only linearly, a score of 2 when there are some connections between hierarchies, or a score of 3 for a sophisticated structure (Besterfield-Sacre et al. 2004). Another way to score structural complexity is by comparing structural characteristics with a reference map (Ifenthaler et al. 2011).
The analysis of structural complexity is more sensitive in measuring change than other analyses (West et al. 2000). However, the limited hierarchical interpretation of structural complexity based on quantitative analysis can lead to different scores than holistic scoring of structural complexity (Watson et al. 2016a). According to West and colleagues (2000, p. 821), scoring structural characteristics “[becomes] more difficult as maps grow more complex,” and Blackwell and Williams (2007, p. 7) mentioned that scoring structural characteristics “can conceal the essentially subjective basis on which it rests.”
3.2.3 Type of structure
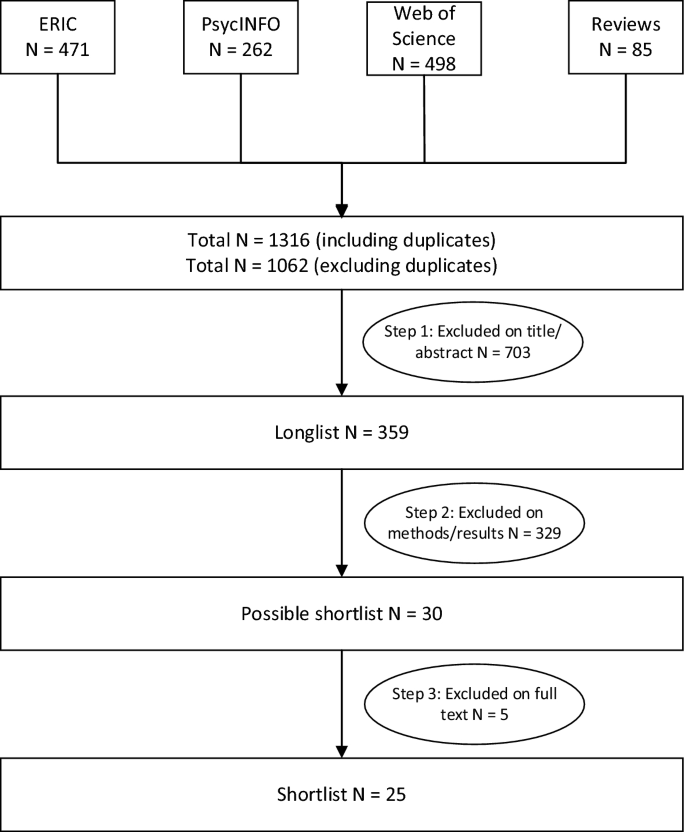
Studies concerned with the type of structure or shape of the map categorized concept maps qualitatively based on global morphologies. Global morphologies are common typical structures found in concept maps, such as chain, spoke or net structures, as depicted in Fig. 3. This analysis provides a measure for the aptitude for learning and “avoids many pitfalls of quantitative analysis” (Hay et al. 2008, p. 224). Yaman and Ayas (2015, p. 853) categorized concept maps based on their type of structure, and stated that it was “very easy and informative.”
Global morphologies in concept maps (from Kinchin, Hay and Adams 2000)
3.2.4 Semantic sophistication
Semantic sophistication is concerned with the terms as used by the respondents, for concepts as well as for links. Semantic sophistication was explored by describing or clustering the terms used by the respondents qualitatively. Analysis of the semantic sophistication or content revealed the information in concept maps and what respondents think (Kostromina et al. 2017; Ward and Haigh 2017): “These qualitative analyses go beyond traditional assessment techniques in providing the instructor with a much clearer view of what his/her students know, think, and understand” (Freeman and Urbaczewski 2002, p. 51). Semantic sophistication was also scored based on a rubric, taking into account the comprehensiveness or correctness of content, and whether maps conformed to fact, logic or known truth (Besterfield-Sacre et al. 2004). Gregoriades and colleagues (2009) described how holistic scoring allowed them to assess overall understanding. The semantic sophistication was also measured in comparison to a reference map. Beyerbach (1988, p. 341) calculated “convergence towards a group consensus, and convergence toward an expert's map to indicate conceptual growth.” Freeman and Urbaczewski (2002, p. 42) compared students’ maps to an expert’s map to assess how much was learned and whether the learned concepts were integrated correctly.
3.2.5 Category representation
Category representation is concerned with categories of nodes and/or links in concept maps. Different types of categories were established, either valid and invalid nodes or propositions, where invalid nodes are outside of the scope of the prompt, and invalid propositions are incorrectly linked. Another category was old and new nodes in repeated measures, where old nodes were already present in the first map, and new nodes were added in the second map. Also content-related categories were distinguished, for instance concepts at different levels. One study distinguished different system levels, in order to reveal students’ systems thinking abilities—or, more specifically, students’ “ability to identify system components and processes at both micro and macro levels” (Tripto et al. 2018, p. 649). Category representation can only be calculated quantitatively after categories are determined in maps qualitatively. Category representation was calculated by the number of nodes per category and was also referred to as knowledge richness, frequencies of themes, presence of systems, representational level or category distribution (Çakmak 2010; Kostromina et al. 2017; Ritchhart et al. 2009; Tripto et al. 2018; Yaman and Ayas 2015). Ritchhart and colleagues (2009, p. 154) calculated the percent of responses in each category. Çakmak (2010) studied perceptions about roles based on the number of concepts assigned to each role.
3.2.6 Interlinkage
Interlinkage concerns the links between categories, and can only be calculated after categories are established. Interlinkage was also referred to as ‘complexity’ or ‘degree of interconnectedness.’ Interlinkage was interpreted as “students’ ability to identify relations between system components” (Tripto et al. 2018, p. 649). Specifically, the interlinkage between old and new nodes was used to study learning, or how new knowledge is connected to existing knowledge (Hay et al. 2008). Güccük and Köksal (2016) explored meaningful learning based on the number of interlinks and interpreted more interlinks as more meaningful learning. Ward and Haigh (2017, p. 1248) concluded that the analysis of interlinkage between old and new nodes allowed for holistic examination of the quality of learning.
3.2.7 Complexity index
The complexity index is calculated based on the number of concepts, number of categories, and number of links between categories. It was calculated in two studies to “characterize the overall coverage of and connectedness between the categories” (Watson et al. 2016b, p. 549). The complexity index is a particularization of interlinkage, calculated by dividing the number of interlinks by the number of categories, then multiplying this number with the number of nodes (Segalàs et al. 2012, p. 296).
A variety of concept map characteristics was considered, leading to different insights. Size was measured in 18 studies. Structural complexity was also taken into account in 18 studies. Structural complexity considered nodes and links and seems relatively easy and objective to determine; however, it is more interpretative than it seems, especially as concept maps grow more complex. Type of structure was measured in three studies, and revealed the overall structure of the concept map, disregarding the content and allocating one score for the overall structure of the map. Although it is a time-consuming step to describe and interpret terms used by respondents, this is the only way to gain insights into the semantic content of the maps. The semantic sophistication was taken into account in 13 studies. Terms used were sorted into themes or categories, which was done in eleven studies, either inductively or deductively, based on a theoretical framework or scoring rubric, or in comparison with a reference map. Evaluating the terms used and categorizing or unifying them was a necessary preliminary step for calculating other concept map characteristics, namely: category representation, interlinkage and complexity index. These characteristics were only considered when meaningful categories were present and interconnection of these categories was convenient, for instance, in the case of systems thinking. Interlinkage was determined in five studies and the complexity index in two studies.
Explanation of the rationale for concept map characteristics and measures varied from just mentioning which characteristics are measured and how, to studies that explain their operationalization based on theoretical descriptions of the research object that is explicitly deduced into specific concept map characteristics and measures. Some studies explicitly explained the choice for concept map characteristics based on the conclusions to be drawn. For instance Besterfield-Sacre et al. (2004, p.106) explain counting cross-links as follows: “We propose that measuring inter-relatedness is a way to assess the extent of knowledge integration.” How concept map characteristics were related to methods of analysis, is described in Table 3.
3.3 Conclusions drawn in the studies
The different conclusions drawn in the included studies about knowledge or learning are presented below. Conclusions about knowledge, for instance knowledge extent, were based on the number of nodes (Gregoriades et al. 2009). In repeated measures, an increase in number of nodes was interpreted as “more detail” (Beyerbach 1988, p. 345) or “greater domain knowledge” (Freeman and Urbaczewski 2002, p. 45). Counting the nodes was performed to “quantify knowledge understanding” (Besterfield-Sacre et al. 2004, p. 105). Conclusions about an “increase in richness” (Van den Boogaart et al. 2018, p. 297) or “balanced understanding” (Watson et al. 2016b, p. 556) were based on counting the number of nodes per category. Conclusions about better coverage and interconnectedness or systemic thinking were based on the complexity index (Segalàs et al. 2012). Conclusions about what respondents knew, or in repeated measures about how their knowledge changed over time were based on describing the content of concept maps (Freeman and Urbaczewski 2002, p. 42). It “revealed that teachers assign a significant role both to its own activity and activity of the University administration, as well as cooperation with students” (Kostromina et al. 2017, p. 320).
Conclusions about the complexity of knowledge, or the complexity of the knowledge structure, were based on the number of links. For instance, a conclusion about “more complex constructions of their knowledge” was based on the number of links, or structural complexity of concept maps (Read 2008, p. 127). In repeated measures, conclusions about “conceptual growth” were drawn based on structural complexity measures (Beyerbach 1988, p. 342). Conclusions about knowledge integration and learning gains (Borrego et al. 2009) were based on scoring the structural quality of concept maps based on a rubric and, in repeated measures, about additional conceptual understanding (Besterfield-Sacre et al. 2004; Watson et al. 2016b). Conclusions about the use of semantically correct concepts (Ifenthaler et al. 2011), or correct integration of concepts (Freeman and Urbaczewski 2002), were based on a comparison with a reference map. Other conclusions drawn based on comparison with a reference map were that students have significant misconceptions (Gregoriades et al. 2009), or that respondents gained a better understanding (Freeman and Urbaczewski 2002; Ifenthaler et al. 2011). Conclusions about meaningful learning were based on counting the number of links between old and new concepts (Hay 2007). Conclusions about development were also based on the type of structure of concept maps in repeated measures. Conclusions drawn based on the type of structure were in one study, that pre- and post-maps were both mainly non-hierarchical (Yaman and Ayas 2015), and in one study, that 16 of 18 respondents’ pre- and post-maps showed “remarkable structural homology, even where the content and its internal organisation were different” (Hay et al. 2008, p. 233).
Most studies applied more than one method of analysis and combined concept map characteristics when conclusions were drawn. Two of the three studies applying one method of analysis, qualitatively described the terms used in maps. The other study that applied one method of analysis, explored the semantic sophistication and structural complexity holistically. All other studies analyzed at least one concept map characteristic with two methods of analysis (for instance combining quantitative and similarity analysis of structural complexity), but most commonly multiple concept map characteristics and multiple methods of analysis were applied. However, a conclusion concerning counting different concept map characteristics was that it has shown opposing results within several studies: “While cross link scores were lower in some cases, hierarchy scores increased dramatically demonstrating that students were seeing each proposition in greater depth” (Blackwell and Williams 2007, p. 6). Or in the study of Freeman and Urbaczewski (2002), where structural complexity scores decreased while all other scores increased. In all studies, an increase in a measure or concept map characteristic was interpreted as conceptual development or growth, and in all but one repeated measures studies, development was found. This particular study described the main themes based on qualitative analysis of the terms used, without interpreting this as development. Two studies mentioned that the number of links or cross-links did not increase, and two studies found homogenous types of structures, but still concluded that understanding increased, mainly based on other measures.
Although most studies draw conclusions about conceptual understanding or in repeated measures about conceptual growth, conclusions drawn are related to the methods of analysis applied and concept map characteristics considered. Conclusions about an increase or growth, are mainly based on counting structural concept map characteristics, or applying quantitative analysis. Conclusions about meaningful learning and more balanced understanding, were also based on quantitative analysis. Conclusions about knowledge, learning or conceptual growth, or integration of knowledge were based on a comparison with a reference map. Conclusions concerning knowledge integration, learning and coverage were based on holistic analysis. Conclusions about the content of maps, and what respondent know or what themes they mention, were based on qualitative analysis of terms used.
4 Conclusion
The central research question was: Which methods of analysis are applied to open-ended concept maps when studying knowledge and learning, and how are these associated with concept map characteristics considered and conclusions drawn? The conclusions are presented based on the three main aspects of the research question, namely methods of analysis, concept map characteristics and conclusions drawn, as well as their mutual associations.
4.1 Methods of analysis
This review explored the methods of analysis applied in open-ended concept map studies and provided a first step towards exploring which methods of analysis are applied and how. Four categories of methods of analysis were identified, namely: (1) quantitative analysis based on counting concept map characteristics; (2) similarity analysis based on a comparison with a referent map; (3) holistic analysis that entails the scoring of maps as a whole based on a rubric; and (4) qualitative analysis that involves describing characteristics, for instance the terms used.
The 25 studies applied different methods of analysis. Due to the idiosyncratic nature of the data stemming from open-ended concept maps they can be analyzed in different ways (Novak 1990). Qualitative and quantitative analysis are most commonly applied to open concept maps, but to make concept maps more comparable, it is common to use both methods, in which case quantitative analysis is preceded by qualitative analysis. Quantitative analysis is performed to count differences between maps. Similarity analysis explores the overlap with a reference map based on the nodes or structural characteristics. Holistic analysis scores the structure and content of concept maps. Qualitative analysis is used to explore or describe concept map characteristics and to explore the uniqueness of each map.
Each method of analysis deals with the idiosyncratic data differently. Qualitative analysis of semantic sophistication is the only way to explore the idiosyncratic nature of open-ended concept maps and the terms for concepts as the respondents use them. Quantitative analysis reduces the unique terms respondents use to numbers. Similarity and holistic analyses value the terms used based on an existing framework and provide a score for overlap or correctness respectively. When an open-ended concept map is used to gather the unique terms respondents use and there is no correct map available, qualitative analysis is required to explore or describe this information or to make quantitative analysis more meaningful.
4.2 Concept map characteristics
Concept map characteristics are not always explicitly described, and many different descriptions are used for similar concept map characteristics. This study distinguished between seven concept map characteristics as described in the included articles. Concept map characteristics that were counted or evaluated quantitatively are size, structural complexity, category representation, interlinkage and complexity index. These are all related to structure, except for category representation, as this referred to the number of concepts per category. The type of structure, semantic sophistication, categories and interlinkage can be described or evaluated qualitatively. These are all related to the content of the map, except for type of structure. The structural complexity and semantic sophistication can also be evaluated in relation to a reference map based on a rubric. Similarity and holistic methods of analysis combine structural and content-related features of concept maps.
4.3 Conclusions drawn in the studies
Our review shows that although the methods of analysis vary, the conclusions drawn are quite similar. Despite whether concept map characteristics were counted, compared, scored or described, conclusions were drawn about understanding or conceptual growth in repeated measures. All studies with repeated measures applying quantitative analysis found an increase of a measure that was interpreted as conceptual growth. Similarity analysis in repeated measures revealed an increased overlap in specific measures, which was considered as development of understanding. Holistic analysis revealed that better understanding or knowledge integration was found in repeated measures. Three studies used qualitative analysis to identify conceptual growth, for instance, the concept of leadership, where students considered leadership more as a process in the post-test. Twenty of the 21 studies with repeated measures found some type of development or learning gains, most commonly referred to as conceptual growth.
4.4 Associations across articles
Associations were explored between the coding of the methods of analysis, the concept map characteristics, and the conclusions drawn, in order to provide guidelines for methodological coherence between these aspects. Figure 4 provides an overview of the types of conclusions that can be drawn from open-ended concept maps, in accordance with the identified methods of analysis and concept map characteristics.

Associations between methods of analysis, concept map characteristics and types of conclusions
Figure 4 can serve as a guide for future open-ended concept map studies which use the specific types of conclusions to be drawn as a means of deciding what method of analysis to apply and what concept map characteristics to consider. For instance, in cases of quantitative analysis, Fig. 4 suggests that no conclusions can be drawn about correctness or quality, only about the extent of domain knowledge, and an increase or decrease in repeated measures. In similarity analysis, correct and incorrect nodes and links are determined, based on a correct model. Therefore, conclusions can be drawn concerning correctness. When applying a rubric for holistic scoring, one overall score is often given for the entire map, in which the overall quality is scored (Besterfield-Sacre et al. 2004). Quality of content includes correctness, but only for the map as a whole. The concept map characteristics of size, category representation and semantic sophistication consider the nodes and lead to conclusions about knowledge. The concept map characteristics of structural complexity, interlinkage, complexity index and type of structure consider both the nodes and the links and lead to conclusions about knowledge structure or integration. By explicitly using the conclusion to be elicited as a basis for choosing methods of analysis and concept map characteristics, the transparency of research increases, which enables better quality assessment (Coombs 2017; Verhage and Boels 2017).
5 Discussion
When relating these conclusions to broader theory, the first point of discussion is that 20 out of 21 repeated measures studies identified learning or conceptual growth. This raises the question whether all development is interpreted as development, and whether an increase in nodes and links represents better understanding or not. Rikers, Schmidt and Boshuizen (2000), who studied encapsulated knowledge and expertise in diagnosing clinical cases, found that the proportion of encapsulating concepts increases as an indicator of expertise development. This entails a decrease in the number of nodes and links as expertise develops, as experts are able to differentiate between concepts and relationships that are more and less relevant according to a specific contexts. Accordingly, Mintzes and Quinn (2007) explore different phases in expertise development based on meaningful learning theory. Their distinction between phases of development is based on the number of expert concepts, which in turn are relevant superordinate concepts that are absent from novices’ concept maps. Accordingly, Schwendimann (2019), who studied the process of development of concept maps, also found differences between novices and experts mainly in the professional terminology experts use for their concepts and linking words. Therefore, the conclusion that an increase is always better is contradicted by many studies of expertise development in the field of cognitive science (Chi, Glaser and Farr 1988).
Our review did not aim to discuss the value of open-ended concept maps as an instrument to study knowledge or knowledge development. Nor did it aim to explore the validity of different methods of analysis, or determine which method of analysis is most valid, as these methods of analysis can be related to different research purposes or research objects (Kim and Clariana 2015). Quantitative analysis is based on an evaluative approach which assesses knowledge or growth based on specific measures or characteristics, such as size or complexity. Similarity and holistic methods analyze concept maps from expected structures or content and have an evaluative or prescriptive purpose. Similarity analysis and holistic analysis take a more normative approach to the analysis of open-ended concept maps, by comparing them to a reference map or scoring the map based on a rubric, respectively. On the other hand, qualitative analysis has a more explorative purpose. Merriam and Grenier (2019) explain similar purposes of qualitative research methods and point out that more open or qualitative analysis is suited to more explorative purposes, while more restricted approaches are more appropriate for evaluative purposes.
This review has several limitations. Only studies applying open-ended concept maps to study knowledge and learning were included. The results of this study could be different when reviewing studies that apply more closed concept maps, or studies that combine the application of concept maps with other research instruments. Also, the research objects are not included in Fig. 4, as references to research objects were ambiguous in previous studies and it was unclear whether studies referred to the same objects differently, or studied different objects. As a result, this review focused on the process of analysis, disregarding what aspects of knowledge or learning were studied. Moreover, Fig. 4 provides no guidelines for alignment with other aspects of coherence in qualitative studies, for instance the philosophical positioning, the fundamental beliefs or theoretical perspective taken (Caelli et al. 2003; Davis 2012).
The findings in this review could be substantiated by further research exploring implicit choices or implicit methodological coherence that could not be extracted from the articles. This could take the form of interviews with the authors of the studies about their methodological assumptions, approaches and chosen methods of analysis. They could then be asked why and how they made choices related to their research object, the concept map characteristics they considered and the conclusions they drew.
While previous reviews by Ruiz-Primo and Shavelson (1996), Anohina and Grundspenkis (2009) and Strautmane (2012) explored aspects of the process of analysis separately, or related the method of analysis applied to the level of openness of the concept map task, this review examined three aspects of the analysis process in coherence. By doing so, the present study aims to inform the ongoing discussion in social sciences and beyond about the quality of analysis. Unfortunately, open-ended concept map studies often still feature ambiguous language use. This ambiguity decreases transparency about the method of analysis, the concept map characteristics, and, ultimately, the conclusions drawn and the methodological coherence of these aspects (Chenail et al. 2011; Seale 1999). Clarifying which approach is chosen to make sense of the information in open-ended concept maps provides a method of dealing with idiosyncratic information provided by the respondents and will support other researchers or policy makers to better interpret and value the conclusions drawn. By describing studies on the basis of the proposed distinction between methods of analysis applied and how they interpret or value information from concept maps, the constraints of each method can be discussed, and findings or conclusions can be understood with a degree of confidence (Chenail et al. 2011). This distinction between methods of analysis can enhance transparency about the conclusions to which a specific method of analysis can and cannot lead. Clarity about the choices within and across studies is stimulated by uniform referencing to these choices, which decreases the confusion caused by the variety of ways in which scholars refer to similar constructs. In future research, the guidelines provided in this study will assist scholars to make more informed choices for their analysis of idiosyncratic data gathered with open-ended concept maps.
Data availability
The data that support the findings of this study are the papers as mentioned in the results and summarized in Appendix A. They are also indicated with an * in the references section of this review. The materials used to code this data are provided in the article. The condensed data that support the findings of this study are available on request from the corresponding author Kirsten de Ries. The data are not publicly available due to the fact that not all these paper are Open Access.
Code availability
No computer codes or mathematical algorithm is used in this paper. The coding of our data was performed by the authors based on the coding scheme presented in the data section.
References
References indicated with * were included in the literature review
*Anohina, A., Grundspenkis, J.: Scoring concept maps: an overview. Comp. Sys. Tech. (2009). https://doi.org/10.1145/1731740.1731824
Ayres, L., Kavanaugh, K., Knafl, K.A.: Within-case and across-case approaches to qualitative data analysis. Qual. Health Res. 13, 871–883 (2003)
*Besterfield-Sacre, M., Gerchak, J., Lyons, M.R., Shuman, L.J., Wolfe, H.: Scoring concept maps: an integrated rubric for assessing engineering education. J. Eng. Educ. 93, 105–115 (2004)
*Beyerbach, B.A.: Developing a technical vocabulary on teacher planning: preservice teachers’ concept maps. Teach. Teach. Educ. 4, 339–347 (1988)
*Blackwell, C., Williams, J.: The utilization of concept maps in evaluating leadership comprehension. Proc. 2007 AAAE Res. Conf. 34, 698–707 (2007)
*Borrego, M., Newsmander, C., McNair, L.D., McGinnis, S.P.: Using concept maps to assess interdisciplinary integration of green engineering knowledge. Adv. Eng. Educ. 1, 1–25 (2009)
Bressington, D.T., Wells, H., Graham, M.: A concept mapping exploration of social workers’ and mental health nurses’ understanding of the role of the approved mental health professional. Nurse Educ. Today (2011). https://doi.org/10.1016/j.nedt.2010.10.034
Buhmann, S.Y., Kingsbury, M.: A standardized holistic framework for concept map analysis combining topological attributes and global morphologies. Knowl. Man. E-Learn. 7, 20–35 (2015)
Caelli, K., Ray, L., Mill, J.: ‘Clear as Mud’: toward greater clarity in generic qualitative research. Int. J. Qual. Meth. 2(2), 1–16 (2003)
*Çakmak, M.: An examination of concept maps created by prospective teachers on teacher roles. Procd. Soc. Behv. (2010). https://doi.org/10.1016/j.sbspro.2010.03.354
Cañas, A.J., Novak, J.D., Reiska, P.: Cmapanalysis: an extensible concept map analysis tool. JETT 4, 25–36 (2013)
Cetin, B., Güler, N., Sarica, R.: Using generalizability theory to examine different concept map scoring methods. EJER (2016). https://doi.org/10.14689/ejer.2016.66.12
Chenail, R.J., Duffy, M., St George, S., Wulff, D.: Facilitating coherence across qualitative research. TQR 16, 263–275 (2011)
Chi, M., Glaser, R., Farr, M.: The nature of expertise. Erlbaum, Hillsdale, New Jersey (1988)
Coombs, C.: Coherence and transparency: some advice for qualitative researchers. Production (2017). https://doi.org/10.1590/0103-6513.006817
Creswell, J.W.: Educational research: planning, conducting and evaluating quantitative and qualitative research. Preston, Boston (2012)
Davis, J.A.: Methodological coherence: establishing a unified research frame/La cohérence méthodologique: établir un cadre de recherche unifié. Can. J. Occup. Ther. (2012). https://doi.org/10.2182/cjot.2012.79.3.1
Dori, D.: ViSWeb - the visual semantic web: unifying human and machine knowledge representations with object-process methodology. VLDB J. (2004). https://doi.org/10.1007/s00778-004-0120-x
*Freeman, L.A., Urbaczewski, A.: Concept maps as an alternative technique for assessing students' understanding of telecommunications. Proc. of ICIER (2002)
Gough, D., Oliver, S., Thomas, J.: Introduction to systematic reviews. Sage, London (2012)
Greene, B.A., Lubin, I.A., Slater, J.L., Warden, S.E.: Mapping changes in science teachers’ content knowledge: concept maps and authentic professional development. J. Sci. Educ. Technol. (2013). https://doi.org/10.1007/s10956-012-9393-9
*Gregoriades, A., Pampaka, M., Michail, H.: Assessing students’ learning in misusing concept mapping. J. Inf. Sys. Educ. 20(4), 419–430 (2009)
*Güccük, A., Köksal, M.S.: The effect of case teaching on meaningful and retentive learning when studying genetic engineering. J. Biol. Educ. (2016). https://doi.org/10.1080/00219266.2016.1182049
*Hay, D.B.: Using concept maps to measure deep, surface and non-learning outcomes. Stud. High. Educ. (2007). https://doi.org/10.1080/03075070601099432
*Hay, D.B., Wells, H., Kinchin, I.M.: Quantitative and qualitative measures of student learning at university level. High. Educ. (2008). https://doi.org/10.1007/s10734-007-9099-8
Huberman, A.M., Miles, B.M.: The qualitative researcher’s companion. Sage, Thousand Oaks (2002)
*Ifenthaler, D., Masduki, I., Seel, N.M.: The mystery of cognitive structure and how we can detect it: tracking the development of cognitive structures over time. Instr. Sci. 39, 41–61 (2011)
Jirásek, I., Plevová, I., Jirásková, M., Dvorácková, A.: Experiential and outdoor education: the participant experience shared through mind maps. Stud. Contin. Educ. 38(3), 334–354 (2016)
Kim, K., Clariana, R.: Knowledge structure measures of reader’s situation models across languages: translation engenders richer structure. Tech. Know. Learn. (2015). https://doi.org/10.1007/s10758-015-9246-8
Kinchin, I.M.: Visualising powerful knowledge to develop the expert student a knowledge structures perspective on teaching and learning at university. Sense Publishers, Rotterdam (2016)
Kinchin, I.M., Hay, D.B., Adams, A.: How a qualitative approach to concept map analysis can be used to aid learning by illustrating patterns of conceptual development. Educ. Res. (2000). https://doi.org/10.1080/001318800363908
*Kostromina, S., Gnedykh, D., Ruschack, E.A.: Russian university teachers’ ideas about pedagogic frailty. Knowl. Man. E-Learn. Int. J. 9(3), 311–328 (2017)
Marriott, R.C.V., Torres, P. L.: Formative and summative assessment of concept maps. In: Cañas, A., Reiska, P., Novak, J. (eds.) Innovating with concept mapping, 7th Int. CMC (2016) doi: https://doi.org/10.1007/978-3-319-45501-3
Merriam, S.B., Grenier, R.S.: Qualitative research in practice: examples for discussion and analysis. Jossey-Bass, San Francisco (2019)
Miles, M.B., Huberman, M.A.: Qualitative data analysis: an expanded sourcebook. Sage, Thousand Oaks (1994)
Mintzes, J., Quinn, H.J.: Knowledge restructuring in biology: testing a punctuated model of conceptual change. Int. J. Sci. Math. Educ. 5, 281–306 (2007)
Nair, S.M., Narayanasamy, M.: The effects of utilising the concept maps in teaching history. Int. J. Instr. (2017). https://doi.org/10.12973/iji.2017.1038a
Novak, J.D.: Concept mapping: a useful tool for science education. J. Res. Sci. Teach. (1990). https://doi.org/10.1002/tea.3660271003
Novak, J.D., Cañas, A.J.: The theory underlying concept maps and how to construct them. Technical Report IHMC CmapTools. Rev 01–2008, FIHMC (2008), available at: http://cmap.ihmc.us/Publications/ ResearchPapers/TheoryUnderlyingConceptMaps.pdf
Novak, J.D., Gowin, D.B.: Learning how to learn. Cambridge University Press, Cambridge (1984)
*Pearsall, N.R., Skipper, J., Mintzes, J.: Knowledge restructuring in the life sciences: a longitudinal study of conceptual change in biology. Sci. Educ. 81(2), 193–215 (1997)
Poucher, Z.A., Tamminen, K.A., Caron, J.G., Sweet, S.N.: Thinking through and designing qualitative research studies: a focused mapping review of 30 years of qualitative research in sport psychology. Int. Rev. Sport Exerc. Psychol. (2020). https://doi.org/10.1080/1750984X.2019.1656276
*Read, S.: Concept mapping: evaluating the language arts methods course. J. Scholarsh. Teach. Learn. 8(3), 119–129 (2008)
Rikers, R., Schmidt, H., Boshuizen, H.: Knowledge encapsulation and the intermediate effect. Contemp. Educ. Psychol. (2000). https://doi.org/10.1006/ceps.1998.1000
*Ritchhart, R., Turner, T., Hadar, L.: Uncovering students’ thinking about thinking using concept maps. Metacognition Learn. (2009). https://doi.org/10.1007/s11409-009-9040-x
Ruíz-Primo, M.: On the use of concept maps as an assessment tool in science: What we have learned so far. Revista Electrónica de Investigación Educativa, 2(1), (2000). Retrieved from: http://redie.uabc.mx/vol2no1/contents-ruizpri.html
*Ruiz-Primo, M.A., Shavelson, R.J.: Problems and issues in the use of concept maps in science assessment. J. Res. Sci. Teach. 33(6), 569–600 (1996)
Ruiz-Primo, M.A., Schultz, S.E., Li, M., Shavelson, R.J.: Comparison of the reliability and validity of scores from two concept-mapping techniques. J. Res. Sci. Teach. 38(2), 260–278 (2001)
Schwendimann, A.B.: Comparing expert and novice concept map construction. In: Cañas, A.J., Reiska, P., Novak, J.D. (eds.) Innovating with concept mapping: 7th international conference on concept mapping, pp. 16–28. Springer International Publishing AG, Basel Switzerland (2019)
Seale, C.: Quality in qualitative research. Qual. Inq. (1999). https://doi.org/10.1177/107780049900500402
*Segalàs, J., Mulder, K.F., Ferrer-Balas, D.: What do EESD “experts” think sustainability is? which pedagogy is suitable to learn it? Results from interviews and cmaps analysis gathered at EESD 2008. Int. J. Sustain. High. Educ. (2012). https://doi.org/10.1108/14676371211242599
Stevenson, A., Hartmeyer, B., Bentsen, P.: systematically reviewing the potential of concept mapping technologies to promote self-regulated learning in primary and secondary science education. Educ. Res. Rev. 21, 1–16 (2017)
*Strautmane, M.: Concept map-based knowledge assessment tasks and their scoring criteria: an overview. In: Cañas, A.J., Novak, J.D., Vanhear, J. (eds.), Concept maps: Theory, methodology, technology. Proc. Fifth Int. Conf. Concept Mapping (vol. 2) pp. 80–88. University of Malta, Valletta, Malta (2012)
Tan, S., Erdimez, O., Zimmerman, R.: Concept mapping as a tool to develop and measure students understanding in science. Acta Didact. Napoc. (2017). https://doi.org/10.24193/adn.10.2.9
*Tripto, J., Ben-Zvi Assaraf, O., Amit, M.: Recurring patterns in the development of high school biology students’ system thinking over time. Instr. Sci. (2018). https://doi.org/10.1007/s11251-018-9447-3
*Van den Boogaart, A.C.M., Hummel, H.G.K., Kirschner, P.A.: Explicating development of personal professionals theories from higher vocational education to beginning a professional career through computer-supported drawing of concept maps. Prof. Dev. Educ. (2018). https://doi.org/10.1080/19415257.2017.1288652
Verhage, A., Boels, D.: Critical appraisal of mixed methods research studies in a systematic scoping review in plural policing: assessing the impact of excluding inadequately reported studies by means of a sensitivity analysis. Qual. Quan. (2017). https://doi.org/10.1007/s11135-016-0345-y
*Ward, G., Haigh, M.: Challenges and changes: developing teachers’ and initial teacher education students’ understandings of the nature of science. Res. Sci. Educ. 47(6), 1233–1254 (2017)
*Watson, M.K., Pelkey, J., Noyes, C.R., Rodgers, M.O.: Assessing conceptual knowledge using three concept map scoring methods. J. Eng. Educ. 105(1), 118–146 (2016a)
Watson, M.K., Pelkey, J., Noyes, C.R., Rodgers, M.O.: Assessing impact of a learning-cycle-based module on students’ conceptual sustainability knowledge using concept maps and surveys. J. Clean. Prod. (2016b). https://doi.org/10.1016/j.clepro.2016.04.063
*Weiss, M.P., Pellegrino, A., Brigham, F.J.: Practicing collaboration in teacher preparation: effects of learning by doing together. Teach. Educ. Spec. Educ. 40(1), 65–67 (2017)
*West, D.C., Pomeroy, J.R., Park, J.K., Gerstenberger, E.A., Sandoval, J.: Critical thinking in graduate medical education: a role for concept mapping assessment? Am. Med. Ass. 284(9), 1105–1110 (2000)
*West, D.C., Pomeroy, J.R., Park, J.K., Gerstenberger, E.A., Sandoval, J.: Critical thinking in graduate medical education: a role for concept mapping assessment? Med. Educ. 36(9), 820–826 (2002)
Wheeldon, J., Fauber, J.: Framing experience: concept maps, mind maps, and data collection in qualitative research. Int. J. Qual. Meth. 8(3), 68–83 (2009)
*Wormnaes, S., Mkumbo, K., Skaar, B., Refseth, Y.: Using concept maps to elicit and study student teachers’ perceptions about inclusive education: a Tanzanian experience. J. Educ. Teach. (2015). https://doi.org/10.1080/02607476.2015.1081724
*Yaman, F., Ayas, A.: Assessing changes in high school students’ conceptual understanding through concept maps before and after the computer-based predict-observe-explain (CB-POE) task on acid-base chemistry at the secondary level. Chem. Educ. Res. Pract (2015). https://doi.org/10.1039/c5rp00088b
Yin, Y., Vanides, J., Ruiz-Primo, M.A., Ayala, C.C., Shavelson, R.J.: Comparison of two concept-mapping techniques: implications for scoring, interpretation, and use. J. Res. Sci. Teach. 42(2), 166–184 (2005)
Funding
Open Access funding provided by the Dutch Organization for Scientific Research, RAAK-Pro.
Author information
Authors and Affiliations
Corresponding author
Ethics declarations
Conflicts of interests
The author has no affiliations with or involvement in any organization or entity with any financial interest or non-financial interest in the subject matter or materials discussed in this manuscript.
Consent for publication
Consent for publication was necessary to carry out the study as there is no primary data used in the paper.
Consent to participate
Consent to participate was necessary to carry out the study as there is no primary data used in the paper.
Ethics approval
No ethical approval was necessary to carry out the study as there is no primary data used in the paper.
Additional information
Publisher's Note
Springer Nature remains neutral with regard to jurisdictional claims in published maps and institutional affiliations.
Appendix A
Appendix A
See Table
Rights and permissions
Open Access This article is licensed under a Creative Commons Attribution 4.0 International License, which permits use, sharing, adaptation, distribution and reproduction in any medium or format, as long as you give appropriate credit to the original author(s) and the source, provide a link to the Creative Commons licence, and indicate if changes were made. The images or other third party material in this article are included in the article's Creative Commons licence, unless indicated otherwise in a credit line to the material. If material is not included in the article's Creative Commons licence and your intended use is not permitted by statutory regulation or exceeds the permitted use, you will need to obtain permission directly from the copyright holder. To view a copy of this licence, visit http://creativecommons.org/licenses/by/4.0/.
About this article

Cite this article
de Ries, K.E., Schaap, H., van Loon, AM.M.J.A.P. et al. A literature review of open-ended concept maps as a research instrument to study knowledge and learning. Qual Quant 56, 73–107 (2022). https://doi.org/10.1007/s11135-021-01113-x
Accepted:
Published:
Issue Date:
DOI: https://doi.org/10.1007/s11135-021-01113-x