
Abstract
Context
Recovery from disturbances is a prominent measure of forest ecosystem resilience, with swift recovery indicating resilient systems. The forest ecosystems of Central Europe have recently been affected by unprecedented levels of natural disturbance, yet our understanding of their ability to recover from disturbances is still limited.
Objectives
We here integrated satellite and airborne Lidar data to (i) quantify multi-decadal post-disturbance recovery of two indicators of forest structure, and (ii) compare the recovery trajectories of forest structure among managed and un-managed forests.
Methods
We developed satellite-based models predicting Lidar-derived estimates of tree cover and stand height at 30 m grain across a 3100 km2 landscape in the Bohemian Forest Ecosystem (Central Europe). We summarized the percentage of disturbed area that recovered to > 40% tree cover and > 5 m stand height and quantified the variability in both indicators over a 30-year period. The analyses were stratified by three management regimes (managed, protected, strictly protected) and two forest types (beech-dominated, spruce-dominated).
Results
We found that on average 84% of the disturbed area met our recovery threshold 30 years post-disturbance. The rate of recovery was slower in un-managed compared to managed forests. Variability in tree cover was more persistent over time in un-managed forests, while managed forests strongly converged after a few decades post-disturbance.
Conclusion
We conclude that current management facilitates the recovery of forest structure in Central European forest ecosystems. However, our results underline that forests recovered well from disturbances also in the absence of human intervention. Our analysis highlights the high resilience of Central European forest ecosystems to recent disturbances.
Introduction
Natural disturbances are important drivers of forest ecosystem dynamics. They shape forest ecosystem structure and functioning by creating biological legacies such as logs and snags (Lindenmayer et al. 2004), and by increasing the heterogeneity of forests from stand to landscape scales (Turner 2010). Yet, there is growing evidence of changing disturbance regimes under climate change (Seidl et al. 2017), requiring forest managers to increasingly focus on the resilience of ecosystems to disturbance (Seidl et al. 2016c). A prerequisite for developing management actions that foster resilience is the ability to measure and quantify indicators of resilience (Scheffer et al. 2015).
Post-disturbance recovery is an important indicator of ecosystem resilience, with fast recovery generally suggesting a high level of resilience (Scheffer et al. 2015; Seidl et al. 2016c). Forest recovery can be measured using different indicators (Frolking et al. 2009; Trumbore et al. 2015), including recovery in forest structural elements (Bolton et al. 2015; Bartels et al. 2016), floristic indicators (McLachlan and Bazely 2001; Nagel et al. 2006), and biomass (Williams et al. 2012; Dobor et al. 2018). As disturbances affect ecosystem service supply predominately negatively (Thom and Seidl 2016), the time it takes to recover important forest properties also is a key determinant of the societal impact of disturbances. However, recovery is a retrospective indicator of resilience that can only be assessed after a perturbation has taken place. A prospective view of resilience can be gleaned, for instance, from spatial heterogeneity. Heterogeneity can dampen the cross-scale interactions and amplifying feedbacks that are necessary for catastrophic events and regime shifts (Peters et al. 2004). Specifically, variability in recovery can have long-lasting effects on the development of forest ecosystems (Meigs et al. 2017), and can decrease the vulnerability of forests to future disturbances by preventing synchronous exceedance of susceptibility thresholds for, e.g., bark beetle outbreaks (Seidl et al. 2016a). Hence, not only the temporal signal of recovery (i.e., recovery rate) but also its spatial pattern (i.e., variability in recovery) needs to be considered for a comprehensive quantification of forest ecosystem resilience to disturbance (Scheffer et al. 2015; Braziunas et al. 2018).
The forests of Central Europe have been strongly affected by natural disturbances from wind and bark beetles recently (Seidl et al. 2014b; Senf et al. 2018), with unprecedented disturbance levels in at least the last century (Schurman et al. 2018). Consequently, the ability of these forests to recover has come into focus. Recent research has addressed the initial establishment of tree-seedlings in the first years after a disturbance, demonstrating that forests affected by bark beetles and wind regenerate well through self-replacement (Svoboda et al. 2010; Zeppenfeld et al. 2015; Macek et al. 2017). These local studies delivered important insights into the potential of Central European forests to recovery from a disturbance. Yet, a landscape-scale perspective on long-term post-disturbance recovery trajectories is still missing to date. We lack, for instance, important information on the overall proportion of forests that have recovered from a disturbance in a given landscape, as well as on the spatial variability of disturbance recovery. Addressing such questions requires a complementary broad-scale approach to estimating recovery, such as the analysis of remote sensing data.
Remote sensing has emerged as an important tool for quantitative assessments in the field of disturbance ecology. While mapping forest disturbances from remote sensing data is now feasible (Banskota et al. 2014), the analysis of post-disturbance recovery has received less attention to date. Recent studies have used data from active sensors such as light detecting and ranging (Lidar) to quantify post-disturbance structural characteristics and recovery trajectories (Bolton et al. 2015; Vogeler et al. 2016; Latifi et al. 2016; Bolton et al. 2017; Hill et al. 2017). However, as those approaches are limited in their spatial and temporal extent, it might be beneficial to also utilize data from passive, satellite-borne sensors—such as Landsat—for mapping post-disturbance recovery across extended spatio-temporal scales (Kennedy et al. 2007; Schroeder et al. 2007). Trends in spectral recovery derived from Landsat time series can give valuable insights into the regrowth of vegetation after large-scale disturbances such as clear-cutting and fire in the boreal forests (Frazier et al. 2015; White et al. 2017; Frazier et al. 2018). It remains unclear, however, whether Landsat is also suited for characterizing post-disturbance recovery in more fine-grained landscapes such as the forests of Central Europe.
Forests in Central Europe are by large parts managed ecosystem, with approximately 70% of the total forest area being under active management and only 4% of Europe’s forests being without impact by humans (Forest Europe 2015). Management in Central Europe includes clear-cut harvest, salvage harvesting in response to natural disturbances (Stadelmann et al. 2013), gap and shelter-wood cutting to induce advanced regeneration, and planting after clear-cut or natural disturbance. The latter is intended to foster post-disturbance recovery, with managers often questioning the ability of forests to recover naturally after disturbance. However, as planting is executed largely uniformly in space, it could at the same time decrease the structural diversity in early- to mid-successional stages of forest development relative to natural forest regeneration (Donato et al. 2012). Furthermore, salvage harvesting in response to natural disturbances frequently removes important pre-disturbance legacies, reducing structural diversity (Bace et al. 2015) and habitat quality of the resulting managed early-seral forests (Swanson et al. 2011; Thorn et al. 2017). It therefore remains an open question whether management improves the recovery from natural disturbances, or if forests of Central Europe are resilient to the current disturbance regimes even without human intervention.
Here, our aim was to quantify and compare long-term post-disturbance forest recovery in managed and un-managed forests in Central Europe. We used satellite data to predict Lidar-based estimates of tree cover and stand height across a 3100 km2 landscape at the border of Austria, Czechia, and Germany (including two major National Parks). We then assessed the performance of varying spectral indices and remote sensing metrics, as well as the effect of training sample size on model performance. Furthermore, we combined the predicted tree cover and stand height maps with satellite-based maps of past forest disturbance (from 1985 onwards), allowing us to summarize and compare recovery and variability in both tree cover and stand height between managed and un-managed forests, as well as between different elevation bands. Elevation hereby served as proxy for different dominant tree species in the region (Röder et al. 2010; Bässler et al. 2016). In sum, our objectives were: (i) quantify multi-decadal post-disturbance recovery focusing on two indicators of stand structure, and (ii) compare recovery trajectories of stand structure between managed and un-managed forests.
Materials and methods
Study landscape
Our study landscape is situated in the Bohemian Forest ecosystem (48° 570 N 13° 260 E; Fig. 1), which is a typical Mittelgebirge mountain range situated along the border of Austria, Czechia and Germany. Elevation ranges from 300 m a.s.l. in valleys to 1,450 m a.s.l. along the main mountain ridge. The climate is characterized by a moderate to cool montane climate (3 to 4 °C mean annual temperature) with relatively high precipitation levels (annual total of 1300 to 1800 mm) that decreases from west to east. The centre of the area is formed by two conjoined protected areas, the Bavarian Forest National Park in Germany (240 km2; established 1970) and the Šumava National Park in Czechia (690 km2; established 1991). The most important tree species are Norway spruce (Picea abies (L.) Karst.), European beech (Fagus sylvatica L.), and silver fir (Abies alba Mill.).

Study landscape with the three management regimes and availability of Lidar data (a), disturbance patches and forest area mapped from Landsat data (b), and location of the study landscape in Central Europe (c)
The study landscape can broadly be divided into three management regimes (Fig. 1): (1) Strictly protected, (2) protected, and (3) managed forests. The first regime, strictly protected, characterizes areas that were not managed at all during the analysis period 1985–2016 (i.e., core zones of national parksFootnote 1). In those areas, no human intervention is allowed, and disturbance and recovery reflect natural ecosystem dynamics, developing without human interference (Senf and Seidl 2018). The major disturbance agents in the strictly protected areas are bark beetles and wind storms. The second management regime, protected, contains all areas which are within the boundaries of national parks, but which were subject to some human intervention during the study period. Interventions in the protected management regime included salvaging or other treatments of natural disturbances to contain the spread of bark beetles to areas outside the national park. The second management regime thus comprises only management interventions in response to natural disturbances, but does not include regular, planned harvesting interventions. The third management regime, managed, comprises forests of varying ownership (private and public) and management objectives. The disturbance regime in this last area can be characterized as human-dominated, with typical management interventions including clearcut harvesting with and without planting, as well as gap and shelterwood cutting to support natural regeneration. Hence, the management areas include mostly human-caused forest disturbances. However, also the area under this third management regime was subject to natural disturbances by wind and bark beetles during the study period. However, usual management responses to natural disturbances include sanitation and salvage logging as well as replanting to facilitate swift recovery.
Mapping post-disturbance forest structure
Landsat-based disturbance and recovery metrics
All Landsat data from the United States Geological Survey (USGS) and European Space Agency (ESA) archives were downloaded and processed to annual best observation composites following the methods described in Senf et al. (2017). In essence, processing involved the calculation of surface reflectance values, the creation of cloud and cloud-shadow masks, and the creation of median spectral reflectance composites including only clear growing-season observations (between June 1st and August 31st) during the study period (1985–2016). Additionally, we acquired maps of stand-replacing forest disturbances and disturbance onset (i.e., the first year of disturbance; Point A in Fig. 2) from Senf et al. (2017). The disturbance maps had an overall accuracy of 87% with error of commission/omission for the disturbances class being 5% and 3%, respectively. The year of disturbance was estimated correctly for 80% of the disturbances given a ± 1-year tolerance.

Example Landsat spectral trajectory. Note that the disturbance and recovery metrics are here exemplified using the NBR trajectory. Each grey dot is an annual Landsat observation of one example pixel. Point A indicates the start of disturbance. Point B indicates the end of disturbances and hence the start of recovery. Point C indicates the spectral recovery after 5 years (short-term spectral recovery), whereas point D indicates the 80% spectral recovery (long-term spectral recovery). Segment 1 indicates the pre-disturbance observations. Segment 2 indicates the disturbance segment, from which the disturbance magnitude and duration are derived. Segment 3 indicates the recovery model
We transferred the multi-spectral median composites from Landsat into three spectral indices commonly used for disturbance and recovery mapping: the normalized burn ratio (NBR; Key 2006), the Tasseled Cap wetness component (TCW; Crist 1985), and the disturbance index (DI; Healey et al. 2005). The NBR has been employed in a variety of studies mapping disturbances (Meigs et al. 2011; Kennedy et al. 2012; Hermosilla et al. 2015) and recovery (Pickell et al. 2015; White et al. 2017) and is linked to structural changes in disturbed and recovering vegetation. Similarly, the TCW has been employed for assessing disturbance and recovery (Hais et al. 2009; Senf et al. 2015), also being sensitive to structural changes in the tree canopy. The DI integrates all Tasseled Cap components (brightness, greenness and wetness), thus delivering a more holistic view on forest changes (see, for example, Hais et al. 2009). In order to remove residual clouds and outliers from the spectral index time series—which might obscure further analysis—we followed Kennedy et al. (2010) in detecting and removing spikes based on a normalized difference measure between neighboring observations.
For characterizing disturbances and recovery—and subsequently predicting forest structure after disturbance—we developed a set of metrics describing the spectral and temporal characteristics of disturbance and recovery. We first determined the end of disturbance for each disturbed pixel by identifying the minimum spectral value after the onset of a disturbance (Point B in Fig. 2). This step was necessary as particular disturbances by biotic agents often extend over several years, and the start of recovery is thus not accurately characterized by the disturbance onset (see, for example, Fig. 2). Once the end of a disturbance was identified, we calculated the spectral magnitude of disturbance (absolute disturbance magnitude), defined as the spectral difference between the mean of all observations before the disturbance onset (pre-disturbance spectral value; segment 1 in Fig. 2) and the spectral value at the end of a disturbance segment (segment 2 in Fig. 2). We also calculated the relative disturbance magnitude by dividing the absolute disturbance magnitude by the pre-disturbance spectral value. We assessed the length of disturbance as the difference in years between disturbance onset and end (point A and B in Fig. 2, respectively). For further characterizing the pre-disturbance spectral characteristics, we also calculated the slope of all observations before disturbance (pre-disturbance slope; Hais et al. 2016).
For characterising recovery, we fit a linear-log model to the spectral recovery trajectory (segment 3 in Fig. 2), providing a good approximation of short-term spectral recovery (i.e., initial rapid changes in spectral signal) and longer-term spectral trends (saturation of the spectral signal after approx. 10–15 years; see Fig. 2). We also tested linear, exponential, power and logit models, but found that the linear-log model provided the best balance between model fit and stable model performance. No model was fit if less than five observations were available. From the linear-log model we derived two metrics summarizing the spectral recovery trend: The absolute and relative short-term spectral recovery and the time until spectral recovery (Kennedy et al. 2010; White et al. 2017). The first metric is derived by the absolute spectral change 5 years after the end of disturbance (absolute short-term recovery; point C in Fig. 2), which is divided by the disturbance magnitude for deriving the relative short-term recovery. The second metric (long-term spectral recovery) is derived by counting the number of years until the model reaches 80% of the pre-disturbance spectral value (point D in Fig. 2). We also tested a variety of other thresholds for the short- and long-term recovery metrics (i.e., recovery after 3, 10 or 15 years; pre-spectral threshold of 60%, 90% or 100%), but found generally high correlation between metrics (Pearson r > 0.90) and thus decided to follow the metrics recommended in White et al. (2017). Finally, we estimated the time since disturbance as the length of the recovery trajectory in years.
Lidar-based estimates of tree cover and stand height
We used a Lidar-based 1 m spatial resolution canopy height model (CHM) from 2012 to derive post-disturbance structural variables at Landsat spatial resolution (i.e., 30 m pixels). The CHM data was generated by the national park authorities from full-waveform Lidar data (Riegl 680i laser scanner, 350 kHz, nominal point density of 30–40 points per m2) acquired from an average altitude of 650 m above ground (ca. 300–400 m swath width) over 3 days in June under leaf-on conditions. We followed Bolton et al. (2015) and Bolton et al. (2017) in deriving metrics of post-disturbance tree cover and stand height, respectively. Tree cover was calculated as the share of 1 m CHM pixels that had a height greater 2 m, including both regenerating (2 to 5 m) and mature (> 5 m) trees, but excluding taller shrub and herbs (Latifi et al. 2016). Stand height was calculated as the 75% quantile of all 1 m CHM pixels. The 75% quantile, in contrast to upper quantiles (i.e., 99%), is more closely linked to the height structure of recovering trees, and likely less influenced by residual trees (Bolton et al. 2017). Yet, correlation analysis between the 75% quantile and other quantiles commonly used (i.e., 50%, 95% and 99%) indicated high similarity among stand height metrics (Pearson r > 0.8).
Predictive models of post-disturbance tree cover and stand height
Using the two Lidar-based forest structural metrics as response variables and the disturbance and recovery metrics described in the previous section as predictors (Table 1), we built predictive models using random forest regression (Breiman 2001; Ahmed et al. 2015). We build three models for each of the three spectral indices compared in this study (NBR, TCW, and DI). Further, we trained models with an increasing proportion of pixels used for training (0.25, 0.5, 1, 2.5, 5, 10, 20%), thus testing the effect of training sample size on model performance. To ensure that the full data space is utilized for training, we applied a stratified sampling design that first cuts all data points into quintiles and following selects n/5 samples at random from each quintile. Finally, to prevent including disturbances that occurred after Lidar data acquisition, we restricted the analysis to disturbances before 2009 (Lidar acquisition minus 3 years, which is the median disturbance duration). For assessing model performance, we randomly sampled an independent (i.e., not used for training) sample of n = 5000 pixels. From this validation sample, we calculated the root mean squared error (RMSE), the relative RMSE (divided by the mean), and the squared Pearson correlation coefficient (r2). Finally, we used the best performing model with minimum amount of training data (i.e., the most parsimonious and computationally least intensive model) to predict post-disturbance tree canopy cover and stand height for each disturbed pixel. By doing so we yielded continuous maps of post-disturbance tree cover and stand height for the year 2016, and thus with variable time since disturbance (5–30 years).
Analyzing structural recovery rates
We assumed a pixel to be structurally recovered if a minimum tree cover of 40% and a minimum stand height of 5 m were reached, closely following common forest definitions (Chazdon et al. 2016). We thus only assess whether a pixel can be considered reforested, but do not address recovery in floristic composition or biomass. To assess rates of structural recovery, we calculated the percentage of pixels meeting our recovery threshold for each year after disturbance (5–30 years). The calculation was stratified by the management regimes described in Sect. 2.1 (Fig. 1), as well as by elevation bands. Elevation was split into < 1150 m and ≥ 1150 m, with the former representing beech-dominated and the latter representing spruce-dominated forests (Röder et al. 2010; Bässler et al. 2016). To test for differences in recovery trajectories, we fit logistic functions to the recovery trajectories using non-linear regression. We weighted the parameter estimation by the number of observations, avoiding years with only few pixels to distort the model fit. From the logistic model, we derived the percentage of pixels recovered after 30 years as comparable measure across management regimes and elevation bands. Uncertainties in the logistic model were quantified using parametric bootstrap with 10,000 replications (Bates and Watts 2007).
Analyzing variability in tree cover and stand height
To assess the variability in tree cover and stand height after disturbance, we calculated the coefficient of variation for both indicators. To calculate the coefficient of variation—which needs a vector of data points and thus can’t be calculated at the pixel level—we aggregated the tree cover and stand height maps to a grid of five times five Landsat pixels (equalling 2.25 ha). The coefficient of variation thus serves as a proxy for the variability of tree cover and stand height among neighboring pixels, with a higher value indicating a higher local variability. We also calculated the median time since disturbance and the mean elevation for each grid cell, thus allowing us to stratify the analysis by time since disturbance and elevation, as described above.
Result
Mapping post-disturbance tree cover and stand height
The best predictive performance with minimum training data was achieved by the random forest models using the NBR-based disturbance and recovery metrics and 10% (n = 9424) of the total data for training (see Fig. 7 in the “Appendix”). In the following we thus report results for these models only. The final tree-cover model had an r2 of 0.71, a RMSE of 0.15 and a relative RMSE of 57% (Fig. 3). The final stand height model had an r2 of 0.58, a RMSE of 3.33 and a relative RMSE of 102% (Fig. 3).
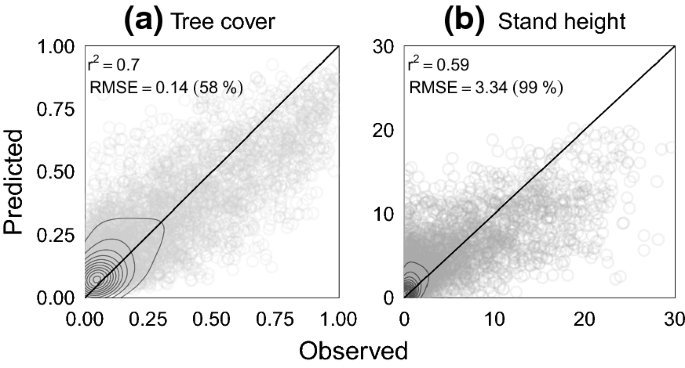
Scatterplots between predicted and observed post-disturbance canopy cover and stand height. Grey isolines indicate data density. The black horizontal line indicates the 1:1 line. Reported are the squared correlation coefficient (r2), the root mean squared error (RMSE), and the relative RMSE (relative to the mean; in brackets)
Maps of post-disturbance tree cover and stand height provide a detailed picture of the spatial variability in both structural variables across the landscape (Fig. 4). Well visible is the large area disturbed by bark beetles in the strictly protected part of the study area, with highly variable tree cover and stand height (Fig. 4a). In contrast, areas predominantly characterized by small-scale disturbance patches and forest management showed a more homogeneous tree cover and stand height (Fig. 4b).

Maps of post-disturbance tree cover and stand height for the study landscape in the year 2016. Close-up A shows an unmanaged bark beetle outbreak (ca. 1995) with high variability in tree cover and stand height. Close-up B shows a managed forest with small-scale harvests, and homogeneous tree cover and stand height after disturbance. Close-up C shows a managed wind-throw (i.e. a combination of natural and human disturbance) with variable post-disturbance tree cover and stand height. Disturbances after 2011 were not included in the analysis and are here labeled as disturbance too recent
Rates of structural recovery
The rate of structural recovery after disturbance was high, with on average 84 (79–88Footnote 2) % of the disturbed areas reaching our recovery thresholds (i.e., a minimum tree cover of 40% and minimum stand height of 5 m) after 30 years. Recovery rates varied, however, significantly between management regimes (i.e., no overlap of the 95% confidence intervals in Fig. 5 and Table 1). Fastest recovery was always found in managed forests, with on average 86 (83–90) % of the disturbed area in the beech-zone and 92 (89–94) % in the spruce-zone being recovered after 30 years. In strictly protected forests, only 55 (47–63) % of the disturbed area in the beech-zone and 60 (52–68) % in the spruce-zone reached the recovery threshold after 30 years. Recovery rates in protected forests—that is where natural disturbances are salvage harvested but not planted—were similar to managed forests in the beech-zone (84 [80–88]% of the disturbed area reaching the recovery threshold after 30 years), whereas recovery in protected forests of the spruce-zone was slower than in managed forests, but faster than in strictly protected forests (79 [75–84] % of the disturbances reaching the recovery threshold after 30 years).

Structural recovery trajectories after disturbance for the full landscape (left) as well as stratified by elevation bands and management regimes (right). Recovery is here defined as reaching a minimum tree cover of 40% and a minimum stand height of 5 m. The ribbons indicate the 95% prediction interval
Variability in post-disturbance tree cover and stand height
Differences in the variability of both tree cover and stand height between management regimes were generally low (Fig. 6). However, two important insights emerged. First, variability in stand height was significantly higher in strictly protected forests compared to managed forests in the beech-zone. Second, while variability in tree cover among all three management regimes was more similar in the initial years post-disturbance, variability in tree cover in managed and protected forests sharply declined after 25 years post-disturbance. Strictly protected forests, in turn, didn’t show this decline, and had a significantly higher variability in tree cover than managed forests 25 to 30 years post-disturbance, especially in the beech zone.

Variability in tree cover and stand height in five-year time-steps after disturbance. Variability is expressed as the coefficient of variation in a 2.25 ha forest patch (i.e., five times five Landsat pixels). Error bars indicate the 95% confidence interval. Shape of the dots indicate whether there were significant (p < 0.05) differences after FDR-correction
Discussion
Differences in structural recovery rates
Our results underline the high potential of Central European forests to recover from recent disturbance events, with 84 (79–88) % of the disturbed area exceeding 40% tree cover and 5 m stand height after 30 years. These rates are in the same order of magnitude as those found for other temperate forest ecosystems recovering from large, severe natural disturbance events (e.g., recovery after the Yellowstone fire, see Turner et al. (2016)). The speed of recovery differed substantially between managed and un-managed forests, meeting our expectations of faster recovery in managed forests. The faster recovery in managed forests can most likely be attributed to planned canopy openings via silvicultural interventions (resulting in advanced regeneration) and planting on disturbed sites, both facilitating a rapid and successful recovery. Yet, while slower in their recovery, forests also recovered from disturbance in the absence of any human intervention. Our results at the landscape scale are thus in line with local field-based evidence of high regeneration success following natural disturbances (Svoboda et al. 2010; Nováková and Edwards-Jonášová 2015; Zeppenfeld et al. 2015). Central European forests ecosystems are thus highly resilient to recent disturbance events. The future resilience of forests, however, remains an open question to be addressed in future work. Climate change has the potential to reduce resilience, causing larger disturbed areas and thus longer distances to seed source, while regenerating trees could increasingly suffer from extreme climatic events (Hansen et al. 2018; Johnstone et al. 2016).
It is important to note that we here only addressed one component of forest recovery, namely recovery in stand structure. While tree cover and stand height are important indicators of forest recovery that can be readily assessed over large areas (Bolton et al. 2013, 2015, 2017), other important indicators of recovery exist (Trumbore et al. 2015; Seidl et al. 2016c). For example, we did not assess floristic indicators here, yet tree species composition has been generally found to recover more slowly from disturbances than forest structure (Seidl et al. 2014a). However, for our study system there is strong evidence that recent disturbances have not changed species composition (Svoboda et al. 2010; Nováková and Edwards-Jonášová 2015; Zeppenfeld et al. 2015; Macek et al. 2017). Also, non-native tree species are of limited concern in our study system, as managers typically plant fast-growing and economically valuable native tree species such as Norway spruce.
Differences in variability in tree cover and stand height
We found slightly higher structural variability in un-managed forests, especially > 25 years post-disturbance. This finding is well in line with theoretical considerations suggesting that initial variability in recovery and pre-disturbance structural legacies lead to high structural diversity already in early stages of forest development (Donato et al. 2012; Bace et al. 2015), which can persist throughout stand development (Braziunas et al. 2018; Meigs et al. 2017). Especially the higher variability in stand heights for beech-dominated forests suggests the development of a more diverse canopy structure in unmanaged forests compared to managed forests. The slightly higher variability in tree cover found here further suggests that un-managed forests have a more irregular spacing and a higher fraction of gaps. However, differences in structural diversity were less obvious in forests characterized by only a single species that is in the spruce-zone. Our results thus highlight the concurrent importance of species diversity, in addition to structural diversity.
While a higher structural variability in un-managed forests likely means a reduced primary productivity (Bohn and Huth 2017; Zeller et al. 2018), it favors habitat diversity and thus is beneficial for biodiversity (Hilmers et al. 2018; Donato et al. 2012). Specifically, the diverse structures emerging after natural disturbances in unmanaged forests have recently been shown to harbor equal levels of plant and animal diversity as old-growth forest systems (Hilmers et al. 2018). Furthermore, a more diverse and patchy recovery—as shown for beech-dominated forests here—will benefit light-demanding early-seral species (Swanson et al. 2011; Lehnert et al. 2013) and could prevent the formation of homogeneous and species-poor pole-stage stands. In addition to benefiting biodiversity, variable recovery trajectories can also increase the future resilience of the system (Seidl et al. 2016a). As the primary species regenerating in our system is spruce (Svoboda et al. 2010; Zeppenfeld et al. 2015; Macek et al. 2017), the future risk for large-scale outbreaks of the European spruce bark beetle (Ips typographus L.) is high. Variability in recovery could prevent the synchronous exceedance of tree-size related susceptibility thresholds (Raffa et al. 2008; Seidl et al. 2016b), thus increasing the future stability of the system. However, as we found differences in structural diversity to be less distinct in areas dominated by spruce, further research is needed to test this hypothesis.
Methodological considerations
We here showed that Landsat time series—in conjunction with airborne Lidar data—can be successfully utilized for mapping post-disturbance tree cover and stand height in Central European forests. Yet, prediction accuracies were lower than those reported for landscapes in North America (Pflugmacher et al. 2012; Ahmed et al. 2015; Vogeler et al. 2018), especially for tree height. Differences might be explained by the higher spatial complexity of disturbances in our landscape (i.e., many mixed pixels containing disturbed and undisturbed areas due to the fine grain of the prevailing disturbance regime; Senf et al. 2017). We also note that most of the disturbances happened relatively recently (median time since disturbance: 11 years), leading to an overall low central tendency and variance in both tree cover and stand height, and thus a relatively high relative predictive error (Fig. 3). A further limitation lies in the fact that the Lidar data available for the current analysis was not evenly distributed across the three management regimes. While the uncertainties in our models might thus be higher than those obtained from terrestrial inventories, our approach—for the first time—allowed for a landscape-scale mapping of forest recovery for the Bohemian Forest. As such, Landsat—in combination with auxiliary Lidar data—is a promising tool for complementing existing data from field studies and modelling.
Conclusions and management implications
Our results have important implications for foresters and conservation managers. We here provide quantitative evidence that forest management did indeed facilitate the structural recovery of forests over un-managed conditions. This indicates that targeted management activities such as planting and fostering advanced regeneration might increase forest resilience to disturbances. At the same time, however, active management also tended to decrease the structural heterogeneity in the recovering forest, which has the potential to erode the future resilience of the system. This underlines that new management responses to disturbance are needed that maintain resilience, both in the short- and long-term. In the context of protected area management, we here show that natural disturbances—while killing trees—do not kill the forest, and that forests of Central Europe are well able to recover naturally from such large and severe disturbance events. Salvage harvesting and sanitation cutting in the buffer zones of protected areas did not significantly impede structural recovery, but showed a tendency to reduce structural variability in at least one of the two studied forest types. The increased diversity in naturally recovering forests is likely benefiting biodiversity, and thus contributing to the specific management objectives in protected areas. In conclusion, our analysis provides quantitative evidence for a high resilience of the forests of Central Europe to recent natural disturbance events.
Notes
Please note that the current core zones of the national parks are larger than shown in Fig. 1, yet we here focus on areas where management was excluded over the entire study period 1985–2016.
We here always report the 95% prediction interval derived from parametric bootstrap with 10,000 replications.
References
Ahmed OS, Franklin SE, Wulder MA, White JC (2015) Characterizing stand-level forest canopy cover and height using Landsat time series, samples of airborne LiDAR, and the Random Forest algorithm. ISPRS J Photogrammetry Remote Sens 101:89–101
Bace R, Svoboda M, Janda P, Morrissey RC, Wild J, Clear JL, Cada V, Donato DC (2015) Legacy of pre-disturbance spatial pattern determines early structural diversity following severe disturbance in Montane Spruce Forests. PLoS ONE 10:e0139214
Banskota A, Kayastha N, Falkowski MJ, Wulder MA, Froese RE, White JC (2014) Forest monitoring using landsat time series data: a review. Can J Remote Sens 40:362–384
Bartels SF, Chen HYH, Wulder MA, White JC (2016) Trends in post-disturbance recovery rates of Canada’s forests following wildfire and harvest. For Ecol Manage 361:194–207
Bässler C, Cadotte MW, Beudert B, Heibl C, Blaschke M, Bradtka JH, Langbehn T, Werth S, Müller J (2016) Contrasting patterns of lichen functional diversity and species richness across an elevation gradient. Ecography 39:689–698
Bates DM, Watts DG (2007) Nonlinear regression analysis and its applications. Wiley, New York
Bohn FJ, Huth A (2017) The importance of forest structure to biodiversity–productivity relationships. R Soc Open Sci 4:160521
Bolton DK, Coops NC, Hermosilla T, Wulder MA, White JC (2017) Assessing variability in post-fire forest structure along gradients of productivity in the Canadian boreal using multi-source remote sensing. J Biogeogr 44:1294–1305
Bolton DK, Coops NC, Wulder MA (2013) Measuring forest structure along productivity gradients in the Canadian boreal with small-footprint Lidar. Environ Monit Assess 185:6617–6634
Bolton DK, Coops NC, Wulder MA (2015) Characterizing residual structure and forest recovery following high-severity fire in the western boreal of Canada using Landsat time-series and airborne lidar data. Remote Sens Environ 163:48–60
Braziunas KH, Hansen WD, Seidl R, Rammer W, Turner MG (2018) Looking beyond the mean: drivers of variability in postfire stand development of conifers in Greater Yellowstone. For Ecol Manage 430:460–471
Breiman L (2001) Random forests. Mach Learn 45:5–32
Chazdon RL, Brancalion PH, Laestadius L, Bennett-Curry A, Buckingham K, Kumar C, Moll-Rocek J, Vieira IC, Wilson SJ (2016) When is a forest a forest? Forest concepts and definitions in the era of forest and landscape restoration. Ambio 45:538–550
Crist EP (1985) A TM tasseled cap equivalent transformation for reflectance factor data. Remote Sens Environ 17:301–306
Dobor L, Hlásny T, Rammer W, Barka I, Trombik J, Pavlenda P, Šebeň V, Štěpánek P, Seidl R (2018) Post-disturbance recovery of forest carbon in a temperate forest landscape under climate change. Agric For Meteorol 263:308–322
Donato DC, Campbell JL, Franklin JF (2012) Multiple successional pathways and precocity in forest development: can some forests be born complex? J Veg Sci 23:576–584
Forest Europe (2015) State of Europe’s forests 2015. Ministerial Conference on the Protection of Forests in Europe, Madrid
Frazier RJ, Coops NC, Wulder MA (2015) Boreal Shield forest disturbance and recovery trends using Landsat time series. Remote Sens Environ 170:317–327
Frazier RJ, Coops NC, Wulder MA, Hermosilla T, White JC (2018) Analyzing spatial and temporal variability in short-term rates of post-fire vegetation return from Landsat time series. Remote Sens Environ 205:32–45
Frolking S, Palace MW, Clark DB, Chambers JQ, Shugart HH, Hurtt GC (2009) Forest disturbance and recovery: a general review in the context of spaceborne remote sensing of impacts on aboveground biomass and canopy structure. J Geophys Res: Biogeosci. https://doi.org/10.1029/2008JG000911
Hais M, Jonášová M, Langhammer J, Kučera T (2009) Comparison of two types of forest disturbance using multitemporal Landsat TM/ETM + imagery and field vegetation data. Remote Sens Environ 113:835–845
Hais M, Wild J, Berec L, Brůna J, Kennedy R, Braaten J, Brož Z (2016) Landsat imagery spectral trajectories—important variables for spatially predicting the risks of bark beetle disturbance. Remote Sens 8:687
Hansen WD, Braziunas KH, Rammer W, Seidl R, Turner MG (2018) It takes a few to tango: changing climate and fire regimes can cause regeneration failure of two subalpine conifers. Ecology 99:966–977
Healey S, Cohen W, Zhiqiang Y, Krankina O (2005) Comparison of Tasseled Cap-based Landsat data structures for use in forest disturbance detection. Remote Sens Environ 97:301–310
Hermosilla T, Wulder MA, White JC, Coops NC, Hobart GW (2015) An integrated Landsat time series protocol for change detection and generation of annual gap-free surface reflectance composites. Remote Sens Environ 158:220–234
Hill S, Latifi H, Heurich M, Müller J (2017) Individual-tree- and stand-based development following natural disturbance in a heterogeneously structured forest: a LiDAR-based approach. Ecol Inform 38:12–25
Hilmers T, Friess N, Bässler C, Heurich M, Brandl R, Pretzsch H, Seidl R, Müller J, Butt N (2018) Biodiversity along temperate forest succession. J Appl Ecol 55:2756–2766
Johnstone JF, Allen CD, Franklin JF, Freilich LE, Harvey BJ, Higuera PE, Mack MC, Meentemeyer RK, Metz MR, Perry GLW, Schoennagel T, Tuner MG (2016) Changing disturbance regimes, ecological memory, and forest resilience. Front Ecol Environ 14:369–378
Kennedy RE, Cohen WB, Schroeder TA (2007) Trajectory-based change detection for automated characterization of forest disturbance dynamics. Remote Sens Environ 110:370–386
Kennedy RE, Yang ZG, Cohen WB (2010) Detecting trends in forest disturbance and recovery using yearly Landsat time series: 1. LandTrendr—temporal segmentation algorithms. Remote Sens Environ 114:2897–2910
Kennedy RE, Yang ZQ, Cohen WB, Pfaff E, Braaten J, Nelson P (2012) Spatial and temporal patterns of forest disturbance and regrowth within the area of the Northwest Forest Plan. Remote Sens Environ 122:117–133
Key CH, Benson NC (2006) Landscape assessment: ground measure of severity, the composite burn index; and remote sensing of severity, the normalized burn ratio. FIREMON: fire effects monitoring and inventory system, USDA Forest Service Rocky Mountain Research Station, Fort Collins
Latifi H, Heurich M, Hartig F, Müller J, Krzystek P, Jehl H, Dech S (2016) Estimating over- and understorey canopy density of temperate mixed stands by airborne LiDAR data. Forestry 89:69–81
Lehnert LW, Bässler C, Brandl R, Burton PJ, Müller J (2013) Conservation value of forests attacked by bark beetles: highest number of indicator species is found in early successional stages. J Nat Conserv 21:97–104
Lindenmayer DB, Foster DR, Franklin JF, Hunter ML, Noss RF, Schmiegelow FA, Perry D (2004) Salvage harvesting policies after natural disturbance. Science 303:1303
Macek M, Wild J, Kopecký M, Červenka J, Svoboda M, Zenáhlíková J, Brůna J, Mosandl R, Fischer A (2017) Life and death of Picea abies after bark-beetle outbreak: ecological processes driving seedling recruitment. Ecol Appl 27:156–167
McLachlan SM, Bazely DR (2001) Recovery patterns of understory herbs and their use as indicators of deciduous forest regeneration. Conserv Biol 15:98–110
Meigs GW, Kennedy RE, Cohen WB (2011) A Landsat time series approach to characterize bark beetle and defoliator impacts on tree mortality and surface fuels in conifer forests. Remote Sens Environ 115:3707–3718
Meigs GW, Morrissey RC, Bače R, Chaskovskyy O, Čada V, Després T, Donato DC, Janda P, Lábusová J, Seedre M, Mikoláš M, Nagel TA, Schurman JS, Synek M, Teodosiu M, Trotsiuk V, Vítková L, Svoboda M (2017) More ways than one: mixed-severity disturbance regimes foster structural complexity via multiple developmental pathways. For Ecol Manage 406:410–426
Nagel TA, Svoboda M, Diaci J (2006) Regeneration patterns after intermediate wind disturbance in an old-growth Fagus-Abies forest in southeastern Slovenia. For Ecol Manage 226:268–278
Nováková MH, Edwards-Jonášová M (2015) Restoration of Central-European mountain Norway spruce forest 15 years after natural and anthropogenic disturbance. For Ecol Manage 344:120–130
Peters DP, Pielke RA Sr, Bestelmeyer BT, Allen CD, Munson-McGee S, Havstad KM (2004) Cross-scale interactions, nonlinearities, and forecasting catastrophic events. Proc Natl Acad Sci 101:15130–15135
Pflugmacher D, Cohen WB, Kennedy RE (2012) Using Landsat-derived disturbance history (1972–2010) to predict current forest structure. Remote Sens Environ 122:146–165
Pickell PD, Hermosilla T, Frazier RJ, Coops NC, Wulder MA (2015) Forest recovery trends derived from Landsat time series for North American boreal forests. Int J Remote Sens 37:138–149
Raffa KF, Aukema BH, Bentz BJ, Carroll AL, Hicke JA, Turner MG, Romme WH (2008) Cross-scale drivers of natural disturbances prone to anthropogenic amplification: the dynamics of bark beetle eruptions. Bioscience 58:501–517
Röder J, Bässler C, Brandl R, Dvořak L, Floren A, Goßner MM, Gruppe A, Jarzabek-Müller A, Vojtech O, Wagner C, Müller J (2010) Arthropod species richness in the Norway Spruce (Picea abies (L.) Karst.) canopy along an elevation gradient. For Ecol Manage 259:1513–1521
Scheffer M, Carpenter SR, Dakos V, van Nes EH (2015) Generic indicators of ecological resilience: inferring the chance of a critical transition. Annu Rev Ecol Evol Syst 46:145–167
Schroeder TA, Cohen WB, Yang Z (2007) Patterns of forest regrowth following clearcutting in western Oregon as determined from a Landsat time-series. For Ecol Manage 243:259–273
Schurman JS, Trotsiuk V, Bace R, Cada V, Fraver S, Janda P, Kulakowski D, Labusova J, Mikolas M, Nagel TA, Seidl R, Synek M, Svobodova K, Chaskovskyy O, Teodosiu M, Svoboda M (2018) Large-scale disturbance legacies and the climate sensitivity of primary Picea abies forests. Glob Change Biol 24:2169–2181
Seidl R, Donato DC, Raffa KF, Turner MG (2016a) Spatial variability in tree regeneration after wildfire delays and dampens future bark beetle outbreaks. Proc Natl Acad Sci 113:13075–13080
Seidl R, Muller J, Hothorn T, Bassler C, Heurich M, Kautz M (2016b) Small beetle, large-scale drivers: how regional and landscape factors affect outbreaks of the European spruce bark beetle. J Appl Ecol 53:530–540
Seidl R, Rammer W, Spies TA (2014a) Disturbance legacies increase the resilience of forest ecosystem structure, composition, and functioning. Ecol Appl 24:2063–2077
Seidl R, Schelhaas MJ, Rammer W, Verkerk PJ (2014b) Increasing forest disturbances in Europe and their impact on carbon storage. Nat Clim Change 4:806–810
Seidl R, Spies TA, Peterson DL, Stephens SL, Hicke JA, Angeler D (2016c) REVIEW: searching for resilience: addressing the impacts of changing disturbance regimes on forest ecosystem services. J Appl Ecol 53:120–129
Seidl R, Thom D, Kautz M, Martin-Benito D, Peltoniemi M, Vacchiano G, Wild J, Ascoli D, Petr M, Honkaniemi J, Lexer MJ, Trotsiuk V, Mairota P, Svoboda M, Fabrika M, Nagel TA, Reyer CPO (2017) Forest disturbances under climate change. Nature Clim Change 7:395–402
Senf C, Pflugmacher D, Hostert P, Seidl R (2017) Using Landsat time series for characterizing forest disturbance dynamics in the coupled human and natural systems of Central Europe. ISPRS J Photogrammetry Remote Sens 130:453–463
Senf C, Pflugmacher D, Wulder MA, Hostert P (2015) Characterizing spectral–temporal patterns of defoliator and bark beetle disturbances using Landsat time series. Remote Sens Environ 170:166–177
Senf C, Pflugmacher D, Zhiqiang Y, Sebald J, Knorrn J, Neumann M, Hostert P, Seidl R (2018) Canopy mortality has doubled across Europe’s temperate forests in the last three decades. Nat Commun 9:4978
Senf C, Seidl R (2018) Natural disturbances are spatially diverse but temporally synchronized across temperate forest landscapes in Europe. Glob Change Biol 24:1201–1211
Stadelmann G, Bugmann H, Meier F, Wermelinger B, Bigler C (2013) Effects of salvage logging and sanitation felling on bark beetle (Ips typographus L.) infestations. For Ecol Manage 305:273–281
Svoboda M, Fraver S, Janda P, Bače R, Zenáhlíková J (2010) Natural development and regeneration of a Central European montane spruce forest. For Ecol Manage 260:707–714
Swanson ME, Franklin JF, Beschta RL, Crisafulli CM, DellaSala DA, Hutto RL, Lindenmayer DB, Swanson FJ (2011) The forgotten stage of forest succession: early-successional ecosystems on forest sites. Front Ecol Environ 9:117–125
Thom D, Seidl R (2016) Natural disturbance impacts on ecosystem services and biodiversity in temperate and boreal forests. Biol Rev 91:760–781
Thorn S, Bässler C, Brandl R, Burton PJ, Cahall R, Campbell JL, Castro J, Choi C-Y, Cobb T, Donato DC, Durska E, Fontaine JB, Gauthier S, Hebert C, Hothorn T, Hutto RL, Lee E-J, Leverkus AB, Lindenmayer DB, Obrist MK, Rost J, Seibold S, Seidl R, Thom D, Waldron K, Wermelinger B, Winter M-B, Zmihorski M, Müller J, Struebig M (2017) Impacts of salvage logging on biodiversity: a meta-analysis. J Appl Ecol 55:279–289
Trumbore S, Brando P, Hartmann H (2015) Forest health and global change. Science 349:814–818
Turner MG (2010) Disturbance and landscape dynamics in a changing world. Ecology 91:2833–2849
Turner MG, Whitby TG, Tinker DB, Romme WH (2016) Twenty-four years after the Yellowstone Fires: are postfire lodgepole pine stands converging in structure and function? Ecology 97:1260–1273
Vogeler JC, Braaten JD, Slesak RA, Falkowski MJ (2018) Extracting the full value of the Landsat archive: inter-sensor harmonization for the mapping of Minnesota forest canopy cover (1973–2015). Remote Sens Environ 209:363–374
Vogeler JC, Yang Z, Cohen WB (2016) Mapping post-fire habitat characteristics through the fusion of remote sensing tools. Remote Sens Environ 173:294–303
White JC, Wulder MA, Hermosilla T, Coops NC, Hobart GW (2017) A nationwide annual characterization of 25 years of forest disturbance and recovery for Canada using Landsat time series. Remote Sens Environ 194:303–321
Williams CA, Collatz GJ, Masek J, Goward SN (2012) Carbon consequences of forest disturbance and recovery across the conterminous United States. Glob Biogeochem Cycles 26:GB1005
Zeller L, Liang J, Pretzsch H (2018) For Ecosyst 5:4
Zeppenfeld T, Svoboda M, DeRose RJ, Heurich M, Müller J, Čížková P, Starý M, Bače R, Donato DC, Bugmann H (2015) Response of mountain Picea abies forests to stand-replacing bark beetle outbreaks: neighbourhood effects lead to self-replacement. J Appl Ecol 52:1402–1411
Acknowledgements
Open access funding provided by University of Natural Resources and Life Sciences Vienna (BOKU). Cornelius Senf acknowledges funding from the German Academic Exchange Service (DAAD) with funds from the German Federal Ministry of Education and Research (BMBF) and the People Programme (Marie Curie Actions) of the European Union’s Seventh Framework Programme (FP7/2007–2013) under REA grant agreement Nr. 605728 (P.R.I.M.E.—Postdoctoral Researchers International Mobility Experience). Rupert Seidl acknowledges support from the Austrian Science Fund FWF through START grant Y895-B25.
Author information
Authors and Affiliations
Corresponding author
Additional information
Publisher's Note
Springer Nature remains neutral with regard to jurisdictional claims in published maps and institutional affiliations.
Appendix
Appendix
See Fig. 7.

Comparison of several sample sizes and the three spectral indices for predicting post-disturbance tree cover and stand height derived from Lidar data. Error bars indicate the 95% confidence interval derived from repeating the model calibration/validation 30 times
Rights and permissions
Open Access This article is distributed under the terms of the Creative Commons Attribution 4.0 International License (http://creativecommons.org/licenses/by/4.0/), which permits unrestricted use, distribution, and reproduction in any medium, provided you give appropriate credit to the original author(s) and the source, provide a link to the Creative Commons license, and indicate if changes were made.
About this article

Cite this article
Senf, C., Müller, J. & Seidl, R. Post-disturbance recovery of forest cover and tree height differ with management in Central Europe. Landscape Ecol 34, 2837–2850 (2019). https://doi.org/10.1007/s10980-019-00921-9
Received:
Accepted:
Published:
Issue Date:
DOI: https://doi.org/10.1007/s10980-019-00921-9