
Abstract
High-level cognitive capacities that serve communication, reasoning, and calculation are essential for finding our way in the world. But whether and to what extent these complex behaviors share the same neuronal substrate are still unresolved questions. The present study separated the aspects of logic from language and numerosity—mental faculties whose distinctness has been debated for centuries—and identified a new cytoarchitectonic area as correlate for an operation involving logical negation. A novel experimental paradigm that was implemented here in an RT/fMRI study showed a single cluster of activity that pertains to logical negation. It was distinct from clusters that were activated by numerical comparison and from the traditional language regions. The localization of this cluster was described by a newly identified cytoarchitectonic area in the left anterior insula, ventro-medial to Broca’s region. We provide evidence for the congruence between the histologically and functionally defined regions on multiple measures. Its position in the left anterior insula suggests that it functions as a mediator between language and reasoning areas.
Introduction
The relation between linguistic, logical, and numerical abilities has long been debated. All three use formal rules to string smaller meaning-bearing forms into bigger ones, in a manner that ensures rich expressiveness. The thought that these emanate from one and the same neurocognitive system may thus be natural. Indeed, Aristotle believed that language and logic go hand in hand, as did the seventieth century Port Royal logicians/grammarians (cf. Gabbay et al. 2006; Chomsky and McGilvray 2009 for a historical perspective). Many modern linguists likewise believe that language and logic are interwoven in the human mind, which hosts a “natural logic…, a theory about the logical structure of natural language sentences and the regularities governing the notion of a valid argument for reasoning in natural language” (Lakoff 1970). But prominent philosophers in the modern era, notably Frege and Russell, thought otherwise and argued for their distinctness (van Heijenoort 1967). Many among these logicians focused on logic as a vehicle for undoing language-induced confusions, cognition being of lesser relevance. But their analyses, if valid, could well be couched in a cognitive framework. Thus the debate on the status of logic in linguistic communication and reasoning is real and it persists to this day in philosophy, psychology, and linguistics (Montague 1974; Horn 1989; Monti and Osherson 2012).
George Lakoff described the issue succinctly: “Natural logic,” he said, “taken together with linguistics, is the empirical study of the nature of human language and human reasoning. It can have right and wrong answers” (Lakoff 1970). We took this dictum seriously and searched for relevant evidence from neuroscience.
We were also aware that the relation between linguistic and arithmetical abilities has similarly generated controversy (Chomsky 1988; Henschen 1920; Makuuchi et al. 2012; Changeux et al. 1998). To a cognitive neuroscientist, then, the question of whether logical, linguistic, and arithmetical abilities emanate from one and the same neurocognitive system is empirical, one that has not yet been fully resolved. These observations led us to an empirical excursion involving logic, language, and arithmetic that consisted of three stages: (I) functional: we produced behavioral and neuroimaging evidence pointing to the distinctness of linguistic, logical, and numerical functions in a group of healthy subjects (Dehaene et al. 2003; Deschamps et al. 2015). (II) Anatomical: we uncovered the neuroanatomical properties of a relevant cortical area in a series of postmortem brains, analyzed its microstructure, and created a three-dimensional, cytoarchitectonic map. (III) Integration of neuroimaging and microstructural data: we demonstrated a high degree of overlap between the anatomical and the functional, suggesting a unit of functional anatomy.
The functional distinctness of language and logic was investigated through sentences with and without logical negation, an elemental operation known to incur substantial processing cost (Deschamps et al. 2015). The task we used, moreover, enabled us to investigate the distinctness of numerosity from logic and language: participants heard sentences that required a comparison between two quantities and were asked to verify these sentences against visual images. To study the functional distinctness of arithmetic, we manipulated the difficulty of numerical comparison by tinkering with the properties of these visual images. This technique enables us to probe the brain’s numerical comparison modules and at the same time language and logic were probed. In sum, a single complex experiment allowed us to compare neural aspects of language, logic, and numerosity.
Indices for processing complexity and anatomical loci of activity were reaction time (RT) and fMRI signal intensity. Anatomical distinctness was studied by subjecting the area in the vicinity of the single region that the fMRI study uncovered (the left anterior insula) to cytoarchitectonic analysis and the JuBrain atlas (Amunts and Zilles 2015). This analysis revealed a new, cytoarchitectonically uniform brain area, which turned out to be distinct from regions known to support language and numerosity, but overlapped with the functionally defined negation area.
Materials and methods
The fMRI experiment was approved by the ethics committee of the Montreal Neurological Institute (MNI). Twenty-three participants, recruited at McGill University, were tested. Two were excluded due to technical problems during scanning. All were right-handed as assessed by the Edinburgh Handedness Inventory (Russell 1903), native English speakers with normal hearing, and corrected to normal vision (mean age 23.6 SD = ± 4.5; range 19–35; 13 females). Participants gave informed consent in accordance with the ethics committee of the Montreal Neurological Institute (MNI) and the Helsinki Declaration of 1975 (revised 1983). The behavioral task performed inside the magnet is described in the text and in Fig. 1 . The anatomical data were obtained from ten human postmortem brains (five males, five females). Donors, who had no clinical history of neurological or psychiatric disease, were reached through the body donor program of the University of Duesseldorf, in accordance to the guidelines of the ethics committee. A detailed description of the properties of the experimental materials, the behavioral, anatomical, and imaging methods and data analyses are given in the SI Appendix.

Design. a Trials: auditory sentence probes or incrementally presented visual expressions. At a fixed point, a proportion-depicting image appeared. Task: to indicate whether or not the image matched the probe. Auditory and visual probes had the same content. b The processes involved in the analysis of linguistic stimuli: Phase I triggered phonetic, morphophonological and syntactic analyses, followed by semantic analysis that produced content—a formal meaning representation encoding a proportion between two numerosities; Phase II required image analysis: estimation of the numerosities of the two clusters of colored circled, followed by a comparison. Verification was the step where participants decided about the match between Phase I and Phase II representations. c Design: the experiment featured three factors (Polarity, Probe type, Proportion). The first two had two levels each (a), each presented with six tokens of five different proportions, p1–p5
Logical negation and language
Negation (¬) was defined by ancient Greek logicians as a logical operator that reverses the truth value of a proposition: if p, the proposition expressed by a sentence, is true, then ¬p is false and vice versa (Ross and Smith 1928). As a consequence, negation reverses the direction of inferences: p → q is equivalent to ¬q → ¬p. This can be demonstrated through a language example: Take p = I own a dog, q = I own an animal. If we assume that all dogs are animals ({x: x is a dog} ⊂ {x: x is an animal}), then q is true whenever p is true. We can therefore conclude that p → q. But note that negation reverses the direction of the inference: I don’t own an animal → I don’t own a dog. Linguistic negation, then, produces effects in keeping with propositional logic, and specifically, abides by the well-known equivalence p → q⇔¬q → ¬p. In cognitive neuroscience, studies have investigated the neural reflections of words that express negation (e.g., no, not) (Bahlmann et al. 2011; Tettamanti et al. 2008). Here, however, we sought evidence for a sharper distinction—we sought to dissociate language from logic. For that, we needed to distill logic from language—to extract logical operators from stimuli that contain them implicitly, even though they lack a corresponding word. Language avails us of tools to express negation implicitly. One of these is a class of polar quantifiers—quantity-denoting expressions that come in pairs, e.g., <more, less>. Here, we show that less, but not more, contains an implicit negation that is present logically (e.g., it reverses truth-value and thus inference direction), but absent morphophonologically (“Materials and methods”).
To be convinced that the meaning of less indeed contains implicit negation, note that if he drank more beer than wine is true, then he drank less beer than wine is false—truth value is reversed upon replacement of more by less. But this is not sufficient evidence. To be convinced that the meaning of less actually contains an implicit negation, let us use the inference reversal test demonstrated above for explicit negation (not): like in the affirmative sentence above, and given that all dogs are animals ({x: x is a dog} ⊂ {x: x is an animal}), we can safely infer from “more than half of my friends own a dog” that “more than half of my friends own an animal”. Now, consider how less induces an inference reversal, when it replaces more: if less than half of my friends do not own an animal, we can safely infer that less than half of my friends do not own a dog. This pattern of inferential relations between sentences, identical to those observed above with explicit negation, indicates that one member of the more/less pair implicitly contains a negation. Evidence adduced by semanticists indicates that less is the one (see “Materials and methods”). Seeking to test the separation between logic and language through negation, we constructed sentence stimuli that contained the complex quantifiers more/less than half.
Phase I sentence probes with more or less, thus had the same surface syntax, an identical number of words and syllables, and they unfolded in time in exactly the same way. The resulting meanings were identical up to negation, as their truth conditions were reversed—when one was true, the other was false and vice versa. Purely logical negation—which seems to be hidden in less (“Materials and methods”)—could thus be extracted. Our goal was to detect processing differences between more and less, and uncover the cerebral loci supporting these computations.
Yet, additional differences between the sentence probes required controls: more and less are different words with different lexical frequencies; as well, they induce reversed linear sequences of the two compared set cardinalities. These differences might matter. To control these differences, a pair of inequality symbols was used {<, >}, to construct non-language, quasi-algebraic, visual probes (Deschamps et al. 2015) that unfolded in time during Phase I (Fig. 1a). Probes with these elemental symbols were proper controls: like the quantifier pair, they denote a relation between two set cardinalities in reverse orders (p > q = q < p); unlike quantifiers, they are atomic, none contains a negation, and they have the same perceptual contour (“Materials and methods”).
Phase I probes thus featured a Probe type factor (+linguistic {more, less}; –linguistic {>, <}) and a Polarity factor (positive {more, >}; negative {less, <}). Our design dictated a focus on the processing signature of negation: the effect of negation (less–more) minus the specific symbol and reversal effects of the control conditions (<–>). That is, we expected to find a difference between differences or a Net Negation Interaction signature during Phase I—a Probe type X Polarity interaction between the two Phase I factors (NetNegInt = ∆“Less”–“More”> ∆“<”–“>”, which we will later cash in with specific units), which moreover stems from a negative Polarity signal that is higher than the positive.
Verification and numerosity
Each trial in our bi-phasic speeded verification task had a Phase I auditory sentence or a visual quasi-algebraic expression that was about a proportion between two sets of colored circles. Phase II featured an image, depicting a proportion between quantities of blue and yellow circles (Fig. 1a). Participants were asked to verify the sentence against the image as fast as they could. This task required the comprehension of a probe in Phase I, numerical estimation of each of the two quantities in the Phase II image (blue/yellow circles) followed by a comparison between them, and a decision (Fig. 1b).
In the Phase II images, the numerosity of one quantity was fixed across images and the other was modified parametrically (Fig. 1c). The resulting blue/yellow proportions influenced task difficulty, leading to a Comparison effect (Comp): task difficulty (measured by the RT) was expected to predict the relative values of the dependent variables, as well as test whether these variables behave in accordance with Weber’s Law (Vogel et al. 2013). The two effects—NetNegInt and Comp—are already known to be independent (Deschamps et al. 2015).
The Phase I probes and the Phase II images had identical conceptual content and the proportion between blue and yellow circles made the probes true or false. Each part contributed its share to the overall processing cost, which was behaviorally indexed by RT, time-locked to the end of Phase I.
Results
Behavioral tests
The 21 participants who performed the verification task during the scanning session (“Materials and methods”), exhibited low error rates (84% ± 4% correct responses per participant across all conditions) and exhibited the NetNegInt signature (Fig. 2a): the negation effect within the linguistic pair of condition was very robust: mean RTless= 1035.3 ms (SD = 313.2); mean RTmore= 882.8 (SD = 287) led to a very high significance on a paired-sample t test (t(20) = 7.33, p = 2.19e−0). The effect for the non-linguistic pair was less strong: mean RT< = 971.4 ms (SD = 330.7); mean RT> = 888 ms (SD = 277.7), a paired-sample t test (t(20) = 3.947, p = 0.0008). The linguistic effect, moreover, was manifested individually for almost all participants (Fig. 2b), as well as across all blue/yellow proportions in the Phase II images (Fig. 2c). The judgment times (on a logarithmic scale) were analyzed in a repeated-measures ANOVA. The NetNegInt signature thus took the following shape, replicating previous results: (1) a significant Probe type X Polarity interaction (F(1,20) = 9.18, p = 0.007); (2) the source of the interaction was: ∆RT“Less”–“More”> ∆RT“<”–“>”.

Behavioral results. a Group RT results by condition, across all image types (error bars: SEM). b The linguistic Polarity effect (RTless–RTmore across all blue/yellow proportions in the images) is very robust and is observed for most participants at the individual RT level (n = 21). Error bars mark SD. c Same group results, broken by proportion of circles visual probe (SEM). The x-axis is compressed logarithmically. d Gaussians fitted to the data from c before and after log compression show a greater R2 subsequent to compression, indicating compliance with Weber’s Law
An additional factor that affected RT was the proportion between the number of blue and yellow circles in the image: the experiment featured five red/yellow proportions (p1–p5 in Fig. 1c), sentence verification required image scanning and numerical comparison, which is subject to this law (Fig. 2d). Thus, we could test whether participants performed in keeping with Weber’s Law. Mean RT across participants for the verification of each proportion was computed, a Gaussian was fitted to these means and the coefficient of determination (R2) was calculated. The fit of the performance curve to a Gaussian improved when the x-axis (blue/yellow proportion) was logarithmic (R2log compressed = 0.995, right panel) compared to linear (R2linear = 0.927, left panel).
The effects of negation and proportion on RT were independent: a Gaussian with three parameters (baseline, amplitude and width) was fitted to the set of RT values of the more and less conditions (Fig. 2b) and a permutation test was conducted. The baseline parameter reflects RT effect due only to negation. Only this parameter yielded a significant difference between the conditions (p < 0.00003), indicating that RT effects due to proportion and those due to negation were independent. Past behavioral results (NetNetInt signature), as well as results pertaining to the modularity of linguistic and arithmetical processing, were thus replicated, this time during an imaging session (Deschamps et al. 2015).
Fmri
The analysis of fMRI data had two goals: (1) to identify brain loci supporting logical negation, the NegNetInt signature as a proxy; (2) to test the neural separation between linguistic, logical, and numerical processes. Our design, in which probes and images were present sequentially (Phases I, II), enabled to distinguish them analytically.
Phase I
A whole brain analysis of the Phase I BOLD activity patterns revealed two clusters that manifested the NetNegInt signature:
- a.
at the left anterior insula (NetNegInt: F1,20 = 21.84, p = 0.00015, corrected, see “Materials and methods”; Fig. 4b, Phase I panel). In this cluster, a main Polarity effect was also found (F1,20 = 38.04, p = 0.000005, corrected). In the linguistic conditions, the activation of the negative quantifier (PSC = 0.25%, SEM = 0.031) was higher than that of the positive one (PSC = 0.2%, SEM = 0.03). A paired-sample t test was highly significant (t(20), p < 0.0000001). No significant difference between the non-linguistic conditions (<, >) was found.
- b.
at the Superior Temporal Gyrus (STG), (NetNegInt: F1,20 = 37.44, p = 0.000006, corrected, Fig. 4c, Phase I panel). This cluster also exhibited a main effect of Polarity (F1,20 = 10.10, p = 0.005), where the negative quantifier produced a higher activation (0.21 ± 0.22) than the positive quantifier (0.13 ± 0.22), a statistically significant increase of 0.07 ± 0.05 (t(20) = 6.3, p = 0.000004). No significant difference between the non-linguistic conditions <, > was found.
Phase II
The Phase II BOLD response for numerical comparison (Comp), measured during and after image display, was detected using RT as a predictor (“Materials and methods”). As task difficulty was in keeping with Weber’s Law (Fig. 2d), RT could be used as a proxy for the Comp effect (Vogel et al. 2013). A parietal Comp effect was recorded bilaterally (Table 1, Fig. 3b). This result, while new for the present task, is consistent with previous ones that have identified similar regions as supporting numerical comparison (Heim et al. 2012; Piazza et al. 2004).

FMRI results, broken by phase. a Phase I NetNegInt clusters: (1) in the left anterior insula (red), where a main Polarity effect (F1,20 = 38.04, p = 0.000005) and a Polarity X Probe type interaction (F1,20 = 21.84, p = 0.00015); (2) in the left Superior Temporal gyrus (yellow), with a main effect of Instruction (F1,20 = 8.16, p = 0.010), a Phase I main effect of Polarity (F1,20 = 10.10, p = 0.005) and an interaction between Instruction and Polarity (F1,20 = 37.44, p = 0.000006). b Phase II Comp effect: the left and right clusters in which a Comp effect was significant (Table 1). A conjunction analysis between the Comp and NetNegInt clusters revealed no overlap
Next, we explored the Phase II activation patterns of the two NetNegInt masks from Phase I (Fig. 3a) to see whether the NetNegInt signature persists across both phases. The cluster on the left anterior insula (NetNegInt cluster henceforth) was the only one to exhibit this signature, indicating that negation is still active in the representation to be verified at trial’s end:
- a.
at the left anterior insula (NetNegInt: F(1,20) = 31.003, p = 0.000019, corrected, Fig. 4b, Phase II panel). A paired-sample t test for the linguistic condition compared the percent signal change (PSC) for the negative quantifier highly significant (t(20) = 8.698, p = 0.00000003, 2-tailed), with the negative condition producing higher activation than the positive one. No difference was found for the non-linguistic condition (<, >, t(20) = 0.762, p − 0.455).
Fig. 4 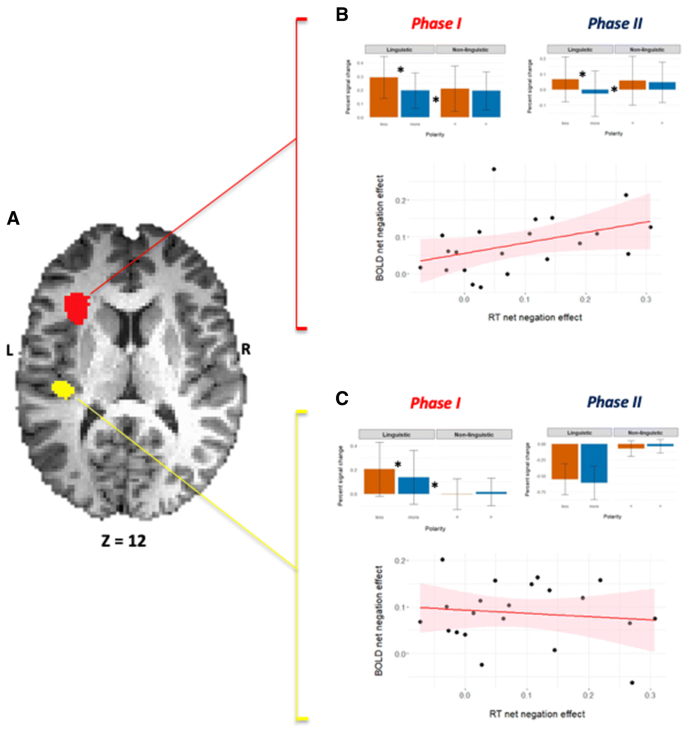
Comparing the modus operandi of two NetNegInt clusters. a An axial view of both clusters. b Phase I and Phase II imaging results for the NetNegInt cluster in the left anterior Insula (z = 12)—Group Percent Signal Change (PSC) by condition (error bars: SEM). A main Polarity effect (F1,20 = 38.04, p = 0.000005) and a Polarity X Probe type interaction (F1,20 = 21.84, p = 0.00015) were found (top), as well as a positive correlation between individual behavioral (RT) and fMRI (BOLD) NetNegInt effects. c Phase I imaging results for the NetNegInt cluster in the STG (top) and no correlation between behavioral and fMRI NetNegInt effects (r = − 0.12, p = 0.603)
- b.
at the STG, all activations were negative. Such deactivations are typically associated with the Default Network (of which the STG is sometimes thought to be part) and their interpretation in the context of a task remains elusive. Importantly, though, this all-around negative pattern is substantially different from any of the activation patterns reported above.

Behavior/signal intensity correlations
In the insular NegNetInt cluster, the fine behavioral and fMRI NetNegInt effects, calculated at the individual participant level, were correlated in both phases and were found to be significant for both phases (Phase I: r = 0.402, p = 0.035, Fig. 4b bottom panel; Phase II: r = 0.432, p = 0.025, both 1-tailed). The same analysis, carried out on the STG cluster, detected no significant behavioral/fMRI signal intensity correlation (Phase I: r = − 0.12, p = 0.603, Fig. 4c, bottom panel; Phase II: r = − 0.193, p = 0.2).
Uniqueness and cohesion of the insular cluster
In sum, the left anterior insular NetNegInt cluster was unique in exhibiting three critical properties that indicate functional cohesion: (a) the NetNegInt signature. (b) A significant positive correlation between the individual NetNegInt brain activity index (BOLD signal intensity) and its behavioral RT analog. (c) Persistence of both effects across Phases I–II, that is, during both the construction of a meaning representation and its verification against the image.
Next, the functional uniqueness of the insular NetNegInt cluster in both Phases I and II was tested, by identifying putative joint activities with clusters associated with other parts of the tasks. First, conjunction analyses on both the insular NetNegInt and Comp functional clusters detected no significant joint activity, indicating the anatomical disjointness of logical and numerical operations.
Finally, anatomical ROI analyses of JuBrain-defined areas 44, 45, viewed as classical language areas (Amunts et al. 1999; Amunts et al. 2004), were also conducted for both the NetNegInt and the Comp effects. No significant effect was found in the region of both anterior language areas, indicating the anatomical disjointness of logical and linguistic operations. Third, the left temporal pole, a region claimed to support combinatorial semantics (Anderson et al. 2017; Del Prato and Pylkkänen 2014), was silent, but began to surface as an active NetNegInt site once the threshold was dropped to a low, uncorrected p < 0.07. Linguistic activity, logical negation, and numerical operation (numerosity), then, were clearly dissociated. This uniqueness and cohesion pointed to the left anterior insula as a new region of interest, which we proceeded to characterize anatomically.
Cytoarchitectonic map
To identify the precise anatomical correlates of this region, we analyzed cytoarchitectonically the anterior insula in histological sections of ten human postmortem brains (five males, five females; Table 2). Image analysis and an observer-independent procedure relying on multivariate statistical analysis were used to define areal borders and quantify inter-areal differences (Amunts et al. 1999). We identified and mapped a new cytoarchitectonic area, Id7 (Insular dysgranular area 7), located on the latero-dorsal surface of the anterior short insular gyrus of both hemispheres (Figs. 5, 6). Area Id7 is a six-layered, dysgranular area, characterized by an interrupted and inconspicuous inner granular layer (layer IV). The mean volume of Id7 is 421 mm3 (SD = 146) on the left and 354 mm3 (SD = 129) on right hemisphere (corrected for shrinkage). Inter-hemispheric cytoarchitectonic analysis did not show any significant left–right asymmetry (paired sample t test = p > 0.05; “Materials and methods”).

Image acquisition and algorithm-based definition of areal borders. a Left lateral view of a postmortem brain (n 2); position of histological section n 4891 is indicated. Scale bar: 1 cm. b Cell body-stained coronal section shown in a, the box indicates the region of interest (ROI), shown in c; scale bars: 1 cm and 500 µm, respectively. d GLI profiles cover the ROI from layer I/II to layer VI/white matter. Black lines localize the significant maxima of the Mahalanobis distance function, as quantified in e. f Position (x) of the significant maxima of the Mahalanobis distance plotted against blocksize (y). Vertical frames correspond to the accepted borders. g Cytoarchitectonic border between areas Id7 and Op7. The border is characterized by an increase in density of pyramidal cells in deep layer III and a higher packing of multiform cells in layer VI of Op7. h Cytoarchitectonic border between areas Id7 and AOI. This border is characterized by a decrease in neuronal density, in deeper layers III and V of AOI. Roman numerals indicate cortical layers. Scale bar: 500 µm. SLS Superior Limiting Sulcus, SIG Short Insular Gyrus, SF Sylvian Fissure, Op7 opercular area 7, Id7 insular dysgranular area 7, AOI area orbito-insularis

Cytoarchitecture, probability maps of Id7 and location of the anatomical cluster. a The dysgranular area Id7 presents a discontinuous layer IV, interrupted by pyramidal cells from layers III and V. In the latter layers, two distinct sublayers can be distinguished. Roman numerals indicate cortical layers. Scale bar: 500 µm. b Caudal-rostral sequence of three coronal sections, from brain n 12 (Table S3), displaying the extent of area Id7 (in blue); on top right, a lateral view of the 3D reconstructed brain. Scale bar: 1 cm. c Probabilistic maps of Id7 in representative coronal, axial, and sagittal sections. Dark red and dark blue regions represent, respectively, areas with high (9–10 brains) and low overlap. The coordinates correspond to the stereotaxic position of the sections in anatomical MNI space (63)
Precise functional anatomy of negation
Next, the functional cluster was superimposed on the new anatomical area, to study the extent of overlap and topographical relationship. The voxels contained in both NetNegInt cluster and Id7 amounted to 29.2% of the anatomical volume and to 19.2% of the functional volume (once resampled for 1 mm3 anatomical voxels). The remainder, being in the white matter, was deemed to be a methodical artifact. Both clusters excluded all other cortical regions, in particular, areas 44 and 45 of Broca’s region (Fig. 7). The NetNegInt cluster’s peak of activation (− 30, 26, 8) was located within the anatomical Id7 at a probability p = 0.91, substantially higher than any analogous value found (Table 1). Moreover, the Centers of Mass of the anatomical probabilistic map (− 32, 23, 4) and the NetNegInt functional cluster (− 32, 26, 8) were closely related to one other (Fig. 7, see Supplementary Movie).

Anatomical region and Phase I functional activation in our task. An expansion of Fig. 3d: the visualization here is a three-dimensional reconstruction of a brain: the left frontal lobe is gradually removed to show the spatial relations between the fMRI activation cluster (magenta) and the cytoanatomically defined region Id7 (blue), as well as areas 44 (red) and 45 (yellow) in Broca’s region. The blue and red dots indicate the centers of mass of region Id7 and the fMRI cluster, respectively. The functional activation cluster and area Id7 overlap to a large extent, and are clearly separated from areas in Broca’s region. Op7 opercular area 7, Id7 insular dysgranular area 7, AOI area orbito-insularis, BA44 Brodmann’s Area 44, BA45 Brodmann’s Area 45
Finally, an anatomical ROI-based analysis, using a threshold map of the left Id7 (“Materials and methods”), also revealed a significant NetNegInt effect (F = 6.258, p < 0.02).
Discussion
Taken together, the anatomical and functional clusters exhibit bi-uniqueness: area Id7 is cytoarchitectonically distinct from its neighbors, and represents a new, independent cortical area of the anterior insula (Fig. 7, Movie). The functional NetNegInt coincides largely with Id7, overlaps with no other cortical region, and NetNegInt intensity correlates with RT at the individual participant level.
At a minimum, these results allow us to conclude that there is a single, anatomically and functionally cohesive core area involved in negation—Id7/NetNegInt. It is distinct from areas 44, 45, long believed to support syntax and from areas supporting core compositional semantic processes in the left temporal pole (Del Prato and Pylkkänen 2014). This distinctness and cohesiveness illustrates how relatively small elements of cognition can be neurally individuated and correlated with cytoarchitectonically defined areas. It also supports a modular view of cognitive functioning (Fodor 1983) and moreover seems to provide an answer, albeit partial, to the perennial debate about language and logic. If evidence from neuroscience bears on the debate, then Frege, Russell, and their followers were right: language and at least some aspects of logic are distinct. Finally, our results suggest that the border between the insula and Broca’s region is where language stops and logic begins.
We are not in a position to establish a connection between our results and other roles attributed to the anterior insula such as interoception. Yet, there is a difference in pattern: typically, the anterior insula is activated bilaterally (Zaccarella and Friederici 2015), and tends to co-activate with the anterior cingulate (Craig 2009; Engstrom et al. 2014), to which the left and right insulae appear to be massively connected (Mesulam and Mufson 1982) and have a similar histologic makeup (Ghaziri et al. 2017). Our study documented no bi-lateral co-activation. Recent lesion data, moreover, relate interoceptive deficits to regions that seem to exclude the here defined left Id7 (Salomon et al. 2018).
So what can we conclude and where do we go from here? Our experiment demonstrates that the processing of one logical connective, ¬, has a distinct neurocognitive signature, supported by a histologically coherent piece of neural tissue, the left Id7, that is, outside the traditional language regions, lying between them and decision making areas. While we believe that this set of findings provides the basis for an important argument for language–logic dissociation, we are aware that it is based on a single set of results, one that needs to be further enriched in the same spirit. Convergent results from related explorations of other logical connectives will no doubt help to bolster our claims. E.g., if experiments can be designed to successfully isolate disjunction, conjunction, and the like, and their results converge, solid foundations for a new perspective on language–logic relations would be constructed.
With this qualification, can we conclude that the philosophers were right? Gottlob Frege, in his Begriffschrift, famously asserted that linguistic rules relate to logic as the eye compares to a microscope (van Heijenoort 1967): language is flexible, but logic is more rigid—mediating between linguistic expressions and objects suitable to reasoning. While Frege and Russell had no cognitive perspective, let alone a neurological one, we feel free to add one and assign an anatomical construal of Frege’s assertion in regards to the spatial position of the left Id7: like a microscope, this area may “translate” linguistic objects into logical forms. A mediating role has already been proposed for the posteriorly adjacent, middle left insula, claimed to mediate between motor planning and speech (Dronkers 1996). In a similar vein, it is proposed that the left Id7 mediates between the language regions and prefrontal areas engaged in reasoning (Baggio et al. 2016; Monti et al. 2007). By doing so, it seems to play a crucial role in what could be a core neural network that underlies our humanity.
Data availability
Analysis scripts, to reproduce the reported results, are available through the first author’s account (https://www.grodzinskylab.com/data-and-code). The corresponding datasets are available on reasonable request. The cytoarchitectonic probabilistic map is available to the research community, e.g., through the JuBrain atlas and the HBP Human Brain Atlas (https://www.humanbrainproject.eu/en/explore-the-brain/atlases/).
References
Amunts K, Zilles K (2015) Architectonic mapping of the human brain beyond Brodmann. Neuron 88:1086–1107. https://doi.org/10.1016/j.neuron.2015.12.001
Amunts K et al (1999) Broca’s region revisited: cytoarchitecture and intersubject variability. J Comp Neurol 412:319–341
Amunts K et al (2004) Analysis of neural mechanisms underlying verbal fluency in cytoarchitectonically defined stereotaxic space—the roles of Brodmann areas 44 and 45. NeuroImage 22:42–56
Anderson AJ et al (2017) Predicting neural activity patterns associated with sentences using a neurobiologically motivated model of semantic representation. Cereb Cortex 27:4379–4395. https://doi.org/10.1093/cercor/bhw240
Baggio G et al (2016) Multiple neural representations of elementary logical connectives. NeuroImage 135:300–310. https://doi.org/10.1016/j.neuroimage.2016.04.061
Bahlmann J, Mueller JL, Makuuchi M, Friederici AD (2011) Perisylvian functional connectivity during processing of sentential negation. Front Psychol 2:104. https://doi.org/10.3389/fpsyg.2011.00104
Changeux JP, Connes A, DeBevoise MB (1998) Conversations on mind, matter, and mathematics. Princeton University Press, Princeton
Chomsky N (1988) Language and problems of knowledge, vol 16. MIT Press, Cambridge
Chomsky N, McGilvray JA (2009) Cartesian linguistics: a chapter in the history of rationalist thought. Cambridge University Press, Cambridge
Craig AD (2009) How do you feel-now? The anterior insula and human awareness. Nat Rev Neurosci 10:59–70. https://doi.org/10.1038/nrn2555
Dehaene S, Piazza M, Pinel P, Cohen L (2003) Three parietal circuits for number processing. Cogn Neuropsychol 20:487–506. https://doi.org/10.1080/02643290244000239
Del Prato P, Pylkkänen L (2014) MEG evidence for conceptual combination but not numeral quantification in the left anterior temporal lobe during language production. Front Psychol 5:524. https://doi.org/10.3389/fpsyg.2014.00524
Deschamps I, Agmon G, Loewenstein Y, Grodzinsky Y (2015) The processing of polar quantifiers, and numerosity perception. Cognition 143:115–128. https://doi.org/10.1016/j.cognition.2015.06.006
Dronkers NF (1996) A new brain region for coordinating speech articulation. Nature 384:159–161
Engstrom M, Karlsson T, Landtblom AM, Craig AD (2014) Evidence of conjoint activation of the anterior insular and cingulate cortices during effortful tasks. Front Hum Neurosci 8:1071. https://doi.org/10.3389/fnhum.2014.01071
Fodor JA (1983) The modularity of mind: an essay on faculty psychology. MIT Press, Cambridge
Gabbay DM, Thagard P, Woods J, Jacquette D (2006) Philosophy of logic. Elsevier Science, New York
Ghaziri J et al (2017) The corticocortical structural connectivity of the human insula. Cereb Cortex 27:1216–1228. https://doi.org/10.1093/cercor/bhv308
Heim S et al (2012) The language-number interface in the brain: a complex parametric study of quantifiers and quantities. Front Evol Neurosci 4:4
Henschen SE (1920) Klinische und anatomische Beiträge zur Pathologie des Gehirns: 5. Teil (Kap. III: Über Amusie. -IV: Zur Akalkulie bei der Aphasie.). -6. Teil (Kap. II: Die temporale Aphasie. -III: Die sogenennte transkortikale sensorische Aphasie. -VI: Die anguläre Aphasie. -VII: Die parietale Aphasie. -VIII: Die okzipitale Aphasie.). Nordiska Bokhandeln
Horn LR (1989) A natural history of negation. University of Chicago Press, Chicago, pp 164–168
Lakoff G (1970) Linguistics and natural logic. Synthese 22:151–271
Makuuchi M, Bahlmann J, Friederici AD (2012) An approach to separating the levels of hierarchical structure building in language and mathematics. Philos Trans R Soc Lond Series B Biol Sci 367:2033–2045. https://doi.org/10.1098/rstb.2012.0095
Mesulam MM, Mufson EJ (1982) Insula of the old world monkey. III: Efferent cortical output and comments on function. J Comp Neurol 212:38–52. https://doi.org/10.1002/cne.902120104
Montague R (1974) Towards a Proper Treatment of Quantification in English. In: Thomason RH (ed) Formal Philosophy Yale. University Press Formal Philosophy
Monti MM, Osherson DN (2012) Logic, language and the brain. Brain Res 1428:33–42. https://doi.org/10.1016/j.brainres.2011.05.061
Monti MM, Osherson DN, Martinez MJ, Parsons LM (2007) Functional neuroanatomy of deductive inference: a language-independent distributed network. NeuroImage 37:1005–1016. https://doi.org/10.1016/j.neuroimage.2007.04.069
Piazza M, Izard V, Pinel P, Le Bihan D, Dehaene S (2004) Tuning curves for approximate numerosity in the human intraparietal sulcus. Neuron 44:547–555
Ross WD, Smith JA (1928) The works of Aristotle. Clarendon Press, Oxford
Russell B (1903) The principles of mathematics, vol 1. University Press, Cambridge
Salomon R et al (2018) Insula mediates heartbeat related effects on visual consciousness. Cortex 101:87–95. https://doi.org/10.1016/j.cortex.2018.01.005
Tettamanti M et al (2008) Negation in the brain: modulating action representations. NeuroImage 43:358–367. https://doi.org/10.1016/j.neuroimage.2008.08.004
van Heijenoort J (1967) From Frege to Gödel: a source book in mathematical logic. Harvard University Press, Harvard, pp 1879–1931
Vogel SE, Grabner RH, Schneider M, Siegler RS, Ansari D (2013) Overlapping and distinct brain regions involved in estimating the spatial position of numerical and non-numerical magnitudes: an fMRI study. Neuropsychologia 51:979–989. https://doi.org/10.1016/j.neuropsychologia.2013.02.001
Zaccarella E, Friederici AD (2015) Reflections of word processing in the insular cortex: a sub-regional parcellation based functional assessment. Brain Lang 142:1–7. https://doi.org/10.1016/j.bandl.2014.12.006
Acknowledgements
Partially supported by Israel Science Foundation, Grants No. 2093/16 (Y.G.) and No. 757/16 (Y.L.), The Gatsby Charitable Foundation (Y.L.) and by the European Union’s Horizon 2020 Research and Innovation Programme under Grant Agreement No. 7202070 (HBP SGA1) and No. 785907 (HBP SGA2). We are grateful to Hartmut Mohlberg and Sebastian Bludau for their support in 3D reconstruction and analyses of profiles and volumes.
Author information
Authors and Affiliations
Corresponding author
Ethics declarations
Conflict of interest
We declare no conflict of interest.
Ethical approval
The fMRI experiment was approved by the ethics committee of the Montreal Neurological Institute (MNI).
Informed consent
Informed consent was obtained from all individual participants included in the study.
Ethical standards
Participants gave informed consent in accordance with the ethics committee of the Montreal Neurological Institute (MNI) and the Helsinki Declaration of 1975 (revised 1983). Brain donors were reached through the body donor program of the University of Duesseldorf, in accordance to the guidelines of the ethics committee.
Additional information
Publisher's Note
Springer Nature remains neutral with regard to jurisdictional claims in published maps and institutional affiliations.
Electronic supplementary material
Below is the link to the electronic supplementary material.
429_2019_1975_MOESM2_ESM.mov
Anatomical region and functional activation in logical processing task: video expansion of Fig. 7 (MOV 6708 kb)
Rights and permissions
Open Access This article is distributed under the terms of the Creative Commons Attribution 4.0 International License (http://creativecommons.org/licenses/by/4.0/), which permits unrestricted use, distribution, and reproduction in any medium, provided you give appropriate credit to the original author(s) and the source, provide a link to the Creative Commons license, and indicate if changes were made.
About this article

Cite this article
Grodzinsky, Y., Deschamps, I., Pieperhoff, P. et al. Logical negation mapped onto the brain. Brain Struct Funct 225, 19–31 (2020). https://doi.org/10.1007/s00429-019-01975-w
Received:
Accepted:
Published:
Issue Date:
DOI: https://doi.org/10.1007/s00429-019-01975-w