
Abstract
Stylized facts show there is a clustering of countries in three balanced growth paths characterized by differing income/growth, human capital and incidence of infectious diseases. To explain this, we develop a dynamic general equilibrium model incorporating SIS epidemiology dynamics, where households choose how much to invest in human and physical capital, as well as in controlling the risk of infection. In the decentralized economy, households do not internalize the externality of controlling infection. There are multiple balanced growth paths where the endogenous prevalence of the disease determines whether human capital is accumulated or not, i.e., whether there is sustained economic growth or a poverty trap. We characterize the optimal public health policy that internalizes the disease externality and the subsidy that decentralizes it. Perversely, for countries in a poverty trap and most afflicted with diseases, the optimal subsidy is lower than for growing economies. We also study the quantitative effects of better control of diseases, and of increasing life expectancy on countries in a poverty trap.
1 Introduction
The stylized facts on infectious diseases and the macroeconomy are that there is a clustering of countries into three different groups: with high income (and growth), high human capital accumulation and almost no incidence of infectious diseases (largely OECD countries); with lower income (and growth), intermediate human capital and low incidence of infectious diseases (developing countries); and countries in a poverty trap with no growth, low human capital and the high incidence of infectious diseases (largely in sub-Saharan Africa). There is a high persistence of countries in each of these three states. We model the joint determination of the transmission of infectious diseases, human capital and economic growth in a dynamic general equilibrium model to generate three balanced growth paths, one of which is a poverty trap, consistent with these facts. The modeling of infectious disease based on the SIS epidemiology model enables us to isolate the effect of the externality associated with infectious disease transmission on the macroeconomy. We, thus, characterize the optimal public health policy and how it can be decentralized via a health subsidy. We also study the quantitative effect of increasing life expectancy and of greater effectiveness of control of diseases through exogenous medical changes.
To model the interaction of infectious diseases, human capital and economic growth, we build on the Lucas (1988) model of endogenous growth where individuals allocate time between working and accumulating human capital. In our environment, individuals are exposed to the risk of being infected by infectious diseases that incapacitate them from working or accumulating human capital. The transmission of diseases builds on insights from the mathematical biology literature on epidemiology of infectious diseases. However, unlike the biology literature, there is a choice to spend resources, either private or public, to control the transmission of diseases by affecting their infectivity. As the diseases affect the ability to work and the productivity of human capital, their incidence affects the accumulation of human capital. This effect on human capital accumulation in turn affects incentives to accumulate physical and health capital. In turn, human capital accumulation affects incentives to control the incidence of the disease through affecting the shadow cost of infection. Thus, we endogenize the main objects of interest: the disease incidence through expenditures on health where the cost of the disease is affected by the human and physical capital; human capital where its returns are affected by the incidence of the disease; and income and welfare which are directly affected by human capital and incidence of the disease, as well as the investment rates in the three different types of capital being determined endogenously in an equilibrium path; and labor participation and productivity being determined by the evolution of the disease as well as the choice of human capital accumulation.
This paper is part of a larger project to incorporate epidemiology models into dynamic general equilibrium models (see Goenka and Liu 2012; Goenka et al. 2014).Footnote 1 The epidemiology models lend themselves to integration into economic models as they capture disease transmission via dynamical systems. In this paper, we concentrate on recurring diseases, that is, individuals can recover from the disease but recovery does not confer any subsequent immunity to either the same or other diseases. We adopt the canonical SIS epidemiological model. An individual is born healthy into a large household,Footnote 2 susceptible to the disease, S, may get infected and become infective, that is ill and capable of transmitting it to others, I, and then recover to become susceptible again, S. Recurring diseases cover many of the important infectious diseases that are not controlled through immunizations. They include the different strains of influenza, STDs, malaria, schistosomiasis, dengue and the so-called neglected diseases. Some of these are vector-borne diseases but from an economic modeling point of view, the explicit modeling of the vector evolution (such as population of mosquitoes) should be considered if it adds additional insight into the economic analysis .Footnote 3 We abstract from this.
We study the competitive equilibrium balanced growth paths in a decentralized economy and show that the model generates multiple balanced growth paths (BGPs) consistent with these three clusters, where infectious diseases are either eradicated or are endemic. In the disease-free case, countries grow at a faster rate, while in the disease-endemic cases, countries either grow at a slower rate or are in a poverty trap, depending on the investment in human capital, which in turn is influenced by the severity of the disease prevalence. The intuition is that marginal product of human capital investment depends on the effective labor force (or the disease prevalence), which itself is endogenously determined by the effective health capital. When the effective health capital is low and infectious diseases have high incidence, the return to human capital is extremely low. Thus, there is no incentive for human capital accumulation and countries are in a poverty trap. The endogenous incidence of the disease is crucial in determining whether the economy grows or not. If a country is in a poverty trap, then we show that a marginal reduction in the disease may not be sufficient for the economy to grow. If diseases are endemic, then higher disease incidence decreases savings and growth, as well as the investment rate in health and physical capital. The share of investment in health capital is increasing in the growth rate or decreasing with disease incidence. The intuition for this is similar: The higher disease incidence depresses returns to human capital which reduces savings and also the returns to controlling the disease. The differential disease incidence generates heterogeneity in savings and investment rates across and within the different balanced growth paths, which cautions the use of Solow-type models in studying the interaction of disease and growth.
In the decentralized economy, households do not take into account how their own decisions affect the aggregate disease dynamics. Thus, they do not internalize the externality of infectious disease transmission. While this externality has been recognized (Geoffard and Philipson 1996; Gersovitz and Hammer 2004), its effects have not been fully explored in a dynamic general equilibrium environment. To study the effect of this externality and contrast the competitive situation (based on private health expenditures) from the effect of public health policy, we also study the centralized economy where a social planner takes the disease externality into account. In this case, the effective health capital is higher, and thus, typically human capital accumulation and the growth rate are also higher.Footnote 4 However, public health policy does not guarantee sustained economic growth and there can be the situation where the disease incidence is so high that even in the planning outcome there is no human capital accumulation and economic growth. As delivery of effective public health programs remains a challenge in poor countries, we characterize the optimal subsidy that will decentralize the planning solution. The optimal subsidy is proportional and increasing in the size of the disease externality. It also depends on whether human capital is being accumulated or whether a country is growing or not. We show that there can be a perverse situation where countries that are most afflicted by infectious diseases will have lower subsidies than countries that grow, as the growth dividend from reducing the incidence of diseases is absent. Thus, for the least developed countries, the poor health conditions are not only the result of tighter budget constraints, but more importantly the lack of incentives for investing in health. There may also be a feedback effect from the human capital to the contact rate through increasing awareness and understanding of the nature of diseases. If this effect is present, then economies may still grow with high contact rate of diseases and there may be a channel to enable growth of economies in a poverty trap through increasing human capital.Footnote 5.
To see the effect of the disease externality, we calibrate the model to parameters for the poverty trap economies to compare the competitive with the optimal paths. First, we see the effect of an epidemiological transition, i.e., for the same expenditure the contact rate drops as the medical strategies become more effective. While a 42% drop in the contact rate is needed for the economy to start growing in the optimal path, a decrease of 58% is needed in the competitive case. Second, we examine the effect of a demographic transition, where the life expectancy increases exogenously. In the competitive case, life expectancy has to increase from the current 55 years to 67 years before economy starts growing, but only to 59.5 years in the optimal path. In both scenarios, when the economy is growing, the growth rate is double in the optimal as opposed to the competitive path. Thus, instituting public health policies that internalize the disease externality leads to growth sooner, as well at a faster rate.
The paper is organized as follows. Section 2 provides the stylized facts on the relationship between disease incidence, income and growth, and educational attainment. Section 3 presents the economic epidemiology model, and Sect. 4 examines multiple balanced growth paths in the decentralized economy. Section 5 studies the centralized economy and optimal public health policy. Section 6 contains the model calibrations and simulations. Section 7 concludes.
2 The empirical facts
We conduct a cluster analysis to group countries based on various economic, educational, demographic and health-related indicator variables.Footnote 6 These stylized facts on the cross-country evidence on the relationship among diseases, human capital and growth motivate this paper. We adopt a cluster analysis rather than reduced-form regression for two reasons: economic growth, human capital and disease prevalence are simultaneously determined, causing an endogeneity problem; and there is a nonlinearity problem due to the nonlinearity in disease evolution. The disease incidence is important in determining the multiple balanced growth paths, and we need to understand changes within and across these balanced growth paths. These issues impose a challenge for reduced-form regression and can be a reason for the sensitivity of the estimates for the impact of disease control on the economy.Footnote 7
The mortality rate is often used as a measure of burden of infectious diseases, for reasons of both humanity and easy data accessibility. However, morbidity caused by infectious diseases is at least as important as mortality (see Bleakley 2007, 2010 for impact of diseases with morbidity but low mortality). Diseases with a low mortality rate but a high morbidity rate have effects in terms of both the direct cost of treating and indirect of cost of being disabled from the disease. As a result, World Health Organization (WHO) provides a summary measure—disability-adjusted life year rates (DALY)—to give a better indication of the burden of diseases from both mortality and morbidity. It is calculated as the ratio of sum of the years of life lost due to premature mortality (YLL) and the years lost due to disability (YLD) in the population.Footnote 8 As this paper focuses more on disability caused by infectious diseases, ideally we should be using YLD as the measure for the burden of infectious diseases. However, since YLD is not available at the country level, we use DALY in the following cluster analysis. As countries bearing the heavier burden of infectious diseases—higher in DALY—are higher in both YLL and YLD, our results should be robust to any of the above measurements for the cluster analysis. Moreover, as DALY at country level is only available for year 2000 and 2010, we also include mortality rate caused by infectious diseases. For educational attainment at the country level, we use the updated average schooling years from Barro and Lee (2013), which is available from 1965 to 2010 at 5-year intervals. The rest of data used for the cluster analysis are from the World Bank database, including GDP per capita in years 1965 and 2012, average growth rate from year 1965 to 2012, life expectancy in years 1965 and 2012.
The cluster analysis endogenously classifies all the countries into three groups, which we call developed countries, developing countries and least developed countries (LDCs). The LDCs are largely in the Sub-Saharan African Region.Footnote 9 Table 1 describes the mean and confidence intervals of one standard deviation for the selected variables used in the cluster analysis at each group level. The average growth rate for developed countries is around \(1.86\%\), and for developing countries it is around \(1.79\%\). In contrast, the LDCs have the lowest growth rate, and in particular, some countries are in a poverty trap with a negative average growth rate. In terms of the spread of infectious diseases, the LDCs bear the heaviest burden of infectious diseases. On average, for each individual \(38\%\) of his time is lost due to either premature death or disability caused by infectious diseases. As a comparison, an individual in developing countries loses \(6.5\%\) of his time due to infectious diseases and this number is \(1.52\%\) for developed countries. The life expectancy at birth in developed countries is significantly higher than the one in developing countries, which again is significantly higher than the one in the LDCs. For the educational attainment, developed countries have the highest educational levels with 7.04 average schooling years in 1965 and 11.20 in 2010, while the LDCs have the lowest educational levels with 1.22 in 1965 and 4.44 in 2010. Countries with heaviest burden of infectious diseases are countries with lowest GDP per capita and associated with lowest average schooling years, though on average GDP per capita, life expectancy and educational level have risen for the past few several decades. Thus, there is a negative relationship between disease incidence and economic development, which motivates the economic epidemiology model in this paper.
Furthermore, we provide a dynamic view of how income, education and disease prevalence coevolve through Markov transition matrix (Quah 1993).Footnote 10 Due to the data availability, we focus on the transition from 1990 to 2010, during which period we have data on GDP per capita, schooling and prevalence of Tuberculosis for total 114 countries.Footnote 11 We construct Markov transition matrix for income, schooling and disease prevalence separately following Quah (1993). For income, we took each country’s GDP per capita relative to the world average as the basic data and define three states—high-income state, medium-income state and low-income state. Similarly, we define three states for schooling—high educational attainment, medium educational attainment and low educational attainment, and three states for the prevalence of tuberculosis—no prevalence, low prevalence and high prevalence. We estimated the \(3 \times 3\) Markov chain transition matrix, seen in Table 2, whose (j, k) entry is the probability that an economy in state j transits to state k. The estimated transition matrices show that there is high persistence in the transition over the 20 years from 1990 to 2010—\(92\%\) countries which were poor in 1990 have remained poor in 2000, \(68\%\) countries which had low average schooling years have remained low in educational attainment, and \(76\%\) countries which had above average disease prevalence have remained high in disease prevalence. We also look at the countries which that have been in a poverty trap (which were poor in 1990 have remained poor in 2010), and examine how disease prevalence and schooling change among those countries. We found that for those countries, 72 percent remain in the state with high disease prevalence and 63 percent have remained in low educational attainment state from 1990 to 2010.
These empirical facts are also consistent with the micro-empirical studies in the literature. For instance, Bleakley (2007) evaluates the economic consequence of the successful eradication of hookworm disease from the American South and finds that areas with higher level of hookworm infection prior to the intervention experienced greater increase in school enrollment, attendance and literacy. Miguel and Kremer (2004) evaluate a Kenyan project with deworming drugs targeting intestinal helminths, and find that the program substantially reduced school absenteeism. Fortson (2011) finds in 15 sub-Saharan countries that areas with higher HIV incidence experienced relatively larger decline in schooling. The evidence on eradication or control of malaria also indicates positive effects on schooling, health capital and subsequent income (Bleakley 2010; Lucas 2010). Cutler et al. (2010) find positive but weak effects of malaria eradication in India. These micro-empirical studies focus on diseases where the burden is predominantly in the childhood. There is a concern that if there is child labor then part of the effect of decline in morbidity increases child labor supply. Our model is an infinitely lived agent framework (as we want to abstract from mortality effects of diseases) and agents can accumulate human capital in any period. This is consistent with the evidence as increase in human capital will subsequently increase income, but it also takes a more general view of human capital accumulation through non-schooling acquisition of skills.
3 The economic epidemiology model
The model follows the Lucas (1988) endogenous growth model with human capital accumulation, where we incorporate the dynamics of disease transmission. To avoid keeping track of the cross-sectional distribution of the healthy and infected individuals, and to stay close to the canonical endogenous growth model, we adopt the framework of a large representative household.
Households We assume the economy is populated by a continuum of non-atomic identical households who are the representative decision-making agents. The size of the population in each household grows over time at the rate of \(b-d \ge 0\), where b is the birth rate and d is the death rate.Footnote 12 Within each household, an individual is either healthy or infected by the diseases. We assume that diseases follow the SIS dynamics. The key epidemiology variables are the contact rate, \(\alpha \), i.e., the average number of adequate contacts of a person to catch the disease per unit time and \(\gamma \), the recovery rate from the disease. The SIS model is discussed in detail in “Appendix 1.” Each household is assumed to be sufficiently large so that the proportion of the household in each disease status is identical to the corresponding population proportion. Thus, within a household, the proportion of healthy individuals is s and the proportion of infected individuals is \(1-s\). Each household understands and anticipates how the disease evolves and is fully forward-looking with regard to its possible future states as well as its present situation. However, following Gersovitz and Hammer (2004) the household considers itself small relative to the population and believes that the disease status within the household does not affect the proportion of infectives in the entire population. In particular, the household takes as given the proportion of the population that is infected, denoted as \(\varPi \), and thinks the probability for the healthy individuals to contract disease is \(\alpha \varPi \), rather than \(\alpha (1-s)\). As a result, the disease transmission dynamics perceived by the households is now given as follows:
This captures the idea that the household is small relative to the population and does not take into account the externality on disease transmission. It is competitive “disease taking” looking only at private benefits/costs and not social benefits/costs. This distinguishes the competitive model from the social planner’s problem where this externality is taken into account. The two different formulations also help distinguish between private health (where the externality is ignored) and optimal public health expenditure (where it is internalized).
There is a two-way interaction between the economy and the disease. On the one hand, diseases have direct adverse effects on the economy by reducing the labor force participation. Being infected with a disease affects the productivity of an individual. We make the simplifying assumption that an infected individual is incapacitated by the disease or that the productivity falls to zero. That is, the infected are unable to work or accumulate human capital.Footnote 13 We assume the labor is supplied inelastically.Footnote 14 For each household, labor supply L is given by the proportion of the healthy individuals, and its dynamics inherits the dynamics of s:
Households take the interest rate R and wage W as given, rent out physical capital K and choose the fraction of time to spend in work, \(u \in [0,1]\), and in accumulating human capital, \((1-u)\). Thus, they provide effective labor supply eLu, where e is the average human capital. The income is either consumed C, invested in physical capital \(I_K\) or health capital \(I_H\). Thus, the budget constraint is:
We further assume there is full insurance within each household and all individuals have the same consumption irrespective of their health status. This is indeed optimal, if the household welfare aggregator is concave. The representative household’s preferences are given as:
where \(\rho \) is the discount factor with \(\rho > b-d\), and the initial size of household is assumed to be one. For analytical convenience, we assume the felicity function to take the following form: \(u(C) = \log (C)\).Footnote 15
Health and physical capital accumulations follow the standard laws of motion with the deprecation rate \(\delta \):Footnote 16
The law of motion for human capital is given as:
where \(\psi \) is the effectiveness of human capital accumulation. The linearity in the above equation, i.e., non-diminishing returns on human capital accumulation, implies human capital is the engine of economic growth. Unlike the standard endogenous growth model (Lucas 1988), here it depends on the effective time spent in accumulation human capital \(L(1-u)\), and both the components L and u are affected by the severity of disease prevalence but in different ways, with the former a state variable and the latter a control variable, which will be important.
Contact rate, \(\alpha \) In this paper, we concentrate on preventive expenditures for controlling the infectivity of the disease via the contact rate \(\alpha \).Footnote 17 We assume \(\alpha \) is a function of two state variables: health capital H and physical capital K, that is, \(\alpha (H, K)\).Footnote 18 An increase in health capital, H, reduces infectivity of the diseases by improving protection to infections, both physically and by strengthening the immune system.
The effects of physical capital on the infectivity of the diseases are more complex. On the one hand, an increase in physical capital, K, can reduce the infectivity (i.e., a negative effect): Countries with high physical capital also have better infrastructure, especially sanitation which is important in controlling transmission of waterborne diseases. On the other hand, higher physical capital can also lead to higher infectivity (i.e., a positive effect) as shown by the epidemiological evidence. Higher physical capital means more stress from increased economic activity which impairs immunity and increases susceptibility to infectious diseasesFootnote 19; pollutionFootnote 20; increased hyper-hygienic environments which may reduce exposure to viruses in childhood leading to greater illnesses later in lifeFootnote 21; increased economic activity that can increase exposure to diseasesFootnote 22; and urbanization, migration and trade which can lead to new pathways for spread of diseasesFootnote 23. Bosi and Desmarchelier (2018) in a recent paperFootnote 24 also model physical capital as increasing infectivity.
We disentangle these two effects by explicitly modeling the negative effects as coming through investments that reduce infectivity—what is accumulated as health capital, and the positive effects depending on physical capital. We, thus, take health capital to include all investments that reduce infectivity, such as improved sanitation.Footnote 25
As motivated by the empirical facts in the previous section, we want to model the coexistence of multiple balanced growth paths. Given L lies in the interval [0, 1], Eq. 2 implies that in a BGP to have a constant L, the contact rate \(\alpha \) is also constant. As both H and K increase along the BGP, the function \(\alpha (H,K)\) has to be homogeneous of degree zero. Thus, we rewrite the function \(\alpha (H,K) = \alpha (\frac{H}{K},1)\). Defining \(q = \displaystyle \frac{H}{K}\) as the effective health capital, we thus assume the contact rate \(\alpha \) to be a decreasing function of q.
Assumption 1
Define the effective health capital \(q := \frac{H}{K}\). The contact rate \(\alpha (q)\) is a \(C^2\) function:
- 1.
\(\alpha '< 0\), \(\alpha ''> 0\) and \(\lim _{q \rightarrow 0} \alpha ' \rightarrow -\infty \), \(\lim _{q \rightarrow \infty } \alpha ' \rightarrow 0\);
- 2.
Let \({\overline{\alpha }}\) and \(\underline{\alpha }\) be the upper and lower bound, respectively.
$$\begin{aligned} \frac{b+\gamma }{{\overline{\alpha }}}< \frac{\rho -b+d}{\psi }< \frac{b+\gamma }{\underline{\alpha }}<1. \end{aligned}$$
The first assumption implies that contact rate is decreasing and concave in the effective health capital. The Inada condition is not necessary for the analysis, but in its absence there can be another equilibrium where the disease is prevalent but there are no positive health expenditures, which we want to rule out here.Footnote 26 Eradication of endemic diseases is difficult, and smallpox is the only infectious disease to have been eradicated. It was largely due to a long-run coordinated vaccination program involving WHO and international campaigns. In the absence of sustained public efforts, diseases that were previously controlled can re-emerge as in the case of leprosy in India (Gokhale 2013) and measles in the western countries. Most SIS diseases are also not amenable to effective vaccination strategies making their eradication problematic. Thus, we assume \( \frac{b+\gamma }{\underline{\alpha }}<1\), which implies an endemic disease cannot be eradicated by private health expenditures alone, and the disease-free steady state is unstable. The assumption \(\frac{b+\gamma }{{\overline{\alpha }}}< \frac{\rho -b+d}{\psi } < \frac{b+\gamma }{\underline{\alpha }}\) ensures that controlling diseases is relevant for the growth of a country. For countries afflicted by infectious diseases, when \( \frac{\rho -b+d}{\psi } \le \frac{b+\gamma }{{\overline{\alpha }}} \), all of them have a positive economic growth rate, and when \(\frac{\rho -b+d}{\psi } \ge \frac{b+\gamma }{\underline{\alpha }}\), all of them are in the poverty trap, regardless of whether they control the diseases or not. Thus, to have an interesting economic problem, we assume \(\frac{b+\gamma }{{\overline{\alpha }}}< \frac{\rho -b+d}{\psi } < \frac{b+\gamma }{\underline{\alpha }}\). This will become clearer in the following analysis.
Firms There are many perfectly competitive firms that maximize profit by choosing physical capital and effective labor as inputs. We assume the Cobb–Douglas production function \(Y = A K^\beta (e L u)^{1-\beta }\), where A is the total factor productivity and \(\beta \in (0, 1)\) is the capital share. Thus, we have:
Competitive equilibrium A competitive equilibrium is a feasible allocation \(\{C, K, H, I_K, I_H, L, u, e\}\) and a price system \(\{R,W\}\) such that, given prices:
- 1.
Households maximize Eq. (4) by choosing consumption C, health expenditure \(I_H\), physical capital investment \(I_K\) and time allocation u, subject to the constraints Eqs. (2)–(3), (5)–(7), and \(0\le u \le 1\), \(0\le L \le 1\), \(I_H \ge 0\), with \(e_0, K_0, H_0, L_0\) given;
- 2.
- 3.
The capital market, labor market and goods market clear;
- 4.
Since each household is representative of the population, in equilibrium
$$\begin{aligned} \varPi= & {} 1-L. \end{aligned}$$(10)
4 Competitive equilibria
In this section, we analyze the competitive equilibrium balanced growth paths (BGPs). The current value Hamiltonian for the household’s optimization problem is:
where \(\lambda _1, \lambda _2, \lambda _3\) and \(\lambda _4\) are costate variables or shadow value of increments to physical capital, health capital, human capital and labor supply, respectively. \(\theta _1, \theta _2\) and \(\theta _3\) are the Lagrange multipliers for the inequality constraints.Footnote 27
On the margin, goods must be equally valuable in their use as consumption, physical capital investment and health expenditure:
and labor time must be equally valuable in either production or human capital accumulation:
The changes of shadow values satisfy the following conditions:
Thus, the competitive equilibrium is described by Eqs. (2)–(3), (5)–(7), (8)–(10) and (11)–(16), along with the TVCs.Footnote 28
From the epidemiology dynamics, there are two types of BGPs. The first is the disease-free case with \(L^*=1\), where infectious diseases are eradicated, and all individuals are healthy and working. The second is the disease-endemic case with \(L^* =\displaystyle \frac{b+\gamma }{\alpha (q^*)} < 1\), where infectious diseases are prevalent, and a fraction of individuals are infected and unable to work. These two cases mirror the two steady states in the pure SIS epidemiology model. The difference is that here households can influence disease transmission through choices on health expenditures which are in themselves determined endogenously.
Since for the disease-endemic case labor is a function of effective health capital, for easy exposition, in a BGP, we define the continuous function L(q) such that
which is increasing in q. We further define the unique critical value \({\hat{q}}\) such that
Proposition 1
There exists both a disease-free BGP and a disease-endemic BGP.
- 1.
There exists a disease-free BGP with \(L^* = 1\), \(u^* = \frac{\rho -b+d}{\psi }\), and growth rate \(g = \psi - (\rho -b+d)\);
- 2.
There exists a disease-endemic case with \(L^* = L(q^*)\).
- (a)
If \(L^* > \frac{\rho - b + d}{\psi } \) or \(q^* > {\hat{q}}\), there exists a disease-endemic BGP, with \(u^* = \frac{\rho -b+d}{\psi L^* }\) and \(g = \psi L^* -(\rho -b+d)\);
- (b)
If \(L^* \le \frac{\rho -b+d}{\psi }\) or \(q^* \le {\hat{q}}\), there exists a disease-endemic poverty trap, with \(u^* = 1\) and \(g=0\).
Moreover, the effective health capital \(q^*\) is determined by the equation
$$\begin{aligned} G(q^*) = \max \{G_L(q), G_R(q)\} = 0, \end{aligned}$$where
$$\begin{aligned} G_L(q)= & {} -\frac{1-\beta }{\beta }\alpha '(q)(1-L(q))(1+q) -\alpha (q) -(\rho -b+d), \quad \text {and} \\ G_R(q)= & {} -\frac{1-\beta }{\beta }\alpha '(q)(1-L(q))(1+q)\frac{\psi L(q)}{\rho -b+d} -\alpha (q) -(\rho -b+d). \end{aligned}$$ - (a)
Proof
See “Appendix 2.” \(\square \)
\(G_L\) is the net marginal value of labor when there is no human capital accumulation, and \(G_R\) is the net marginal value of labor when there is human capital accumulation. Both are functions of effective health capital, q. As the choice of human capital accumulation is endogenous, for any q the higher of the two will be chosen. The equilibrium effective health capital \(q^*\) is determined when the upper contour of the two is equal to zero (see below).
In the disease-free case, infectious diseases are completely eradicated, and thus health expenditure for controlling diseases is zero. The maximization problem degenerates to the standard Lucas (Lucas 1988) model, where countries undergo positive growth path if the effectiveness of human capital accumulation is larger than the effective discount rate, that is, \(\psi > \rho -b+d.\)
The intuition for the determinants of economic growth when diseases are endemic is similar to the disease-free case. Human capital accumulation is the driving force for growth, which depends on the relative magnitude of marginal value of time use in education and production. Assuming all the time is allocated for production and the growth rate is zero, the marginal value of additional du unit of time in education is \(\lambda _3 \psi e L \hbox {d}u\), and the marginal cost is the value associated with loss in production, \(\lambda _1 (1-\beta )A K^\beta (eL)^{1-\beta } \hbox {d}u\). Therefore, more time is devoted to education if the former is larger than the latter. By \({\dot{\lambda }}_3=0\) as the growth rate is assumed to be zero, we have \(\lambda _3 (\rho -b+d) = \lambda _1 (1-\beta )A K^{\beta }(eL)^{-\beta } L\), and thus there is a positive growth only if
This implies that when the effectiveness of human capital accumulation, now proportional to the labor supply, is larger than the effective discount rate, the country undergoes positive growth path. Compared with the disease-free case, here marginal value of time use in education depends on the proportion of healthy individuals in a household. As a result, higher disease prevalence reduces the effectiveness of human capital accumulation, and more time is allocated for production rather than education, and there is slower growth. In the extreme case, all the time is allocated for production and there is a poverty trap.
Whether countries undergo growth or are in a poverty trap is directly linked to the severity of disease prevalence, which itself is endogenously determined by the effective health capital. We now look at how the effective health capital, \(q^*\), is determined. When infectious diseases are endemic, health expenditure is strictly positive, and we have \(\lambda _1 = \lambda _2\) and
by combining Eqs. (13) and (14). It implies that the marginal value of physical capital investment equals the marginal value of health expenditure. We further show that along the BGPs, consumption, physical, health and human capital all grow at the same rate \(g=\psi L(1-u)\), and \(\frac{{\dot{\lambda }}_1}{\lambda _1} = \frac{{\dot{\lambda }}_3}{\lambda _3} = -g\), \(\frac{{\dot{\lambda }}_4}{\lambda _4} = 0\). Through some manipulations, Eq. (15) is given as:
that is, the marginal value of human capital, consisting of its contribution to both human capital accumulation and production, equals the marginal cost. Similarly, Eq. (16) becomes:
that is, the marginal value of labor supply, consisting of its contribution to production, evolution of labor force participation and human capital accumulation, equals the marginal cost. Divide both sides of the above equation by \(\lambda _4\), substitute into Eqs. (17) and (18), and we have:
which is a function of both the effective health capital q and the fraction of time allocated for production u. Hence, Eq. (20) along with Eq. (12) determines the equilibrium \(q^*\) and \(u^*\).
There are two cases: In the poverty trap with \(u^*=1\), Eq. (20) simplifies to \(G_L(q) = 0\), suggesting that \(q^*\) is chosen such that marginal cost of labor is equal to its marginal value, consisting of the first two terms in the LHS of Eq. (20). Because there is no economic growth, the third term disappears. This case exists only if \(\psi L^* \le \rho -b+d\) or \(q^*\le {\hat{q}}\). The other case is a positive economic growth path with \(u^* = \frac{\rho -b+d}{\psi L^*}\) and \(g=\psi L^* - (\rho -b+d)\). \(q^*\) is determined by the equation \(G_R(q) = 0\), derived by substituting \(u^*\) into Eq. (20). This case exists only if \(\psi L^* > \rho -b+d\) or \(q^*> {\hat{q}}\). Moreover, \(G_L(q) > G_R(q)\) if \(q<{\hat{q}}\), \(G_L(q) < G_R(q)\) if \(q>{\hat{q}}\), and \(G_L(q) = G_R(q)\) if \(q={\hat{q}}\). Combining the two cases, \(q^*\) is determined by the upper contour of the functions \(G_L\) and \(G_R\). That is, it is determined by the function \(G(q) = \max \{G_L(q), G_R(q)\}=0\). Since the function G is continuous, \(\lim _{q \rightarrow 0} G = +\infty \) and \(\lim _{q \rightarrow \infty } G <0\), by the intermediate value theorem, there exists a \(q^*>0\) such that \(G(q) = 0\), that is, there exists an endemic disease case.
Furthermore, the following lemma guarantees the uniqueness of \(q^*\).
Lemma 1
If \(\alpha ''(q)\) is large enough,Footnote 29 the function G(q) is monotonically decreasing, and there exists a unique \(q^*\) such that \(G(q)= 0\). If \(q^* \le {\hat{q}}\), it is a disease-endemic poverty trap; if \(q^* > {\hat{q}}\), it is a disease-endemic BGP.
Proof
See “Appendix 2.” \(\square \)
The condition on \(\alpha ''(q)\) requires that the contact rate does not decrease too fast in effective health. If the condition does not hold, then there could be multiple q’s and hence balance growth paths, for a given economy. This is consistent with the epidemiology evidence that it is extremely difficult to eradicate diseases; that even though there is very high expenditure on controlling a disease, it is very difficult to prevent re-emergence (see the discussion of the Garki project in Gallup and Sachs (2001); and that for some diseases which are largely controlled, there may be even higher expenditure needed to reduce the incidence as individuals do not naturally develop the antibodies that confer immunity from exposure to the disease.Footnote 30
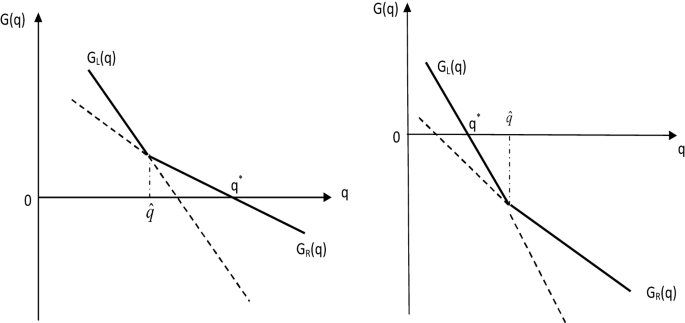
Determination of equilibrium effective health capital: disease-endemic BGP (left panel) and disease-endemic poverty trap (right panel). Note The figure describes the two scenarios in the disease-endemic case. It depicts the function G(q)—the upper contour of the functions \(G_L(q)\) and \(G_R(q)\), which determines the equilibrium effective health capital \(q^*\). If \(q^*\) is greater than the critical value \({\hat{q}}\), countries grow at a positive rate with disease endemic, shown in the left panel; and if \(q^*\) is less than the critical value \({\hat{q}}\), countries are stuck in a poverty trap with disease endemic, shown in the right panel
Figure 1 describes the two scenarios under the disease-endemic case. In both panels, the functions \(G_L(q)\) and \(G_R(q)\) are monotonically decreasing in q and intersect at the point \({\hat{q}}\). The function G(q) is given by the upper contour of both functions. The left panel gives the disease-endemic BGP with \(q^*>{\hat{q}}\), and the right panel gives the disease-endemic poverty trap with \(q^*<{\hat{q}}\). This suggests that whether there is positive or zero economic growth depends on the function G(q), which in turn depends on all the economic, demographic and epidemiological parameters.
Proposition 2
When infectious diseases are endemic, countries are more likely to undergo a positive economic growth path, if:
- 1.
Capital share, \(\beta \), is smaller;
- 2.
Households are more patient, i.e., \(\rho \) is smaller;
- 3.
Death rate, d, is lower or life expectancy increases;
- 4.
Effectiveness of human capital accumulation, \(\psi \), is higher.
Proof
See “Appendix 2.” \(\square \)
When labor becomes more important in production, that is, capital share is smaller, households care more about labor force participation rate and spend more on health expenditure. When households becomes more patient, they are more willing to postpone consumption and invest more in health capital. As result of this, labor force participation rate increases and hence countries are more likely to be in a growth path. When effectiveness of human capital accumulation is higher, it is more profitable to spend time in investing human capital rather than production, and the possibility of taking off increases. Nevertheless, the effects of changing the birth rate and recovery rate are ambiguous. On the one hand, due to the assumption that all newborns are healthy, higher birth rate is beneficial for controlling diseases (as is a higher recovery rate). On the other hand, when diseases are not severe and the fraction of the infected is low, there is less chance for the healthy individuals to catch diseases, which lowers the incentive for diseases control and hence reduces the health expenditure. The different deep parameters in the model reinforce the different capital choices and hence of growth. For the poorest countries, the constellation of parameters seems to work in the same direction to reduce the possibility of growth.
The following lemma details the resource allocation for each type of countries.
Proposition 3
The resources are allocated as follows:
- 1.
For countries in a disease-free BGP, the saving rate is \(\beta \left( 1-\frac{\rho -b+d}{\psi + b-d + \delta }\right) \);
- 2.
For countries in a disease-endemic BGP, the saving rate is \(\beta \left( 1-\frac{\rho -b+d}{\psi L^*+ b-d + \delta }\right) \), of which \(\frac{q^*}{1+q^*}\) fraction is invested in health expenditure;
- 3.
For countries in a disease-endemic poverty trap, the saving rate is \(\beta \left( 1-\frac{\rho -b+d}{\rho + \delta }\right) \), of which \(\frac{q^*}{1+q^*}\) fraction is invested in health expenditure.
Proof
See the “Appendix A.2.” \(\square \)
Since \(\psi +b-d+\delta> \psi L^* +b-d+\delta > \rho +\delta \), Proposition 3 implies that countries in a disease-free BGP in fact have the highest saving rate and countries in a disease-endemic poverty trap have the lowest saving rate. For the countries with diseases eradicated, all the savings are invested in physical capital as infectious diseases are eradicated and there is no need to spend resources in combating infectious diseases.Footnote 31 For the countries afflicted by infectious diseases, the rate of investment in health capital is \(\frac{I_H}{Y}= \frac{q^*}{1+q^*}\left( \beta \left( 1-\frac{\rho -b+d}{\psi L^*+ b-d + \delta }\right) \right) \), and the remaining fraction, \(\frac{1}{1+q^*}\) is invested in physical capital. Thus, disease-endemic countries that are growing faster (higher \(q^*\), see Proposition 1) will not only have a higher savings rate but also a larger share of it will be spent on controlling the diseases. Countries in a poverty trap will have the lowest savings rate and also the lowest expenditure on disease control. Proposition 3 highlights how the savings rate and investment rates in physical and health capital changes with disease incidence within and across different balanced growth paths, and thus, models with fixed rates miss a very important aspect of general equilibrium dynamics.
To sum up, as the result of the introduction of SIS epidemiological model, there are multiple competitive equilibria, in which infectious diseases are either be eradicated or are endemic. In the disease-free case, countries grow at a fast rate,Footnote 32 while in the disease-endemic case, countries either grow at a slow rate or are in a poverty trap, depending on the investment in human capital accumulation—the engine of economic growth, which is affected by the severity of disease prevalence. Therefore, countries with lower disease prevalence are more likely to invest in human capital, and hence be in a economic growth path. The intuition is that as the incidence of disease prevalence goes down, households expect a larger proportion to be healthy which increases the rate of return on human capital accumulation. This has the natural effect of increasing its accumulation. As disease incidence and human capital simultaneously affect each other, increase human capital increases incentives to control diseases. It implies that projections of the economic burden of disease which largely focus on lost productivity and cost of treatment are going to underestimate the cost as they do not account for the changed incentives for human capital accumulation and thus not account for the change in the growth rate.
5 Optimal public health policy
In this section, we examine the centralized economy and characterize the optimal public health policy where a social planner takes into account the effect of controlling diseases at the household level on the aggregate disease dynamics. We then characterize the subsidy that decentralizes this outcome.
5.1 Centralized economy
The centralized economy differs from the decentralized one as the social planner takes into account that the intervention can effectively control the proportion of the infected in total population. Recall that in the decentralized economy household takes the proportion of the infected in total population as fixed, shown in Eq. (2). The social planner’s maximization problem is essentially similar to the one we considered above with the only difference being in the law of motion for labor force participation, which is now given by the true dynamics:
In the following analysis, the superscript c is used in denoting variables in the centralized economy.
Proposition 4
In the centralized economy,
- 1.
There exists a disease-free BGP with the growth rate \(g^c = \psi - (\rho -b+d)\);
- 2.
There exists a disease-endemic case with \(L^{*,c} = L(q^{*,c})\).
- (a)
If \(L^{*,c} > \frac{\rho - b + d}{\psi } \) or \(q^{*,c} > {\hat{q}}\), it is a BGP with \(u^{*,c} = \frac{\rho -b+d}{\psi L^{*,c} },\) and \(g^c = \psi L^{*,c} -(\rho -b+d)\);
- (b)
If \(L^{*,c} \le \frac{\rho -b+d}{\psi }\) or \(q^{*,c} \le {\hat{q}}\), it is a poverty trap.
Moreover, the effective health capital \(q^{*,c}\) is determined by the equation
$$\begin{aligned} G(q) + b+\gamma = 0. \end{aligned}$$ - (a)
Proof
The proof is similar to the proof of Proposition 1. \(\square \)
Similar to the decentralized case, there always exists a disease-free balance growth path. Since the social planner and the households only differ in how they view the impact of their behavior on the disease transmission, there is no difference between the optimal growth path and competitive equilibrium path when diseases are eradicated.
There also exists a disease-endemic case. The effective health capital is optimally chosen according to:
The right-hand side of the above equation is marginal cost of labor supply and the left-hand side is marginal value of labor supply, consisting of its contribution to production, the evolution of labor force participation and human capital accumulation. Compared with Eq. (19), since the social planner takes into account the positive externality of disease control, the marginal value of labor is always higher in the centralized than the decentralized economy, exactly by the amount \(\lambda _4 \alpha (q)L\) or \(\lambda _4 (b+\gamma )\). Thus, in the centralized economy, the effective health capital \(q^{*,c}\) is determined by the equation \(G(q)+b+\gamma =0\), which is higher in the centralized economy than the decentralized one. It suggests that infectious diseases are better controlled in the centralized economy and the labor force participation rate is higher. Thus, with an effective public health policy, it is more likely that countries can escape the poverty trap or grow at a faster rate.
Note that in the planning problem the planner is choosing the optimal sequence given the feasibility conditions—which include the laws of motion of the state variables. As in the decentralized case, depending on the parameters, due to the non-convexity in disease dynamics there is either only a disease-free balanced growth path (that is locally stable) or the disease-free and disease-endemic balanced growth paths coexist. In the second situation, the disease-free balanced growth path is locally unstable and the disease-endemic one is locally stable. Thus, the situation where both these coexist and are both locally stable never arises. If the parameters are such that they permit a disease-endemic balanced growth path, as the disease-free balanced growth path is locally unstable, there is no continuous path to eradicate the disease.Footnote 33 Hence, it is also not feasible for the planner to entirely eliminate the diseases in the model.
To be more specific, Fig. 2 describes three different scenarios for the comparison between the decentralized and centralized economies. In all the panels, the solid line is the function G(q), determining the effective health capital \(q^{*}\) in the decentralized economy, and the dashed line is the function \(G(q)+b+\gamma \), determining the effective health capital \(q^{*,c}\) in the centralized economy. The critical value \({\hat{q}}\) for the positive growth is the same in both economies. In the upper panel, the country is in a positive balanced growth path with the decentralized economy, while it grows at a faster rate with the centralized economy. That is, \(q^{*,c}>q^{*}>{\hat{q}}, \quad L^{*,c}>L^{*}>\frac{\rho -b+d}{\psi } \quad \text {and} \quad g^c>g>0\). In this case, the saving rates in both economies are given as \(\beta (1-\frac{\rho -b+d}{\psi L+ b-d + \delta })\), of which the \(\frac{q}{1+q}\) is invested in health expenditure. Notice these are increasing functions of labor supply. Thus, the centralized economy has a higher saving rate and investment rate for health expenditure, is better in controlling infectious diseases (lower \(\alpha (q)\)), and hence, grows at a faster rate.
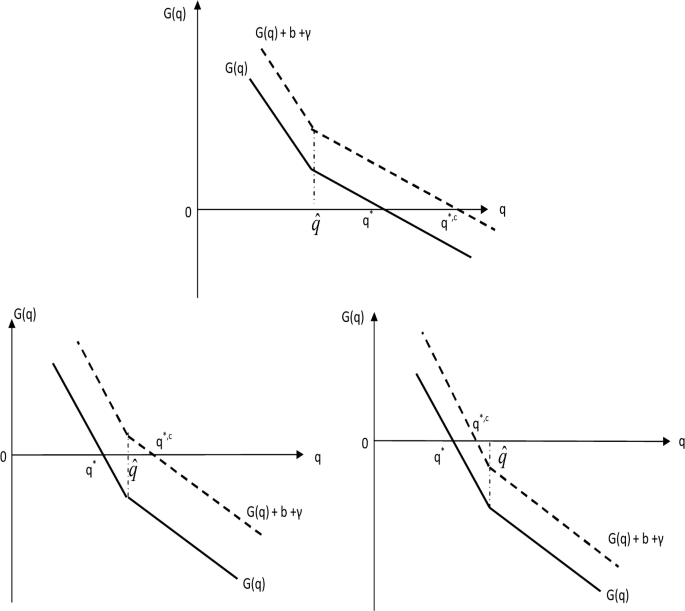
Determination of the equilibrium effective health capital: the comparison between the competitive equilibria and optimal paths. Note The figure describes three different scenarios for the comparison between the decentralized and centralized economies. In all the panels, the solid line is the function G(q), determining the effective health capital \(q^{*}\) in the decentralized economy, and the dashed line is the function \(G(q)+b+\gamma \), determining the effective health capital \(q^{*,c}\) in the centralized economy. The critical value \({\hat{q}}\) for the positive growth is the same in both economies. In the upper panel, we have \(q^{*,c}>q^{*}>{\hat{q}}\) and both the decentralized and centralized economies grow at a positive rate; in the bottom left panel, we have \(q^{*,c}>{\hat{q}}>q^{*}\) and the centralized economies grow at a positive rate, while the decentralized economy is in a poverty trap; in the bottom right panel, we have \({\hat{q}}>q^{*,c}>q^{*}\) and both the centralized and decentralized economies are stuck in a poverty trap
In the bottom left panel, the decentralized economy is in a poverty trap, while the centralized economy is in a positive growth path. That is, \(q^{*,c}>{\hat{q}}\ge q^{*}, \quad L^{*,c}>\frac{\rho -b+d}{\psi }\ge L^{*} \quad \text {and} \quad g^c>g=0\). In this case, because individuals fail to take into account the positive externality of disease control, the economy is stuck in the poverty trap, which otherwise would have taken off in a centralized economy. The saving rate in the centralized economy is given as \(\beta (1-\frac{\rho -b+d}{\psi L^{*,c}+ b-d + \delta })\), while in the decentralized economy, it is given as \(\beta (1-\frac{\rho -b+d}{\rho + \delta })\). Since \(\psi L^{*,c}+ b-d + \delta >\rho + \delta \), the saving rate is higher in the centralized economy, more resources are allocated for controlling infectious diseases, and hence the country escapes the poverty trap.
In the bottom right panel, both the centralized and decentralized economies are in the poverty trap, but the centralized economy has larger proportion of healthy individuals than the decentralized one, as in the centralized economy the effective capital is always higher than in the decentralized one where the disease externality is ignored by households, that is, \({\hat{q}}\ge q^{*,c}>q^{*}, \quad \frac{\rho -b+d}{\psi }\ge L^{*,c} > L^{*} \quad \text {and} \quad g^c=g=0\). The saving rates in both economies are given as \(\beta (1-\frac{\rho -b+d}{\rho + \delta })\), of which fraction \(\frac{q}{1+q}\) is invested for controlling infectious diseases. Thus, both economies share the same saving rate, of which centralized economy spends more in health expenditure than the decentralized ones. The prevalence of infectious diseases is less severe in the centralized economy. However, the effectiveness of human capital accumulation is still not large enough for justifying its time allocation, and hence, there is no economic growth. In this case, the welfare comparison between two economies is ambiguous. The output and consumption in both economies are given as:Footnote 34
depending on \(q^{*,j}\), where \(j=c\) for the centralized economy and \(j=nil.\) for the decentralized economy. Even though labor force participation rate is higher in the centralized economy, which increases the production, the investment in physical capital is less compared with to decentralized ones, which tends to lower production. However, we see that \(\displaystyle \frac{\partial Y^*}{\partial q} > 0\) when \(-\displaystyle \frac{\alpha '}{\alpha }(1+q) > \displaystyle \frac{\beta }{1-\beta }\).Footnote 35 The condition can be interpreted as the semi-elasticity of \(\alpha \) is high enough, that is the higher q brings down the contact rate fast enough to counteract the effect of having a smaller portion of savings being devoted to physical capital in a centralized economy. This is confirmed for a calibrated economy in Section 6.4; see also Figure 5 where output and consumption-equivalent welfare are in fact higher in the centralized economy.
5.2 Optimal health subsidy
Compared with the decentralized economy, the centralized economy, taking into account the positive externality of controlling infectious diseases, either has a higher growth rate or is more likely to take off, and has a higher consumption level even in a poverty trap. This provides a justification for introducing effective public health policy. One of the issues with infectious diseases is that households do not account for the effect of their actions on the transmission of the disease. The evidence indicates that households seem to underinvest in preventive health care (e.g., Banerjee and Duflo 2011 who discuss preventive health care in general and Tarozzi et al. 2009 who focus on the use of insecticide-treated bed nets for prevention of malaria). What is the nature of the subsidy that will induce households to internalize preventive health expenditures? This is especially important as countries that are most afflicted with infectious diseases have weak public health delivery mechanisms. While external aid is often discussed in the context of controlling diseases, whether it is actually delivered for the specific need is an open question. There are of course international health organizations (e.g., WHO) and NGOs (e.g., Carter Foundation that has worked for eradication of Guinea Worm in sub-Saharan Africa, Gates Foundation, and the earlier Rockefeller Foundation that played a key role of eradication of hookworm in southern USA (Bleakley 2007). However, a market solution via balanced (self-financing) public health policy is more sustainable. Here, we focus on health subsidies. In fact, any policy distorting marginal benefit of physical capital investment and health expenditure can be equally effective in obtaining the optimal path under the centralized economy, for instance, proportionate capital income tax, educational subsidy, etc. However, these are harder to motivate as the effect appears indirect. Also note that the disease-free steady state is locally unstable and thus, while external aid that does not change the inherent disease dynamics (untied or lump-sum aid) may help control diseases, the outcome is not stable. If the aid is targeted to change the relative cost of health expenditure (i.e., act like a subsidy), then the following exercise also applies except it need not be self-financing. The health subsidy can be interpreted in several ways: directly as a subsidy for preventive health expenditures, but also as vaccination schemes or the cost of isolating infective individuals (see Goenka and Liu 2012 where the latter two are discussed further in detail).
We assume for each unit of private health investment, there is a proportional health subsidy \(\tau \), and the law of motion for health capital now is:
The public health expenditure is financed through a lump-sum tax T, and the budget constraint is:
Households maximize Eq. (4) by choosing consumption C, health expenditure \(I_H\), physical capital investment \(I_K\) and time allocation u, subject to the constraints Eqs. (2), (5), (7), (22) and (23). In equilibrium, the period-by-period balance budget (balancedness) implies \(T=\tau I_H\).Footnote 36 The rest is the same as the competitive equilibrium, defined in Sect. 3.
We solve the maximization problem, and the first-order conditions are similar to Eqs. (11)–(16). The only difference is Eq. (11) with positive health expenditure which is now given as:
We see that because there is the additional \(\tau \) unit health subsidy for each unit of private health expenditure, marginal value of physical capital investment (the LHS of the above equation) is equal to \((1+\tau )\) times marginal value of private health expenditure (the RHS of the above equation).
The following proposition gives the optimal subsidy, in the sense that it is chosen such that the allocations in the decentralized economy with public health subsidy coincide with the optimal path in the centralized economy.
Proposition 5
Let \(q^{*,c}\) be the optimal effective health capital in the centralized economy, defined in Proposition 4
- 1.
When the optimal path is a disease-endemic BGP with \(g=\psi L(q^{*,c}) - (\rho -b+d)\), the optimal health subsidy is:
$$\begin{aligned} \tau = \frac{(1+q^{*,c}) (b+\gamma )}{\alpha (q^{*,c})-(b+\gamma )+\rho -b+d} \cdot \frac{\rho +\delta +g}{\rho +\delta -(1+q^{*,c})\frac{b+\gamma }{\alpha (q^{*,c})-(b+\gamma )+\rho -b+d}g};\!\!\!\!\!\nonumber \\ \end{aligned}$$(24) - 2.
When the optimal path is a disease-endemic poverty trap, the optimal health subsidy is:
$$\begin{aligned} \tau = \frac{(1+q^{*,c}) (b+\gamma )}{\alpha (q^{*,c})-(b+\gamma )+\rho -b+d}. \end{aligned}$$(25)
Proof
See “Appendix 3.” \(\square \)
We can see that the optimal subsidy is proportional to the externality \(b+\gamma \), and the larger the externality the larger the subsidy. In addition, the faster the economy grows, the larger is the subsidy. From Eq. (24), we see in the first fraction, the numerator will be larger (larger \(q^{*,c}\)) and denominator smaller (smaller \(\alpha (q^{*,c})\)), and the second fraction is always greater than one. Comparing (24) and (25), we see that in the latter, not only is \(q^{*,c}\) smaller and \(\alpha (q^{*,c})\) larger, but also the second fraction is equal to one. Thus, there is the perverse effect where if an economy is in a poverty trap in the centralized solution the optimal subsidy will be smaller than in an economy which is growing. Thus, countries that are most afflicted by diseases may have the least incentive to control them. The reason is that when it is worthwhile accumulating human capital, due to the additional return from human capital, the effective health capital, q, is also higher. This induces a larger public health subsidy.
6 Calibrations and simulations
The marriage of the economic and epidemiological models provides us a framework in understanding the close link between the poverty and diseases. In this section, we calibrate the model for the LDCs in a poverty trap and examine the impact of increasing effectiveness of controlling diseases, i.e., a new preventive method, and an increase in life expectancy. We examine the difference between the competitive equilibrium where households do not take the disease externality into account and the optimal health policy that does. For the two different changes, we are able to get an estimate of how significant is this externality as we show how large the change has to be from the current situation for the economy to start growing, and how the different variables of interest evolve in the balanced growth path. The analysis here focuses on the evolution of the growth paths before and after the change, and the transitional dynamics are ignored due to the complicated dynamical system.Footnote 37
6.1 Calibration
Both the model and empirical evidence show that the growth paths of countries are closely related to the prevalence of infectious diseases. This in turn depends on all the fundamental economic, demographic and epidemiological parameters in the model. Thus, different sets of model parameters should be calibrated by targeting countries in different stages of growth paths. As we are interested in the close link between diseases and poverty and how countries can escape this vicious cycle, the calibration and simulation exercise are aimed for the LDCs mainly in Sub-Saharan African region.
The following parameters are chosen in line with the literature: discount rate \(\rho = 0.055\),Footnote 38 capital share \(\beta = 0.36\), depreciation rate \(\delta = 0.05\), and the scale parameter in the production function A is normalized to 1. Some economists believe that the capital share is typically higher in the LDCs, while others (e.g., Gollin 2002) show that the share is generally the same with the developed countries, taking into account self-employing sectors where income, accruing whether to labor or to capital, is in practice treated as capital income in previous inquiries. So we set capital share of the LDCs to be the relative upper bound of the estimates for the developed countries. Compared with the developed countries, both fertility rate and death rate are much higher in the Sub-Saharan Africa. Using the statistics from the World Health Organization (see The World Bank 2019), we set the birth rate \(b=3.5\%\) and death rate \(d=1.85\%\), which implies 55 years of life expectancy. We could not calibrate the effectiveness of human capital accumulation \(\psi \) directly for the LDCs, as the model equilibrium does not depend on it due to the poverty trap. Nevertheless, in the developed countries, the effectiveness of human capital accumulation is calibrated to be 0.05 (Lucas 1988). In the LDCs, human capital formation has received increasing attention with increased spending on education from both the national budgets and foreign aid, which has enabled them to narrow the gap in education, particularly in primary education. However, they are still behind in terms of the quality of the education and schooling. Thus, we assume conservatively that the effectiveness in the LDCs is roughly eighty percent of the one in the developed countries, and we set \(\psi = 0.04\).
In calibrating the disease-related parameters, some papers (e.g., Chakrabory et al. 2010) take a more micro-approach, that is, calibrating epidemiological parameters to transmission of a single infectious disease. We, on the other hand, take a macro-approach by targeting the key macroeconomic variables to get a more comprehensive view of the effect of infectious diseases on Sub-Saharan Africa. The calibration requires a specific functional form for contact rate. As far as we know, there are no papers on estimating what this function is likely to be. So we choose the functional form of contact rate \(\alpha (q) = q^{-0.5}/a\), where a is the effectiveness of controlling disease. It assumes contact rate is decreasing in effective health capital, and marginal benefit of controlling diseases decreases as effective health capital increases. This leaves us with two disease-related model parameters: the effectiveness of controlling disease, a, and the recovery rate, \(\gamma \). They are calibrated to match two key disease-related macro-variables. One is the years loss due to infectious diseases. The average DALY of the LDCs shown in Table 2 suggests that \(38.02\%\) of time is lost due to infectious diseases. Note that this number represents the loss from both mortality and morbidity from infectious diseases. Moreover, the statistics provided by the WHO including a wide array of countries indicate that roughly one-third of DALY is due to morbidity. This suggests in the LDCs, around \(14\%\) of time is lost due to morbidity from infectious diseases. The other macro-variable used for calibration is the health expenditure as a share of GDP in controlling infectious diseases. There is an extensive literature on health expenditure in the developed countries. However, evidence from developing countries is relatively scarce. Health care expenditure in the LDCs varies over time and across countries. On average, low-income countries spend around \(3\%\) of GDP on health, though increasing over years. This consists of government health expenditure, private out-of-pocket health expenditure and external aid. It is estimated that external aid is around 10–20% of total health expenditure, and government funding takes up the half of the rest of health expenditure (See Gottret and Schieber 2006; Xu et al. 2011). So we target the health expenditure ratio in a decentralized economy to be around \(1.5\%\) of GDP. This is likely to be the upper bound of private health expenditure ratio in the LDCs.

Evolution of growth paths due to increasing effectiveness of controlling diseases. Note The figure depicts the evolution of economic variables when the effectiveness of controlling diseases increases. The solid line presents the change for the decentralized economy, while the dashed line shows the change for the centralized economy. The variables included are labor supply (L), fraction of time allocated for human capital accumulation (\(1-u\)), growth rate (g), saving rate (S / Y), health expenditure ratio (\(I_H/Y\)) and optimal public health subsidy (\(\tau \))
6.2 Impact of increasing effectiveness of controlling diseases
In this subsection, we examine the impact of increasing effectiveness of controlling diseases in the LDCs by the parameter—a. An increase in a will reduce the contact rate \(\alpha \) for a given level of effective health capital, q. One interpretation for an increase in a is the discovery of more effective disease prevention methods, such as a new prophylaxis for malaria, or a more effective strategies to control schistosomiasis through more effective drugs and control of snail population (see Inobaya 2014). Figure 3 depicts the evolution of economic variables when a increases. The solid line presents the change for the decentralized economy, while the dashed line shows the change for the centralized economy. When a is at its initial level of 0.85, the proportion of health individuals or the effective labor supply is \(86\%\), and that of the health expenditure as a share of GDP is \(1.5\%\). These are directly the result of calibration. In addition to the low level of physical capital, indicating high marginal return to production, the prevalence of infectious diseases significantly reduces the marginal return to human capital accumulation. This implies all the time is allocated to production and none to human capital accumulation. The saving rate is around \(22.8\%\), lying in the reasonable range of saving rates in the LDCs, \(10\%\) to \(25\%\). The large portion of saving is used for investment of physical capital, rather than health capital. Thus, with lower effectiveness of controlling diseases, countries are in a poverty trap. In the decentralized case, when a increases from 0.85 to 2, which is a \(58\%\) decrease in the contact rate, a smaller portion of the saving is actually spent on health expenditure, but the effective labor supply increases substantially. The marginal benefit of human capital accumulation is still not large enough for justifying its time allocation, and hence there remains no economic growth. Nevertheless, all these start changing when a increases further above the critical value 2. Countries start investing in human capital accumulation and transit from a poverty trap to an equilibrium with positive economic growth. Therefore, with increasing effectiveness of controlling diseases, the LDCs can eventually escape the poverty trap.
When we compare the centralized economy with the decentralized ones, the interesting observations are the following. The first is that the introduction of an optimal public health policy does not necessarily guarantee economic growth. It can be seen that the centralized economy is also in a poverty trap when a is below 1.48. Secondly, when effectiveness of controlling diseases increases, the centralized economy starts taking off before the decentralized economy does, only a \(42\%\) decrease in the contact rate is needed. Thirdly, for the resource allocation, when both economies are in the poverty trap, the saving rates are in fact the same, though more is spent for health expenditure in the centralized economy. This is because of the fact that social planner takes into account the positive externality of controlling disease. Fourthly, when the economy grows in both the situations, the growth rate in the optimal path is double than that in the competitive economy. Lastly, the optimal health subsidy is strictly increasing. The reason is that the positive externality from controlling diseases becomes increasingly larger as a increases, due to the additional dividend from the growth.
6.3 Impact of rising life expectancy
In this subsection, we examine the effects of rising life expectancy. In the paper, we emphasize the interaction between disease transmission and human capital investment, instead of the interaction between disease transmission and demographics so as to focus on the role of morbidity. The examination of the effect of an increase in life expectancy gives us a glimpse of how the demographic transition affects the disease control, and hence, human capital investment and economic growth.
Figure 4 depicts the evolution of economic variables when mortality rate drops from 1.85 to \(1.25\%\), that is, life expectancy increases from 55 years to 80 years. In the decentralized case, when the mortality rate decreases from 1.85 to \(1.48\%\) or life expectancy increases from 55 to 67 years, households become more patient and save more. However, only a small portion of the increased saving is spent on health expenditure. This can be seen from the fact that saving rate increases by \(1.2\%\), while health expenditure ratio increases only by \(0.1\%\). As a result, the effective labor supply remains relatively the same with an indiscernible increase. The marginal benefit of human capital accumulation is still not large enough for justifying its time allocation, and hence, there remains no economic growth. Nevertheless, all these start changing when mortality rate drops further below the critical value \(1.48\%\) or life expectancy increases above 67 years. Households save even more. Moreover, the increment in saving rate as a result of rising life expectancy increases, which is shown by the increase of slope for the saving curve. Similarly, health expenditure ratio increases as well, which leads the effective labor supply to rise. There is also the relative change of the slope above and below the critical mortality rate, for both the health expenditure ratio and the effective labor supply in Fig. 4. Countries start investing in human capital accumulation and transit from a poverty trap to an equilibrium with positive economic growth. Therefore, with a prospect life expectancy increasing to 68.5 years by 2050, the LDCs can eventually escape the poverty trap.

Evolution of growth paths due to rising life expectancy. Note The figure depicts the evolution of economic variables when mortality rate drops from the initial level of 1.8 to \(1.2\%\). The solid line presents the change for the decentralized economy, while the dashed line shows the change for the centralized economy. The variables included are labor supply (L), fraction of time allocated for human capital accumulation (\(1-u\)), growth rate (g), saving rate (S / Y), health expenditure ratio (\(I_H/Y\)) and optimal public health subsidy (\(\tau \))
Similar to the previous subsection, when we compare the centralized economy with the decentralized ones, we find that the centralized economy does not necessarily guarantee economic growth; but when mortality rate declines to \(1.68\%\) or life expectancy increases to 59.5 years , the centralized economy starts growing before the decentralized economy does; when both economies are in the poverty trap, the saving rates are in fact the same, though more is spent for health expenditure in the centralized economy; the growth rate is double in the optimal path; and the optimal health subsidy is convex in shape. The reason is that the positive externality from controlling diseases becomes increasingly larger as life expectancy increases, due to the additional distortion from the growth. Thus, the fact that poor countries in a poverty trap have low public health expenditure is not only because they have tighter budget constraints, but more importantly they lack incentives for investing in health capital.

Welfare change due to rising life expectancy. Note The figure depicts the change of economic variables when mortality rate drops from the initial level of 1.85 to \(1.65\%\). That is, both centralized and decentralized economies are in a poverty trap. The solid line presents the change for the decentralized economy, while the dashed line shows the change for the centralized economy. The variables included are output, consumption and consumption-equivalence welfare, where the value is normalized such that it is 0 for the initial level of mortality rate \(1.85\%\) in the decentralized economy
As life expectancy increases, more health expenditure is allocated for controlling infectious diseases and labor force participation rate rises, which increase output and consumption level. However, on the other hand, as the result of direct effect of declining death rate, the consumption level decreases. The reason is that more people alive diffuse the resource allocation and lower consumption level for each individual. This is the so-called Malthusian effect. It is not clear in the model which effect dominates. One thing to note is that the Malthusian effect can take place only when a country is in a poverty trap. For the other situations, a decrease in the death rate or increase in life expectancy unambiguously increases growth through the mechanism of increased incentives for saving due to the decrease in the effective discount rate. Figure 5 depicts the percentage change of output, consumption and consumption-equivalence welfare change, when mortality rate drops from the initial level of \(1.85\%\) to \(1.68\%\), that is when both the centralized and decentralized economies are in a poverty trap. The solid line presents the change for the decentralized economy, while the dashed line shows the change for the centralized economy. The value is normalized such that it is 0 for the initial level of mortality rate \(1.85\%\) in the decentralized economy. Compared with the decentralized economy, output and consumption are much higher in the centralized economy, though both are in a poverty trap. As life expectancy rises, output increases slightly. However, due to Malthusian effect, consumption level declines. Does the household become worse off as pointed out by the Malthusian effect and what about the welfare change? Here, we calculate the consumption-equivalence welfare change, which incorporates the effects from the rising life expectancy, shown in the right panel.Footnote 39 When the death rate declines from \(1.85\%\) to \(1.65\%\), in the decentralized economy consumption increases by around \(1\%\), and in the centralize economy, consumption increases by around \(2\%\). The results suggest that the household is better off as the result of the rising life expectancy and the dilution effect is dominated by the fact that people now live longer.
7 Conclusions
This paper develops an endogenous growth model with human capital formation where the prevalence of an infectious disease causes ill health and incapacitates individuals from working as well as accumulating human capital. There is an endogenous choice of health expenditure to prevent infectious diseases. The paper focuses on the effects of morbidity (ill health) and thus chooses to use an infinitely lived agent framework. There are multiple balanced growth paths where the endogenous prevalence of the disease determines whether human capital is accumulated or not, i.e., whether there is sustained economic growth or a poverty trap. This mirrors the cross-country empirical evidence. The paper also shows that an exogenous demographic transition could lead to a takeoff from poverty trap to a positive growth. It shows that beyond the mortality effects of diseases such as HIV/AIDS and malaria, the so-called forgotten diseases that are endemic, do not cause significant mortality and afflict primarily the poor, could be an important determinant of poverty traps by affecting the amortization of physical, human and health capital. This affects the size and allocation of savings among the different types of capital which will be missed in models that treat as exogenous.
Notes
Goenka and Liu (2012) treat disease dynamics as exogenous. Goenka et al. (2014) endogenize disease dynamics in a neoclassical growth model and do not study the interaction with human capital accumulation. See also Bonds et al. (2009) and Delfino and Simmons (2000) who use Solow-type neoclassical models with disease dynamics. Manuelli (2011) also studies the interaction of diseases with human capital but does not fully endogenize disease dynamics or study a fully dynamic general equilibrium model.
The setup of a large representative household is similar to the one used in the labor search literature, which embeds a labor search structure into a dynamic general equilibrium model. This simplifies analysis as one does not have to keep track of the cross-sectional distribution of various economic variables. The model is reduced to a representative agent framework, though with heterogeneity within the household.
We thank the two referees for suggesting this. See “Appendix 4” for this extension.
The classification of countries into developed, developing and least developed is endogenous and implemented via cluster analysis. The objective of cluster analysis is the classification of objects according to similarities among them, and organizing of data into groups. Researchers have developed many algorithmic approaches of the clustering techniques, giving rise to different classification methods. We adopt the most simple and popular classification method, that is, K-means clustering algorithm. It aims to partition all observations into k clusters, in which each observation belongs to the cluster with the nearest mean.
YLL basically corresponds to the number of deaths caused by infectious diseases multiplied by the standard life expectancy at the age at which death occurs. To estimate YLD, the number of incident cases in a certain period is multiplied by the average duration of the diseases and a weight factor that reflects the severity of the disease on a scale from 0 (perfect health) to 1 (death). For more details, please refer to WHO Web site:http://www.who.int.
There are in total only 67 countries for which we have the complete data. Here, we present the list of countries in each group. The developed countries include Australia, Austria, Belgium, Canada, Denmark, Finland, France, Germany, Greece, Iceland, Israel, Italy, Japan, the Netherlands, New Zealand, Norway, Singapore, Spain, Sweden, Switzerland, UK and USA. The developing countries include Algeria, Argentina, Barbados, Bolivia, Chile, China, Colombia, Costa Rica, Ecuado, El Salvador, Guatemala, Guyana, Honduras, Hungary, India, Indonesia, Iran, Jamaica, Malaysia, Mexico, Pakistan, Panama, Paraguay, Peru, Philippines, Portugal, Syria, Thailand, Trinidad and Tobago, Tunisia, Turkey, Uruguay and Venezuela. The least developed countries are Cameroon, Gambia, Ghana, Kenya, Mali, Niger, Senegal, Sierra Leone, Sudan and Zambia.
Thanks to one of the referees who suggested this approach.
For transition in disease prevalence, we also looked at the transition matrix for DALY (disability-adjusted life year rates due to infectious diseases) from 2000 to 2010. The qualitative results remain valid.
We treat the demographic parameters, b and d, as exogenous and abstract from the fertility–mortality nexus. For papers that focus on this relationship see Aksan and Chakraborty (2014), Chakrabory et al. (2010, 2016), Kalemli-Ozcan et al. (2000) and Soares (2005). The microeconomic evidence on this relationship is mixed, see Bleakley and Lange (2009), Fortson (2009), and Kalemli-Ozcan and Turan (2011).
How much productivity is affected varies across diseases. The recent comprehensive estimates of disability weights used to compute DALYs is one possible measure of affect on productivity (see Salomon 2012; Murray 2012). For some specific diseases, there are estimates in the economic literature on loss of income from which effect on productivity is imputed (e.g., Weisbrod (1974) study effect of five parasitic diseases on banana plantation workers in St. Lucia; Fox (2004) study loss of income to tea pickers infected with HIV/AIDS in Kenya). The burden of diseases varies considerably, and the estimates in these studies are annualized. Our model is, however, an aggregated continuous time model making it difficult to use these estimates. Assuming that the productivity falls to an intermediate level but not to zero will not affect the qualitative results.
In Goenka and Liu (2012), we endogenize the labor-leisure choice with SIS disease dynamics and show that the dynamics are invariant under standard assumptions.
The adoption of the CES utility function affects the quantitative results of the paper, but not the qualitative results. For simplicity of exposition, we use log utility.
Having a common depreciation rate \(\delta \) for both health and physical capital is inessential, and the assumption is made for the sake of simplicity.
In Goenka et al. (2014), the recuperation rate \(\gamma \) is endogenized in addition to the contact rate, \(\alpha \) but as both enter additively, for ease of exposition, we abstract away from endogenizing \(\gamma \) in this paper.
\(\alpha \) could also depend on human capital, E, as better education can lead to better awareness of transmission of diseases and thus, more effective prevention measures. To the extent that the awareness is due to public health education, one would model this as expenditure on health capital. In “Appendix 4,” we model the effect of human capital, in general, on the contact rate.
See Herbert and Cohen (1993) and Peterson (1991) on the link between stress and reduced immunity, Cohen and Williamson (1991), Godbout and Glaser (2006) link this to certain infectious diseases, Fuller (1996) show that urbanization and associated overcrowding in Thailand leads to increased stress, Sobngwi (2004) examine the differences between urban and rural residents in Cameroon and found that the former have higher rates of diabetes (which impairs immunity) and hypertension.
See McMichael (2004).
They study a neoclassical model with no human capital or health expenditures.
See Goenka et al. (2014) for analysis of the corner solution with no health expenditure in the absence of this Inada condition.
It has been recognized in the literature that SIS dynamics are not concave which can make the Hamiltonian non-concave, and difficult to check whether the maximized Hamiltonian is concave or not. Thus, the usual Mangasarian and Arrow sufficiency conditions cannot be used. Goenka et al. (2014) investigate this issue in detail. They show that if the growth rate of capital is bounded from below, \(\dot{K}/K \ge - \kappa , \kappa > 0\), then there is a solution to the maximization problem. It relies on showing that the feasible set is relatively compact in \(\textit{L}^1(e^{-(\rho -b+d)t})\). They further show that the first-order conditions to the maximization problems are indeed optimal in this framework if the objective function is concave (Proposition 4). This result can be adapted to this model. Thus, we work with the first-order conditions in this paper.
See the proof of Proposition 1 in “Appendix 2” for more details.
We assume \(\alpha ''(q)\) is large enough, that is,
$$\begin{aligned}&\alpha ''(q) > -\alpha '(q)\, \max \left\{ \frac{\beta }{(1-\beta )(1-L(q))(1+q)}+\frac{L(q)}{1-L(q)}\cdot \frac{\alpha '(q)}{\alpha (q)}+\frac{1}{1+q},\right. \nonumber \\&\quad \left. \frac{\beta }{(1-\beta )(1-L(q))(1+q)}\cdot \frac{\rho -b+d}{\psi L(q)}+\frac{L(q)}{1-L(q)}\cdot \frac{\alpha '(q)}{\alpha (q)}+\frac{1}{1+q} - \frac{\alpha '(q)}{\alpha (q)}\right\} . \end{aligned}$$For the case of Diphtheria, “Booster doses are especially recommended for industrialized countries which need to compensate for the loss of natural boosting from the environment. (Clarke 2018, p. 4),” which is consistent with the increase in K making the effectiveness of the H decrease at a fast enough rate to require booster doses in adulthood—something that has not been done so far.
This does not contradict the fact that the developed countries have a high health expenditure to GDP ratio. The estimation results from cross-country panel data in the OECD countries suggest that technological progress and variation in medical practice are major determinants in the level and growth of health expenditure. More importantly, these countries are largely affected by non-communicable diseases or chronic illness, instead of infectious diseases. Health expenditure in our setup are the resources spent on combating infectious diseases and rich countries in the model do not spend anything on it as the diseases have already been eradicated.
However, we know from the disease dynamics in “Appendix 1” that the disease-free equilibrium is not stable if \(b+\gamma < \alpha \). Since \(b+\gamma <\alpha (q)\) for all q by assumption, disease-free economic growth is also not a stable BGP. This explains why in developed countries, even though diseases are eradicated there is still concern about the possible outbreak of infectious diseases. Goenka et al. (2014) have a detailed discussion of stability properties of the steady states in the neoclassical model with SIS dynamics.
See “Appendix 1” and footnote 32 for further discussion of this.
Since human capital is indeterminate in the case of poverty trap, we assume it is given by its initial level normalized to 1, that is, \(e_0=1\).
Calculate \(\frac{\partial Y^*}{\partial q}\) which is positive if \(\frac{L'}{L} (1+q) > \frac{\beta }{1-\beta }\). Using \(L = \frac{b+\gamma }{\alpha }\) we derive the desired condition.
An external aid subsidy would be \(\tau I_H = \Xi \), where \(\Xi \) is the external aid budget and \(T = 0\).
The dynamical system is eight-dimensional system, which is complicated to study the transitional dynamics. Thus, we only focus on comparative statics here. Goenka and Liu (2012) are able to characterize the full global dynamics as there is only a one-way interaction which simplifies the dynamics. Goenka et al. (2014) have a full analytic characterization of local dynamics in the neoclassical version of the model (six-dimensional system) and show that the disease-endemic steady state is saddle-point stable under reasonable assumptions.
While a discount rate of 0.04 is often used in business cycle analysis, recent evidence shows that while the real interest rate in US is 0.02 and that for developing countries is higher - for Republic of South Africa it is on average 4-6% higher (Fischer 2017). The average real interest rate for sub-Saharan Africa in 2017 was 6.91%, while in the USA it was 2.06% (World Bank 2019). We use a conservative real interest rate of 5.5%.
The change in welfare due to change in life expectancy is represented by consumption-equivalence welfare change. Total welfare is the sum of discounted stream of utilities, which depends on both consumption level C and life expectancy (death rate d), shown in Eq. (4). Let \(\mathscr {W}\) (C, d) denote the total welfare. Before the change in death rate d, the total welfare is \(\mathscr {W}(C^*,d^*)\). After the change, death rate decreases from \(d^*\) to \(d^{**}\), and the total welfare is \(\mathscr {W}(C^{**},d^{**})\). The consumption-equivalence welfare change \(\omega \) is calculated such that \(\mathscr {W}((1+\omega )C^*,d^*) = \mathscr {W}(C^{**},d^{**})\).
The model is in continuous time. All variables are functions of time. However, we omit the subscript “t” throughout the paper, if no confusion caused.
Birth is understood to mean entry to the labor population either through birth or migration. We abstract from the age structure in the paper.
Thus, how individuals choose interaction (e.g., Kremer 1996) is abstracted from. The choice of who to interact with is significant for STDs but much less so for other infectious diseases.
Naively, it might seem plausible that the population density and hence the contact rate would increase with population size, but the daily contact patterns of people are often similar in large and small communities, cities and regions. For human diseases, the contact rate seems to be only very weakly dependent on the population size. The other commonly used model, i.e., new cases equal to \(\alpha I S\), is used typically for herd animals. For more discussion about the form of the incidence, see Hethcote (2008).
Upon recovery, individuals may or may not develop immunity to the disease. Even though they have immunity to the disease, they are still susceptible to mutations of the disease, or other types of infectious diseases. One of the leading examples is influenza: The influenza virus mutates and each year there are new strains of the disease discovered. Immunity from one type of flu does not typically confer immunity to other strains.
Introducing disease-related mortality rate will make the discount factor nonlinear and endogenous, since population growth is affected by the composition of the healthy and infected individuals, which are both endogenous variables. This will become clear in the following subsection, see Eq. (4). Nevertheless, we do comparative statics of varying death rate or life expectancy, see Sect. 5.
Let \(i=I/N\) be the fraction of the infected and \(i=1-s\). We can rewrite the SIS epidemiological model as:
$$\begin{aligned} \dot{s}= & {} b - ds -\alpha i s + \gamma i -s(b-d) \\ \dot{i}= & {} \alpha i s -\gamma i -d i -i(b-d). \end{aligned}$$Since \(i=1-s\), one of these equations is redundant.
When both steady states coexist, that is \(\frac{b+\gamma }{\alpha }<1\), the disease-free steady state is unstable.
References
Acemoglu, D., Johnson, S.: Disease and development: the effect of life expectancy on economic growth. J. Political Econ. 115, 925–985 (2007)
Aksan, A.-M., Chakraborty, S.: Mortality versus morbidity in demographic transition. Eur. Econ. Rev. 70, 470–492 (2014)
Antunes, J.L., Waldman, E.A.: The impact of AIDS, immigration and housing overcrowding on tuberculosis deaths in Sao Paulo, Brazil, 1994–1998. Soc. Sci. Med. 52(7), 1071–80 (2001)
Ashraf, Q.H., Lester, A., Weil, D.N.: When does improving health raise GDP? NBER Macroecon. Annu. 23, 157–204 (2008)
Azomahou, T.T., Bouccekkine, R., Diene, B.: HIV/AIDS and development: a reappraisal of the productivity and factor accumulation effects. Am. Econ. Rev. Pape. Proc. 106(5), 472–477 (2016)
Banerjee, A., Duflo, E.: Poor Economics. Perseus Books Group, Philadelphia (2011)
Barro, R., Lee, J.W.: A new data set of educational attainment in the world, 1950–2010. J. Dev. Econ. 104, 184–198 (2013)
Bleakley, H.: Disease and development: evidence from hookworm eradication in the American South. Q. J. Econ. 122, 73–117 (2007)
Bleakley, H.: Malaria eradication in the Americas: a retrospective analysis of childhood exposure. Am. Econ. J. Appl. Econ 2, 1–45 (2010)
Bleakley, H., Lange, F.: Chronic disease burden and the interaction of education, fertility and growth. Rev. Econ. Stat. 91, 52–65 (2009)
Bloom, D.E., Canning, D., Fink, G.: Diseases and development revisited. J. Political Econ. 122, 1355–1366 (2014)
Bosi, S., Desmarchelier.: Pollution and infectious diseases. Int. J. Econ. Theory. 14(4), 351–372 (2018)
Bonds, M.H., Keenan, D.C., Rohani, P., Sachs, J.D.: Poverty trap formed by the ecology of infectious diseases. In: Proceedings of the Royal Society (2009)
Chakrabory, S., Papageorgiou, C., Perez-Sebastian, F.: Diseases, infection dynamics and development. J. Monet. Econ. 57, 859–872 (2010)
Chakrabory, S., Papageorgiou, C., Perez-Sebastian, F.: Health cycles and health transitions. Macroecon. Dyn. 20(1), 189–213 (2016)
Chauhan, A., Johnston, S.L.: Air pollution and infection in respiratory illness. Br. Med. Bull. 68(1), 95–112 (2003)
Cohen, S., Williamson, G.M.: Stress and infectious diseases in humans. Psychol. Bull. 109(1), 5–24 (1991)
Clarke, K.E.N.: Review of the epidemiology of diphtheria - 2000–2016, US Centers for Disease Control and Prevention (2018)
Cutler, D., Fung, W., Kremer, M., Singhal, M., Vogl, T.: Early-life malaria exposure and adult outcomes: evidence from malaria eradication in India. Am. Econ. J. Appl. Econ. 2, 72–94 (2010)
Decosas, J., et al.: Migration and AIDS. Lancet 346, 826–828 (1995)
Delfino, D., Simmons, P.J.: Positive and normative issues of economic growth with infectious diseases. Discussion Papers in Economics, University of York (2000)
Epstein, P.R.: Climate change and emerging infectious diseases. Microbes Infect. 3, 747–754 (2001)
Fischer, S.: The global low level of real interest rates. BIS Speech (2017)
Fortson, J.G.: HIV/AIDS and fertility. Am. Econ. J. Appl. Econ. 1(3), 170–194 (2009)
Fortson, J.G.: Mortality risk and human capital investment: the impact of HIV/AIDS in Sub-Saharan Africa. Rev. Econ. Stat. 93, 1–15 (2011)
Fox, M.P., et al.: The impact of HIV/AIDS on labor productivity in Kenya. Trop. Med. Int. Health 9, 318–324 (2004)
Fuller, T.D., et al.: Chronic stress and psychological well-being: evidence from Thailand on household crowding. Soc. Sci. Med. 42(2), 265–280 (1996)
Gallup, J., Sachs, J.D.: The economic burden of malaria. Am. J. Trop. Med. Hyg. 64(S1), 85–96 (2001)
Geoffard, P.-Y., Philipson, T.: Rational epidemics and their public control. Int. Econ. Rev. 37(3), 603–24 (1996)
Gersovitz, M., Hammer, J.S.: The economical control of infectious diseases. Econ. J. 114(492), 1–27 (2004)
Godbout, J.P., Glaser, R.: Stress-induced immune dysregulation: implications for wound healing, infectious disease and cancer. J. Neuroimmune Pharmacol. 1, 421–427 (2006)
Goenka, A., Liu, L.: Infectious diseases and endogenous fluctuations. Econ. Theory 50(1), 125–149 (2012). https://doi.org/10.1007/s00199-010-0553-y
Goenka, A., Liu, L., Nguyen, M.-H.: Infectious diseases and economic growth. J. Math. Econ. 50, 34–53 (2014)
Gokhale, K.: Leprosy return shows neglect in India of ancient blight, Bloomberg News (18/09/2013)
Gollin, D.: Getting income shares right. J. Political Econ. 110, 458–474 (2002)
Gottret, P., Schieber, G.: Health Financing Revisited: A Practitioner’s Guide. The World Bank, Washington (2006)
Herbert, T.B., Cohen, S.: Stress and immunity in humans: A meta-analytic review. Psychosom. Med. 55, 364–379 (1993)
Hethcote, H.W.: A thousand and one epidemic models. Front. Theor. Biol. 100, 504–515 (1994)
Hethcote, H.W.: The Basic Epidemiology Models, Epidemiology Models with Variable Population Size, and Age-Structured Epidemiology Models, Mathematical Understanding of Infectious Disease Dynamics. World Scientific, Singapore (2008)
Inobaya, M.T., et al.: Prevention and control of schistosomiasis: a current perspective. Res. Rep. Trop. Med. 5, 65–75 (2014)
Kalemli-Ozcan, S., Turan, B.: HIV and fertility revisited. J. Dev. Econ. 96, 61–65 (2011)
Kalemli-Ozcan, S., Ryder, H., Weil, D.N.: Mortality decline, human capital investment, and economic growth. J. Dev. Econ. 62, 1–23 (2000)
Kremer, M.: Integrating behavioural choice into epidemiological models of the AIDS epidemic. Q. J. Econ. 111, 549–573 (1996)
Lucas, A.: Malaria eradication and educational attainment: evidence from Paraguay and Sri Lanka. Am. Econ. J. Appl. Econ. 2, 46–71 (2010)
Lucas, R.E.: On the mechanics of economic development. J. Monet. Econ. 22, 3–42 (1988)
Manuelli, R.: Disease and development: The role of human capital. HCEO Working Paper, Chicago (2011)
McMichael, A.J.: Environmental and social influences on emerging infectious diseases: past, present and future. Philos. Trans. R. Soc. Lond. B. Biol. Sci. 359(1447), 1049–1058 (2004)
McMichael, A.J., Woodruff, R.E., Hales, S.: Climate change and human health: present and future risks. Lancet 367, 859–69 (2006)
Miguel, E., Kremer, M.: Worms: identifying impacts on education and health in the presence of treatment externalities. Econometrica 72, 159–217 (2004)
Murray, C.J.L., et al.: Disability-adjusted life years (DALYs) for 291 diseases and injuries in 21 regions, 1990–2010: a systematic analysis of global burden of disease study 2010. Lancet 380, 2197–2223 (2012)
Patz, J.A., et al.: Effects of environmental change on emerging parasitic diseases. International Journal for Parasitology 30, 1395–1405 (2000)
Patz, J.A., et al.: Climate change and infectious diseases. In: McMichael, A.J., et al. (eds.) Climate Change and Human Health: Risks and Responses, pp. 103–132. OMS, Geneva (2003)
Pavlovsky, E.N.: Natural Nidality of Transmissible Diseases. University of Illinois Press, Urbana (1966)
Peterson, P.K., et al.: Stress and pathogenesis of infectious disease. Rev. Infect. Dis. 13(4), 710–720 (1991)
Quah, D.: Empirical cross-section dynamics in economic growth. Eur. Econ. Rev. 37, 426–434 (1993)
Salomon, J.A., et al.: Common values in assessing health outcomes from disease and injury: disability weights measurement study for the Global Burden of Disease Study 2010. Lancet 380, 2129–2143 (2012)
Soares, R.: Mortality reductions, educational attainment, and fertility choice. Am. Econ. Rev. 95(3), 580–601 (2005)
Sobngwi, E., et al.: Exposure over the life course to an urban environment and its relation with obesity, diabetes, and hypertension in rural and urban Cameroon. Int. J. Epidemiol. 33, 769–776 (2004)
Steinmann, P., Keiser, J., Bos, R., Tanner, M., Utzinger, J.: Schistosomiasis and water resources development: systematic review, meta-analysis, and estimates of people at risk. Lancet 6(7), 411–425 (2006)
Tarozzi, A., Mahajan, A., Yoong, J., Blackburn, B.: Commitment mechanisms and compliance with health-protecting behavior: preliminary evidence from Orissa, India. Am. Econ. Rev. Pap. Proc. 99(2), 231–235 (2009)
Tatem, A.J., Rogers, D.J., Hay, S.I.: Global transport networks and infectious disease spread. Adv. Parasitol. 62, 293–343 (2006)
Weisbrod, B., et al.: Disease and development: the impact of parasitic diseases in St. Lucia. Int. J. Soc. Econ. 1(1), 111–117 (1974)
World Bank, Data on real interest rates. https://data.worldbank.org/indicator/fr.inr.rinr. Accessed 19 Mar 2019
World Bank, Data on health, https://data.worldbank.org/topic/health. Accessed 2 July 2019
Xu, K., Saksena, P., Holly, A.: The determinants of health expenditure: a country-level panel data analysis. World Health Organization, Working Paper (2011)
Acknowledgements
We would like to thank participants at SMU, Iowa State, NUS, Exeter, Cardiff, Birmingham, Manchester, APCED 2013, Ho Chi Minh; ESEM, Gothenburg, 2013; Midwest Macro 2013, Urbana-Champaign; ISI Growth and Development 2014, Delhi; RES 2015, Manchester; EWGET 2015, Naples; SWET 2015, Paris; SAET 2015, Cambridge; GE York 2016; SED 2017 and especially Joydeep Bhattacharya, Stefano Bosi, Gabriele Camera, Juan Carlos Cordoba, Shankha Chakraborty, Herve Cres, Christian Ghiglino, Sanjeev Goyal, Atsushi Kajii, Cuong Le Van, Rody Manuelli, Manh Hung Nguyen, Omer Ozak, Tridip Ray, Santanu Roy, Karl Shell, John Stachurski, Mich Tvede, Yiannis Vailakis, Ping Wang, and two anonymous referees for their helpful comments. All errors are ours.
Author information
Authors and Affiliations
Corresponding author
Ethics declarations
Conflict of interest
The authors declare that they have no conflict of interest.
Additional information
Publisher's Note
Springer Nature remains neutral with regard to jurisdictional claims in published maps and institutional affiliations.
Goenka would like to acknowledge research support from FASS Research Grant R-122-000-131-112.
Appendices
Appendix 1: The SIS epidemiology model
Epidemiological modeling refers to dynamic modeling where the population is divided into groups based on their epidemiological status (e.g., S, susceptible and I, infective), and flows between the groups are specified by differential equations (as we develop the model in continuous time). Depending on the given disease, there are different disease transmission mechanisms with possibly more epidemiology states. In this paper, we model recurring diseases where having the disease does not confer subsequent immunity. For these diseases, the SIS model is the canonical model.Footnote 40
The total population, N, is divided into two groups: S, the susceptible (healthy and susceptible to the disease) and I, the infective (infected and capable of transmitting the disease).Footnote 41 Individuals are born at the rate b,Footnote 42 healthy and susceptible to the disease. We assume homogeneous mixing so that the likelihood of any individual contracting the disease is the same.Footnote 43 There is horizontal incidence of the disease, i.e., transmission from peers. Let \(\alpha \) be the average number of adequate contacts of a person to catch the disease per unit time or the contact rate. Then, the number of new cases per unit of time is \(\alpha (I/N)S\), depending on the fraction of the infected. This contact structure is the standard incidence or frequency-dependent model, commonly used in the epidemiology literature for human diseases. It is adopted as the pattern of human interaction is relatively stable and invariant to the size of the population.Footnote 44 The contact rate \(\alpha \) is the key parameter and reflects two different aspects of disease transmission: the biological infectivity of the disease and the pattern of social interaction. Changes in either will change \(\alpha \). We concentrate on the how the former is affected by health expenditures. The recovery of individuals is governed by the parameter \(\gamma \) and the total number of individuals who recover from the disease at each time period is \(\gamma I\). Upon recovery, individuals move back to the class of susceptible individuals.Footnote 45 Each individual faces the exogenous death rate, d, irrespective of health status.Footnote 46 Figure 6 describes the transfer diagram for the SIS model.
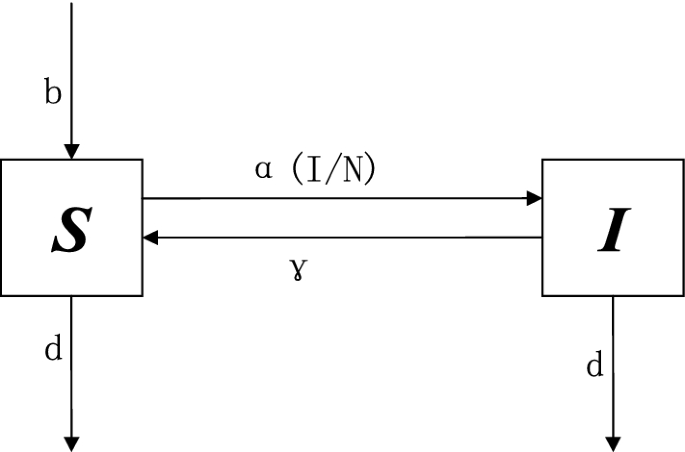
Transfer diagram for the SIS epidemiology model. Note In a SIS epidemiology model, the total population is divided into two groups: the susceptible denoted as S and the infected denoted as I. The birth rate is b and newborns are born healthy and susceptible. All individuals irrespective of health status die at the rate d. The susceptible get infected at the rate \(\alpha \frac{I}{N}\) and the infected recover at the rate \(\gamma \). For more details, see Hethcote (2008)
The SIS epidemiology model is given by the following system of differential equations (Hethcote 2008):
The first equation shows that the change in the number of the susceptibles equals the inflow of newborns, bN, and the recovered, \(\gamma I\), minus the outflow due to both being infected, \(\alpha (I/N) S\), and death, dS. Similarly, the second equation shows that the change in the number of the infected is the difference between the inflow of newly infected, \(\alpha (I/N)S\), and the outflow of the those recovered, \(\gamma I\) and dead, dI. As the total population consists of the susceptibles and the infected, letting \(s=S/N\) be the fraction of the susceptibles we can simplify the dynamical system to:
with the total population growing at the rate \(b-d\).Footnote 47 Note that the probability for a healthy individual to contract diseases is \(\alpha (1-s)\), depending on the contact rate \(\alpha \) and the fraction of the infected \((1-s)\) in the population. We maintain the assumption that \(b-d \ge 0\), that is, the net population growth is always nonnegative.
This SIS epidemiology model admits two steady states: The disease-free steady state \((s^*=1)\) and the disease-endemic steady state \(\left( s^*=\frac{b+\gamma }{\alpha }\right) \). We note that the former exists for all parameter values, while the latter exists only when \(\frac{b+\gamma }{\alpha } < 1\).Footnote 48 The epidemiology model described so far is a biological one with the disease transmission as given. In the economic epidemiology model, we endogenize the disease transmission through health expenditures that affect infectivity of the disease, and study how this interacts with choices on physical and human capital.
Appendix 2: The decentralized economy
Proof of Proposition 1: Existence of the BGPs
The dynamical system of the decentralized economy is given as follows:
In addition, the following TVCs: \(\lim _{t\rightarrow \infty } e^{-(\rho -b+d)t} \lambda _1 K = 0\), \(\lim _{t\rightarrow \infty } e^{-(\rho -b+d)t} \lambda _2 H = 0\), \(\lim _{t\rightarrow \infty } e^{-(\rho -b+d)t} \lambda _3 e = 0\), and \(\lim _{t\rightarrow \infty } e^{-(\rho -b+d)t} \lambda _4 L = 0\) have to be satisfied in the equilibrium.
Disease-free case In this case, infectious diseases are eradicated, all individuals are healthy, and health expenditure for disease control is zero, \(I_H = 0\). Otherwise, if \(I_H>0\), we have \(\theta _3 = 0\) and \(\lambda _1 = \lambda _2\). Combining Eqs. (33) and (34), we obtain \(\lambda _1 \beta A K^{\beta -1}(eu)^{1-\beta }= 0\), which contradicts \(\lambda _1 = \frac{1}{C}>0\).
Differentiating both sides of Eq. (30), we get \(-\frac{\dot{C}}{C} = \frac{{\dot{\lambda }}_1}{\lambda _1}\). Dividing both sides of Eq. (33) by \(\lambda _1\), we get \(\frac{{\dot{\lambda }}_1}{\lambda _1} = \rho +\delta - \beta A K^{\beta -1}(eu)^{1-\beta }\). Since u is a constant along BGP, it implies growth rates of human capital and physical capital are the same. Similarly, by dividing both sides of Eq. (27) by K, growth rates of physical capital and consumption are the same. So consumption, physical and human capital all grow at the same rate \(g=\psi (1-u)\), given by Eq. (28). Dividing both sides of Eq. (35) by \(\lambda _3\), we have \(\frac{{\dot{\lambda }}_3}{\lambda _3} = \frac{{\dot{\lambda }}_1}{\lambda _1} = -g\).
If \(u^* =1\), \(g=0\) and \({\dot{\lambda }}_1 = {\dot{\lambda }}_3 = 0\). From Eq. (32), \(\theta _1 \ge 0\) and \(\lambda _1 (1-\beta )A K^\beta e^{-\beta } > \lambda _3 \psi \). From Eq. (35), \(\lambda _1 (1-\beta ) A K^\beta e^{-\beta } = \lambda _3 (\rho -b+d)\). So we have \(\psi < \rho -b+d\), contradicting the assumption \(\psi > \rho -b+d\). So, \(u^*\) is strictly less than one, \(\theta _1 = 0\) and \(\lambda _1 (1-\beta )A K^\beta e^{-\beta } = \lambda _3 \psi \). Substituting this into Eq. (35), we get \(g = \psi -(\rho -b+d)\) and \(u^* = \frac{\rho -b+d}{\psi }\).
Disease-endemic case In this case, infectious diseases are prevalent and \(L(q) = \frac{b+\gamma }{\alpha (q)}\). Since \(L^*\) is a constant along BGP, \(q^*\) is also a constant, implying physical and health capital grow at the same rate. Due to the Inada condition, health expenditure is strictly positive. So in Eq. (31) \(\theta _3 = 0\) and \(\lambda _1 = \lambda _2\). Then, we could rewrite Eqs. (33)–(36) as:
By some manipulations, we can see that consumption, physical, health and human capital grow at the same rate \(g=\psi L(q^*)(1-u^*)\), \(\frac{{\dot{\lambda }}_1}{\lambda _1} = \frac{{\dot{\lambda }}_3}{\lambda _3} = - g\) and \(\frac{{\dot{\lambda }}_4}{\lambda _4} = 0\). Substituting these into Eqs. (37)–(39), we have
Then, substituting these into Eq. (40), we obtain:
which is a function of both q and u. Moreover, from Eq. (32), we have:
Since \(\frac{\lambda _1}{\lambda _3} >0\) and \(\lambda _1>0\), we have \(\lambda _3>0\). So Eq. (32) reduces to
Therefore, Eqs. (41) and (42) determine \((u^*, q^*)\).
There are two scenarios. If \(u^*=1\), growth rate \(g=0\). Equation (41) simplifies to:
Since \(u^*=1\), we have \(\theta _1 \ge 0\), implying \(\psi L(q^*) \le \rho -b+d\). That is, a disease-endemic poverty trap exists if \(q^* \le {\hat{q}}\).
If \(u^*<1\), we have \(\lambda _1 (1-\beta )A K^\beta (eL)^{1-\beta } u^{-\beta } = \lambda _3 \psi e L\) and \(u^* = \frac{\rho -b+d}{\psi L^*}\). \(q^*\) is determined by:
Since \(u^*<1\), we have \(\psi L(q^*) > \rho -b+d\). That is, a disease-endemic BGP exists if \(q^* > {\hat{q}}\).
If we compare the two functions \(G_L(q)\) and \(G_R(q)\), we find that \(G_L(q) > G_R(q)\) if \(q<{\hat{q}}\), \(G_L(q) < G_R(q)\) if \(q>{\hat{q}}\), and \(G_L(q) = G_R(q)\) if \(q={\hat{q}}\). Thus, \(q^*\) is determined by function
Furthermore, the function G is continuous, \(\lim _{q \rightarrow 0} G = +\infty \) and \(\lim _{q \rightarrow \infty } G <0\). By intermediate value theorem, there exists a \(q^*>0\) such that \(G(q) = 0\), that is, there exists an endemic disease case. If \(q^* \le {\hat{q}}\), it is a poverty trap, and if \(q^*>{\hat{q}}\), it is a positive growth path.
Proof of Lemma 1: Uniqueness of \(q^*\)
Since the functions \(G_L(q)\) and \(G_R(q)\) are differentiable, we have
We further assume \(\alpha ''(q)\) is big enough, that is:
Therefore, we can show that both functions \(G_L(q)\) and \(G_R(q)\) are monotonically decreasing in q. Moreover, since \(G(q) = G_L(q)\) when \(q < {\hat{q}}\), \(G(q) = G_R(q)\) when \(q > {\hat{q}}\), and \(G(q) = G_L(q) =G_R(q)\) when \(q = {\hat{q}}\), function G(q) is also monotonically decreasing in q. Thus, there exists a unique \(q^*\) such that \(G(q)=0\).
Proof of Proposition 2: Comparative Statics
Since \(\psi \frac{b+\gamma }{\alpha ({\hat{q}})} = \rho -b+d\), we have
Define \({\hat{G}} = G({\hat{q}}) = -\frac{1-\beta }{\beta } \alpha '({\hat{q}})(1-L({\hat{q}}))(1+{\hat{q}})-\alpha ({\hat{q}})-(\rho -b+d)\). If \({\hat{G}} \le 0\), it is a disease-endemic poverty trap, and if \({\hat{G}}>0\), it is a disease-endemic BGP.
When \(\alpha ''(q)\) is big enough, we have \( \frac{\partial {\hat{G}}}{\partial {\hat{q}}}<0 \). Then,
That is, when infectious diseases are endemic, countries are more likely to undergo a positive economic growth path, if capital share (\(\beta \)) is smaller; households are more patient (i.e., \(\rho \) is smaller); life expectancy rises (i.e., d is smaller), or effectiveness of human capital accumulation (\(\psi \)) is higher.
Proof of Proposition 3: Resource Allocation
Here, we provide resource allocation in a decentralized economy.
- (1)
Countries in the disease-free BGP: Substituting \(L^*=1\) and \(\frac{\lambda _1}{\lambda _1} = -g\) into Eq. (33), we have \(\beta A(\frac{K}{e u})^{\beta -1} = g+\rho +\delta \). Then,
$$\begin{aligned} \frac{I_K}{Y}= & {} \frac{\dot{K}+(\delta +b-d)K}{Y} = \left( \frac{\dot{K}}{K}+\delta +b-d\right) \frac{1}{A}\left( \frac{K}{eu}\right) ^{1-\beta } \\= & {} \beta \frac{g+\delta +b-d}{g+\rho +\delta }; \\ \frac{C}{Y}= & {} 1-\frac{I_K}{Y} = 1-\beta \frac{g+\delta +b-d}{g+\rho +\delta }. \end{aligned}$$Substituting \(g=\psi -(\rho -b+d)\), we obtain the results for countries in the disease-free BGP.
- (2)
Countries in the disease-endemic BGP: Combining Eqs. (37) and (38), we have \(\beta A(\frac{K}{e uL})^{\beta -1} = (g+\rho +\delta )(1+q)\). Then,
$$\begin{aligned} \frac{I_K}{Y}= & {} \frac{\dot{K}+(\delta +b-d)K}{Y} = \left( \frac{\dot{K}}{K}+\delta +b-d\right) \frac{1}{A}\left( \frac{K}{euL}\right) ^{1-\beta } \\= & {} \beta \frac{g+\delta +b-d}{g+\rho +\delta }\cdot \frac{1}{1+q}; \\ \frac{I_H}{Y}= & {} \frac{\dot{H}+(\delta +b-d)H}{Y} = (g+\delta +b-d)\cdot \frac{H}{K}\cdot \frac{K}{Y} \\= & {} \beta \frac{g+\delta +b-d}{g+\rho +\delta }\cdot \frac{q}{1+q}; \\ \frac{C}{Y}= & {} 1-\frac{I_K}{Y}-\frac{I_H}{Y} = 1-\beta \frac{g+\delta +b-d}{g+\rho +\delta }. \end{aligned}$$Substituting \(g=\psi L^*-(\rho -b+d)\), we obtain the results for countries in the disease-endemic BGP.
- (3)
Countries in the disease-endemic poverty trap: Similar to countries in the disease-endemic BGP, we substitute \(g=0\) and obtain the results for countries in the poverty trap.
Appendix 3: The centralized economy and optimal public health policy
Centralized Economy
Here, we present the optimization problem in the centralized economy. The centralized economy differs from the decentralized one as the social planner takes into account that the intervention can effectively control the proportion of the infected in total population. The social planner’s maximization problem is essentially similar to the decentralized economy with the only difference being in the law of motion for labor force participation:
Thus, the social planner solves the following problem by choosing the allocations on consumption (C), physical capital investment (\(I_K\)), health expenditure (\(I_H\)) and fraction of time in production (u):
s.t.
What we are interested in is to find the optimal allocation and see how it differs from the decentralized competitive equilibrium allocation.
Optimal Health Subsidy
Here, we present a decentralized economy with public health subsidy which can replicate the optimal BGP in the centralized economy.
We assume for each unit of private health investment, there is a proportional health subsidy \(\tau \), which is financed through a lump-sum tax T. The representative household solves the following problem by choosing consumption (C), physical capital investment (\(I_K\)), health expenditure (\(I_H\)) and fraction of time in production (u):
s.t.
In equilibrium, the period-by-period balance budget (balancedness) implies \(T=\tau I_H\).
What we are interested in is to find the health subsidy \(\tau \), with which the decentralized competitive equilibrium allocation is the same as the centralized optimal allocation. In the following analysis, the superscript \(\tau \) is used in denoting variables in the decentralized economy with the health subsidy.
Proof of Proposition 5: Optimal Public Health Subsidy
In a decentralized economy with health subsidy,
- 1.
There exists a unique disease-free BGP with the growth rate \(g^\tau = \psi - (\rho -b+d)\);
- 2.
There exists a unique disease-endemic case with \(L^{*,\tau } = L(q^{*,\tau })\).
- (a)
If \(L^{*,\tau } > \frac{\rho - b + d}{\psi } \) or \(q^{*,\tau } > {\hat{q}}\), it is a BGP with \(u^{*,\tau } = \frac{\rho -b+d}{\psi L^{*,\tau } },\) and \(g^c = \psi L^{*,\tau } -(\rho -b+d)\);
- (b)
If \(L^{*,\tau } \le \frac{\rho -b+d}{\psi }\) or \(q^{*,\tau } \le {\hat{q}}\), it is a poverty trap.
The effective health capital \(q^{*,\tau }\) is determined by the equation
$$\begin{aligned} G^{\tau }(q) = \max \{G^{\tau }_L(q), G^{\tau }_R(q)\}=0, \end{aligned}$$where
$$\begin{aligned} G^{\tau }_L(q)= & {} -\frac{1-\beta }{\beta }\alpha '(q)(1-L(q))(1+q+\tau ) -\alpha (q) -(\rho -b+d), \quad \text {and} \\ G^{\tau }_R(q)= & {} -\frac{1-\beta }{\beta }\alpha '(q)(1-L(q))\left( 1+q+\frac{\rho +\delta }{\rho +\delta +(1+\tau )g}\tau \right) \frac{\psi L(q)}{\rho -b+d} \\&-\,\alpha (q) -(\rho -b+d). \end{aligned}$$ - (a)
The proof is the similar to the proof of proposition of the decentralized economy without subsidy, and hence ignored here. When infectious diseases are eradicated, there is no health expenditure and thus no need for the health subsidy. The disease-free BGP is the same as those in the decentralized economy and the centralized economy shown. When infectious diseases are endemic, the effective health capital \(q^{*,\tau }\) is determined by the equation \(G^\tau (q)=0\). Compared with \(G(q)=0\) in the decentralized economy without subsidy, the difference lies in the first term in the net marginal benefit, which is distorted by the relative marginal value of physical capital investment and health expenditure, due to the subsidy \(\tau \). We can rewrite \(G^\tau (q)\) as follows:
Clearly with the health subsidy, countries are more likely to be in the positive economic growth path.
The subsidy \(\tau \) is chosen such that \(q^{*,\tau }\) determined by equation \(G^\tau (q)= 0\) is the same as \(q^{*,c}\) determined by equation \(G(q)+b+\gamma =0\). Let \(q^*=q^{*,\tau }=q^{*,c}\).
If \(q^* \le {\hat{q}}\), we know \(G(q^*)+b+\gamma =0\), which implies \(-\frac{1-\beta }{\beta }\alpha '(q^*)(1-L(q^*))(1+q^*)-\alpha (q^*)-(\rho -b+d)+b+\gamma =0\). From \(G^\tau (q^*)=0\), we have
Similarly, if \(q^* > {\hat{q}}\), we know \(G(q^*)+b+\gamma =0\), which implies \(-\frac{1-\beta }{\beta }\alpha '(q^*)(1-L(q^*))(1+q^*)\frac{\psi L^*}{\rho -b+d}-\alpha (q^*)-(\rho -b+d)+b+\gamma =0\). From \(G^\tau (q^*)=0\), we have
and
Appendix 4: An extension of the model with the disease contact rate depending on both health and human capital
Here, we present an extension of the model, where the disease contact rate \(\alpha \) depends on both effective health and human capital. The idea is that higher human capital through greater awareness and understanding of epidemiology of diseases will reduce the contact rate.
The contact rate \(\alpha \) is assumed to depend on both health capital H and human capital e. In order to have a balanced growth path, we further assume that the contact rate depends on the effective human capital, \(q_e = \displaystyle \frac{e}{K}\), and effective health capital, \(q_H = \displaystyle \frac{H}{K}\). For ease of exposition, we use the following functional form:
where a is the effectiveness of controlling disease. We can see that when \(\phi _2=0\), the model is same as the baseline model in the paper.
We solve the social planner’s optimization problem. The difference from the baseline centralized economy in the paper is the two equations—the evolution of shadow value \(\lambda _1\) and \(\lambda _3\), which takes into account the effect of change in physical capita and human capital on the contact rate:
In the BGP, the dynamical system is:
Similar to the baseline model in the paper, there are two scenarios.
Case 1 If \(u^* = 1\), the economy is in the poverty trap and the growth rate is zero \(g=0\). In the steady state, human capital is given by its initial condition \(e_0\). The steady-state health capital \(H^*\) and physical capital \(K^*\) (or the effective health capital \(q_H^* = H^*/K^*\) and effective human capital \(q_e^* = e_0/K^*\)) are determined by the following two equations:
The steady state exists only if the following condition holds in the steady state:
We can see that in the special case \(\phi _2=0\), the steady-state conditions are exactly the same as those in the baseline model in the paper.
Case 2 If \(u^*<1\), the economy grows at the rate \(g=\psi L (1-u)\). \((q_H^*, q_e^*, u^*)\) are determined by the following three equations:
The model here becomes more complex to solve compared with the baseline model in the paper, where all the equations reduce to one equation which determines the effective health capital \(q_H\).
Nevertheless, here we focus on what new insights on the conditions for a country to take off by in the specification where the contact rate also depends on human capital. Let us define \({\hat{q}}_H\) such that
When \(\phi _2 = 0\), the equation reduces to \(\rho -b+d = \psi L\), which is exactly the condition for \({\hat{q}}\), i.e., the threshold q above which there is growth in the baseline model. Here, with a positive \(\phi _2\), that is, human capital does play a direct role in controlling disease, the LHS of the equation is smaller than \(\rho -b+d\), as the fraction multiplying it is less than one. Thus, the cutoff L beyond which the economy will grow is smaller than the case when human capital does not affect the contact rate. Furthermore, as the RHS \(\psi L = \displaystyle \frac{b+\gamma }{\alpha (q_H, q_e)}\) the threshold contact rate that permits growth is also higher. Thus, even with higher disease incidence, the economy can still grow. Thus, the new insights we gain by extending the model are that:
Even with a high contact rate, the economy may take off.
The criterion for a country to take off depends on the stock of human capital in the country.
The country with higher human capital level is more likely to take off, compared with the country with lower human capital level.
The implication is that policies that increase human capital accumulation are also more likely to increase the possibility that an economy will start to grow as the higher human capital, through greater awareness of transmission and control of diseases, reduces disease incidence. This indirect effect of human capital through the evolution of diseases is different from the traditional direct effect of human capital on productivity as in Lucas (1988). Ultimately, the main driver of growth in the model is human capital accumulation. As there is now an additional marginal benefit of the human capital, the decrease in the contact rate, there will be an increased incentive in accumulating it and make it more likely for the economy to take off.
Rights and permissions
Open Access This article is distributed under the terms of the Creative Commons Attribution 4.0 International License (http://creativecommons.org/licenses/by/4.0/), which permits unrestricted use, distribution, and reproduction in any medium, provided you give appropriate credit to the original author(s) and the source, provide a link to the Creative Commons license, and indicate if changes were made.
About this article

Cite this article
Goenka, A., Liu, L. Infectious diseases, human capital and economic growth. Econ Theory 70, 1–47 (2020). https://doi.org/10.1007/s00199-019-01214-7
Received:
Accepted:
Published:
Issue Date:
DOI: https://doi.org/10.1007/s00199-019-01214-7