
Abstract
An increased interest in using amorphous solid forms in pharmaceutical applications to increase solubility, dissolution, and bioavailability has generated a need for better characterization of key properties, such as the glass transition (Tg) temperature. Although many laboratories measure and report this value, the details around these measurements are often vague or misunderstood. In this article, we attempt to highlight and compare various aspects of the two most common methods used to measure pharmaceutical Tg values, conventional and modulated differential scanning calorimetry (DSC). Issues that directly impact the Tg, such as instrumental parameters, sample preparation methods, data analysis, and “wet” vs. “dry” measurements, are discussed.
INTRODUCTION
The Amorphous State and Glass Transition Temperature
In recent years, there has been an increased interest in utilizing the amorphous solid form of active pharmaceutical ingredients (API) to overcome the poor aqueous solubility, dissolution, and bioavailability of many corresponding crystalline forms being developed as solid oral dosage forms. Such amorphous API often are combined with amorphous small molecule coformers (1) or polymers (2) to form “miscible” mixtures, which can inhibit solid-state and solution-mediated crystallization during handling, storage, and administration, thus providing greater supersaturation in aqueous solution relative to its crystalline form. As such, it is extremely important to understand the principles underlying the structural, thermodynamic, and kinetic properties of individual API and excipient molecules, and their mixtures, in the amorphous state, and to provide physical measurements that can characterize a particular amorphous system (3).
From a thermodynamic perspective, we can begin by examining in Fig. 1 a schematic representation of the free energy vs. temperature profile associated with a typical organic crystal and its corresponding liquid (4). Here, we observe that the free energy of the crystal decreases as the temperature increases until it reaches the melting temperature (Tm). At this point, the free energy of the liquid and crystal are equal and the phase transition from crystal to liquid takes place until only the liquid exists above Tm. If we now slowly decrease the temperature of the liquid phase, under conditions that allow time for crystal nucleation and growth to occur, we see that the crystalline state should return at and below Tm. However, if we decrease temperature below Tm, at cooling rates that do not allow time for crystal nucleation, the free energy of the liquid will increase without the discontinuity ordinarily reflective of some type of phase change. Thus, the super-cooled liquid formed retains the equilibrium properties of the liquid below Tm. However, as also depicted in Fig. 1, the “super-cooled” material maintains the equilibrium properties of the liquid as temperature decreases only until an abrupt discontinuity occurs at a temperature defined as the “glass transition temperature” (Tg). Thus, below this temperature the system is in a thermodynamically unstable “glassy” state, with greater free energy relative to both the super-cooled liquid and crystal. This increased free energy leads to not only greater apparent solubility (supersaturation) than expected for the crystal but also to an increased thermodynamic potential for crystallization and loss of this solubility advantage. It is also thermodynamically likely that molecules in the glassy state under appropriate conditions can lose free energy and approach the super-cooled equilibrium state without crystallizing. This is the basis for the well-described tendency of glasses to undergo “physical aging” below Tg (5). Thus, it appears important to know whether the operating temperature for various pharmaceutical processes is above or below Tg, i.e., whether one is dealing with the super-cooled equilibrium liquid or the glassy state.

Free energy vs. temperature of a molecule reflecting different equilibrium and non-equilibrium states (4)
To further understand the underlying molecular basis for the “glass transition,” it should be recognized that while decreasing temperature increases the free energy of the system, the structural viscosity (η) of the system, reflective of translational and rotational diffusivity, increases significantly between Tm and Tg, i.e., from about 10−2 Pa at Tm to 1012 Pa at Tg (6). In addition, studies of the molecular diffusivity of these systems above Tg, have revealed a temperature, Tx, the “crossover temperature” at which the viscosity of the super-cooled liquid begins to change from about 102 Pa at Tx to 1012 Pa at Tg (6). It is at this temperature, and below, that significant changes in the structure of the super-cooled liquid occur because of the initiation of changes in the arrangements and interactions of molecules, which produce a highly viscous “pre-glassy” state. Once at Tg, the equilibrium super-cooled liquid state cannot be maintained as cooling occurs and viscosity increases, and the thermodynamically unstable glassy state is formed. Thus, the glass transition temperature is not a thermodynamic parameter, but rather, it is a reflection of the diffusive dynamics associated with the changing viscosity as temperature decreases, caused by significant structural changes. Therefore, it is not surprising that small differences in values of Tg determined experimentally at different cooling rates, or by different methods, are often obtained. For example, as a rough “rule of thumb,” a one-order change in the cooling rate produces a 3–5 K change in Tg (7). In addition to rapid cooling of liquid, very similar amorphous forms, but often with slightly different Tg values, can be obtained by rapid cooling of molecules in the vapor state, rapid precipitation from solution, mechanical milling of a crystalline sample, and dehydration of some crystal hydrates (8). Consequently, when reporting a value for Tg, it is important to report the exact conditions under which the amorphous solid was formed and the conditions by which Tg is measured. One additional important reason for knowing the Tg of any amorphous solid is that it provides a basis for a priori estimation of the temperatures at which various important physical events occur. For example, it has been shown that spontaneous crystallization and physical aging, can be inhibited for a period of years i.e., ~ 108 s (900 days) by reducing the temperature to about 50°C below Tg (9). In addition, it has been established that for most amorphous organic materials and polymers, Tx is ~ 1.2 Tg (6), and for many organic molecules, Tm is ~ 1.5 Tg (10). Since, it is at this temperature that there is a major change in the heat capacity and thermal expansion coefficient of the system, thermal analytical techniques, such as differential scanning calorimetry (DSC) and dynamic mechanical analysis (DMA), are useful tools for determining Tg experimentally (3).
Glass Transition Temperature of Binary Amorphous Mixtures
As mentioned above, amorphous APIs are often mixed with amorphous excipients as part of pharnmaceutical dosage forms. If the two components are completely immiscible and, therefore, phase separated, we would expect the mixture to exhibit two Tg values each equal to the individual components (11,12). In many cases, small molecule or polymeric excipients can be processed to produce a “miscible” mixture, very much as what one might expect from two miscible liquids of relatively similar chemical structure. Here, we generally observe a single Tg value dependent on the API-excipient composition and intermediate to the two individual values (11). There are situations where in immiscible systems each of the components have Tg values which are too close to be detected separately, i.e., within about 10°C, or because the domain size of the separated phases are less than 30–100 nm and not detected by thermal techniques such as DSC (11). In such cases, evidence for the presence of such phase separated domains of individual components has been obtained using X-ray powder diffraction (XRPD) (11) and solid-state nuclear magnetic resonance (SSNMR) spectroscopy (13).
In general, it is known that solutions of two liquids will form if the free energy of mixing is negative. Since the entropy of such mixing is generally positive, leading to a negative free energy, the enthalpy of mixing, arising from intermolecular interactions, will determine whether the mixture is phase separated, or is thermodynamically close to ideal (a regular solution), or non-ideal. Larger enthalpies of mixing, either positive or negative, generally lead to significant non-idealities, and in terms of amorphous solids, we would expect the value of Tg for a mixture relative to the individual Tg values, would reflect such thermodynamic differences. For example, it has been been shown that the Tgmix of an ideal solution will be directly related to the individual Tg values (Tg1, Tg2) weighted by the weight fraction (w) of each component (w1, w2) as shown in Eq. (1), the Gordon-Taylor equation (14). Here, temperature must be expressed in Kelvin units.
where, the constant K is,
Equation (1) has also been derived by Couchman and Karacz (15) on a thermodynamic basis, where,
and, ∆Cp is the heat capacity change for each component at its Tg.
In some cases as with a variety of polymer blends, the densities of the individual compents are close to being equal, so that Eq. (1) can now be written as the Fox equation (16),
This equation is useful as an approximate “back-of-the-envelope” prediction of Tgmix only knowing the weight fraction and Tg of each component.
Generally speaking, if the chemical structures of the individual components are reasonably close, we would expect close to ideal conditions and experimental agreement with the application of Eqs. (1) and (2), as for example, that observed in Fig. 2, for mixtures of indomethacin and PVP/VA (polyvinyl (pyrrolidone)/vinyl acetate, copovidone) (Fig. 2) (17). In those cases where intermolecular interaction between the individual components themselves is greater than that between the two different molecules, we can expect a significant deviation from ideality and experimental values of Tgmix that are less than predicted by Eq. (1). This type of behavior, illustrated in Fig. 3, has been noted with very polar molecules, such as sucrose, when mixed with PVP, because of the very strong hydrogen bonds that exist between the sugar molecules (18). On the other hand, as shown in Fig. 4, when intermolecular interactions between the components are quite strong relative to bonding of the components with themselves, experimental values of Tgmix will be greater than predicted. This, indeed, has been reported for amorphous mixtures of an organic API salt and various grades of PVP (19).


Effcts of Absorbed Water on the Glass Transition Temperature
It is well established that amorphous solid forms of molecules containing hydrogen bond donors and acceptors can absorb significant amounts of water from the vapor state into the bulk phase as a function of relative humidity and temperature (20,21). As such, water molecules essentially dissolve within the glass or super-cooled liquid to form a “solution,” where water molecules break intermolecular hydrogen bonds between the molecules in the solid and form hydrogen bonds with these molecules. Based on the discussion above, it is not surprising that such absorption of water and the formation of a miscible solution within the amorphous form should influence the structure and thermodynamics of the system so as to produce a distinct change in such properties as structural viscosity, free volume, and the glass transition temperature. As observed from the parameters in Eqs. (1) and (4), the very low Tg of water, 136 K, should greatly reduce the “dry” Tg of an amorphous solid. Indeed, as shown in Fig. 5, for a PVP-water system, there is a significant reduction in Tgmix with increasing water content (22). Consider, also, as an example given in Fig. 6, the Tgmix of an indomethacin-water miscible mixture, produced by exposing amorphous indomethacin to various relative humidities (RH) at 30°C (23). Note that as little as 0.01, weight fraction of water reduces the dry Tg from 315 to about 296 K, below room temperature. In Fig. 6, we include a plot of data predicted for an ideal mixture by the application of Eqs. (1) and (2) and data obtained experimentally at various water contents. With each plot, we give the K constant calculated for ideal mixing from Eqs. (1) and (2), and the K constant obtained by allowing it to be an arbitrary fitting constant consistent with the experimental data. Clearly, the absorption of water into indomethacin has a much greater “plasticizing effect, i.e., lower Tgmix, than would be predicted for an ideal mixture. Indeed, this suggests that clustering of water molecules occurs within the relatively nonpolar indomethacin matrix, resulting in a large increase in free volume and much more efficient plasticization than might be expected (23).

Glass transition temperature of poly(vinylpyrrolidone) as a function of absorbed water content (22)

Similarly, one would expect water absorbed into a miscible amorphous mixture of API and coformer to reduce the Tgmix of the binary system, in a manner described above. In such cases therefore, we would expect the absorbed water to produce an increase in molecular mobilty sufficient to bring about physical change unless the operating temperature is significantly less than the resulting Tgmix, e.g., about 50°C below Tgmix. Depending on the strength of the interaction between API and coformer in relation to Tgmix and the extent of increased molecular mobility caused by absorbed water molecules, a number of scenarios are possible, including: separation into drug-rich and polymer-rich amorphous phases followed by crystallization of drug, or crystallization of drug directly from the miscible dispersion (24,25).
Thus, it is apparent that in studying the properties of amorphous solids it is very important to know exactly what the relationship is between water content and Tg, and how this might change various physical properties. Such understanding will be enhanced if, as a routine, accurate Tg values are obtained and an appropriate Tg vs. water content profile is experimentally determined.
T g MEASUREMENTS FOR AMORPHOUS SOLIDS
Techniques Available for Measuring T g
One of the most common techniques for measuring Tg is DSC. A modification of this method is modulated DSC (mDSC), which can be more sensitive than conventional DSC. Several other analytical methods have been used to investigate Tg values, and some of these are summarized in Table I. Minimally, these techniques are not as common as DSC but are becoming more integrated into pharmaceutical laboratories. These methods can be used as confirmation of the value obtained by DSC or as a secondary method if there are issues that make the DSC method difficult or impractical, such as thermal degradation or a lack of sensitivity.
In one comparative study, four methods (DSC, DMA, TSC, and dilatometry) were used to measure the Tg of chitosan (28). The sample preparation and hygroscopicity of the material made analysis difficult, and Tg values ranging from 150 to 203°C had been reported in the literature. In this controlled study, the four techniques resulted in Tg values ranging from 140 to 150°C, showing good overall agreement for this compound. For some applications, a range of 10°C may be acceptable, but other applications may need more precise Tg values, such as determining physical stability conditions and handling conditions when values of Tg − 50 are close to ambient conditions.
This paper will concentrate on issues to be considered when measuring Tg values of pharmaceutical samples using conventional and modulated DSC. A number of instrumental and analysis parameters need to be considered when measuring and reporting a Tg value and these are discussed in more detail in the following sections. Before discussing amorphous systems containing water, we will examine the general process of determining Tg by thermal analysis.
Experimental T g Values Obtained with DSC
The glass transition temperature is considered the temperature where an amorphous solid undergoes an apparent second-order transition defined as a step change in the heat capacity (∆Cp) as a function of temperature and observed as a baseline shift (Fig. 7a). This shift represents the change from a glass to a supercooled liquid upon heating (as represented in Fig. 1). There are numerous ways to report the Tg with the most common being the onset and inflection temperature (Fig. 7a). It is important to understand which temperature is being reported, since they can vary by several degrees, with significant impact on use and storage conditions.
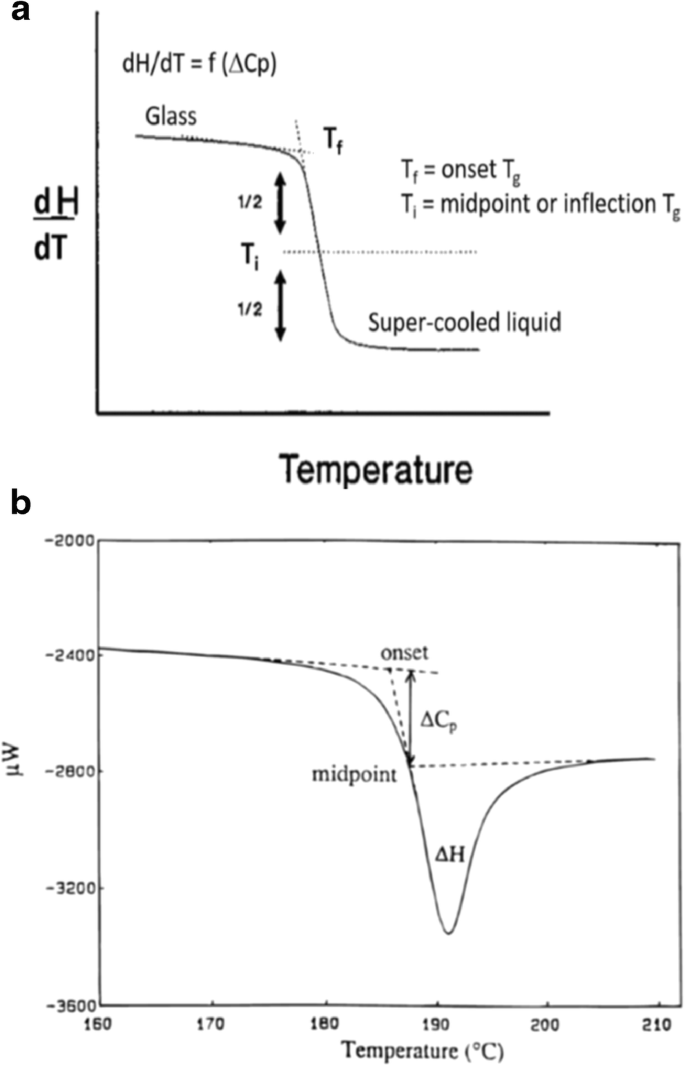
a Glass transition in DSC showing onset temperature (Tf) and midpoint (inflection) temperature (Ti). b Glass transition temperature showing enthalpy relaxation endotherm (∆H) (3)
While a classic Tg signal is represented in Fig. 7a, a small endotherm may also be observed for a glass transition, as shown in Fig. 7b. The small endotherm represents enthalpic relaxation (∆H) due to aging or relaxation of the amorphous sample. The enthalpic relaxation endothermic transition will increase as the sample continues to age/relax over time (33). It is possible to minimize/eliminate this endotherm by removing the thermal history of the sample. This involves heating the sample past the Tg, cooling the sample, and reheating the sample past the Tg (34).
Glass transition temperatures can be used to evaluate the miscibility of amorphous mixtures, such amorphous solid dispersions (ASDs) or polymer blends. When two amorphous materials are miscible, one Tg will usually be observed in the DSC curve, whereas when the samples are immiscible, two Tg values will usually be observed (11). The width of the Tg region can also provide information about the extent of miscibility, i.e. broad Tg transitions indicate tendencies towards immiscibility. An example with miscible polymer blends is given in Table II; as the amount of poly (methylmethacrylate) (PMMA) increases, the Tg width increases from 26 to 100°C, indicating less miscibility in samples with more PMMA (35). The width was measured by taking the derivative of the Tg and measuring the onset and final temperature of the derivative peak. Again, it is important to know if the onset or inflection point is being reported when the Tg signals are very wide. In the case of the 30/70 PECH poly (epichlorohydrin)/PMMA sample, for example, a difference of up to 50°C would be reported for the Tg onset or inflection temperature.
Tg measurements and relaxation enthalpy can be used to study more complex properties of amorphous materials, such as molecular mobility (4,9,36) and fragility (37). Collecting Tg values at different heating rates was also used to calculate the “true” Tg of corn starch containing different amounts of water; this value was the extrapolated Tg obtained upon regression and represents Tg when the heating rate is slow and approaching 0°C/min (38).
Conventional DSC
Conventional DSC instruments measure the heat flow of a sample compared with a reference when both samples are heated with the same controlled temperature program (39,40). Instruments are calibrated with compounds having accurately known melting points and heats of fusion. A common standard used for pharmaceutical applications is indium (melting point 156.6°C, enthalpy of fusion 3.25 kJ/mol). It should be noted that instruments need to be calibrated whenever a different scan rate is employed to ensure that accurate values for temperature and heats of reaction are obtained.
Glass transitions are generally low in energy and can be difficult to see under routine conditions in a conventional DSC. Increasing the scan (heating) rate will typically improve sensitivity and enhance the appearance of Tg because the flow of energy increases over a shorter period when using a faster scan rate (41,42,43). This is demonstrated in Fig. 8 for amorphous lactose (43) and glassy felodipine (41) where faster scan rates result in larger signals. Increasing the scan rate will also significantly increase the value of the Tg temperature, as illustrated with felodipine, which shows a difference of up to 12°C when the heating rate is increased. This example demonstrates the importance of knowing the heating rate when comparing Tg values since significant differences can be observed.

Thermal events detected by conventional DSC can result because of overlapping transitions, such as Tg overlapping with enthalpic relaxation, desolvation, or crystallization transitions. Generally, it can be difficult or impossible to separate or eliminate the overlap using conventional DSC, such as preheating the sample to remove solvent or thermal history, without changing the sample that is being analyzed.
Modulated DSC
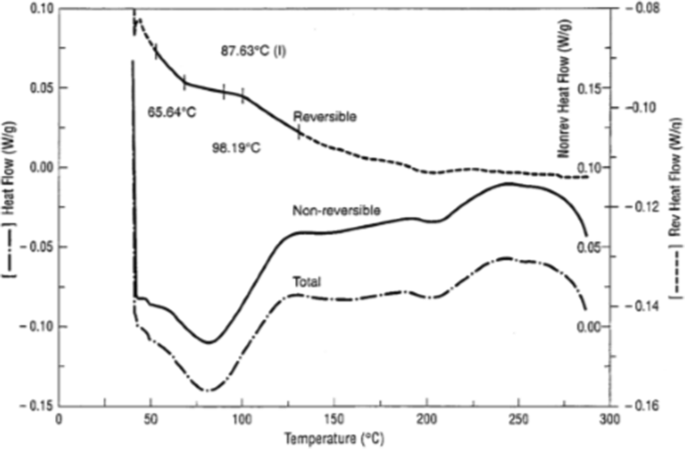
The second technique commonly used for Tg measurements is mDSC (44,45). It is a technique that uses a combination of a conventional DSC linear heating with a temperature modulation superimposed over the heating rate. The result of this temperature modulation is that the heating rate is no longer constant, but will change in a modulated manner. This allows multiple heating rates to be measured simultaneously, which, in turn, increases resolution and sensitivity, as well as providing a direct measurement of heat capacity (45). It also allows deconvolution of the data into reversing and non-reversing components of thermal events. Reversing transitions include Tg, heat capacity, and melting, while non-reversing events include enthalpic relaxation, desolvation, crystallization, and decomposition. The mDSC plot obtained will contain three curves, including both the reversing and non-reversing curve, as well as a conventional curve, which is similar to that obtained with conventional DSC conditions (Fig. 9).

Modulated DSC curves for amorphous saquinavir, showing the reversing, non-reversing, and total heat flow. Note the Tg in the reversing heat flow curve is separated from the enthalpic relaxation evident in the non-reversing curve (46)
Most of the mDSC calibration procedures (baseline correction, temperature scale, and sensitivity) are the same as those for conventional DSC using a standard such as indium. An additional calibration for heat capacity is required for mDSC, and sapphire is commonly used for this step. This calibration should be performed using the same modulation program used for analysis (42). For sensitive measurements, it is also important to have sample and reference pans that are the same initial weight to minimize background heat capacities (47), and additional weight corrections may be needed for hermetically sealed pans (48).
Several parameters need to be optimized for the mDSC run, including heating rate, modulation amplitude, modulation period, and sample size (45,49). Slow heating rates, ranging from 0.1 to 5°C, are commonly used for mDSC, resulting in longer run times compared with conventional DSC. As observed with conventional DSC, a faster scan rate results in more sensitivity (Fig. 10a). It is suggested that there should be at least five modulation cycles during the transition, therefore the width of the Tg will impact the modulation amplitude chosen. Modulation periods of 20–80 s are acceptable for many samples, and, as shown in Fig. 10b, the modulation period will influence the sensitivity of the measurement. Sample sizes of 2–20 mg are commonly tested to find the optimal weight for the analysis (45). It should be noted that all parameters need to be optimized for the sample being analyzed (50). A standard set of conditions will not work for all materials, and artifacts due to improper deconvolution can emerge in the reversing and non-reversing curves when the wrong parameters are used. These artifacts could lead to misinterpretation of the data, and, ultimately, affect the use and stability of the amorphous sample during development. Additional information on setting instrumental parameters will be specific to the mDSC equipment being used and can be obtained from the manufacturer.

a Effect of scan rate on the reversible heat flow of polystyrene; amplitude 1°C over a period of 60 s with a scan rate of (a) 2°C/min, (b) 3.5°C/min, and (c) 5°C/min. b Effect of modulation period on the reversible heat flow of a polystyrene sample; scan rate of 5°C/min, amplitude 2°C, and a period of (a) 45 s, (b) 60 s, and (c) 100 s (50)
It has been suggested that “mDSC should be viewed as a complimentary approach to conventional DSC, rather than a replacement. Rather, the best approach for characterizing new materials is to start with conventional DSC and then switch to mDSC if its advantages are required” (45). Collecting the conventional DSC curve under appropriate conditions for Tg values can also provide useful information when determining mDSC parameters, such as approximate temperature range and transition width, while the mDSC can provide more sensitivity and additional data (such as the heat capacity) if needed for the system being studied.
Wet vs. Dry T g Measurements
In this section, some of the unique issues that arise when attempting to measure the Tg values of an amorphous system when it contains a specific amount of absorbed water will be examined. It is important to understand the type of data required when designing the thermal experiments, and, to assure that the water content in the sample is maintained during the measurement. As summarized in the “INTRODUCTION,” amorphous materials can contain water that may significantly decrease the Tg of the sample. Collecting data with water contained in the sample is described as a “wet” Tg. In some cases, a Tg without the water is needed, and this is commonly called a “dry” Tg. It is important to understand the type of data needed in order to pick the appropriate sample preparation and instrumental conditions.
Wet Tg measurements can be collected using conventional or modulated DSC instruments. There are numerous examples in the literature demonstrating the effect of water on the wet Tg of amorphous samples, excipients, and dispersions (22,38,51,52,53,54). For wet Tg measurements, the sample pan is hermetically sealed to retain the water in the sample. Crimped, pinhole, and open pans should not be used to determine wet Tg values. It is important that a true hermetic seal is obtained, since any break in the seal will lead to water loss and an inaccurate Tg temperature. If significant water is contained in the sample and a large sample size is used, pressure buildup in the pan may be an issue, leading to deformed pans, sample leakage, and reduced contact with the cell, which can result in poor reproducibility and potential artifacts in the data (43). It has been reported that the integrity of the seal can be an issue above approximately 150°C (55). Smaller sample sizes can help reduce pressure buildup and its issues when using routine pans or commercial high-pressure pans (~ 150 Bar) are available from instrument vendors. An easy test to confirm that the seal is intact is to weigh the sample after the run and confirm that no change in weight has occurred when compared with the initial sample weight (55). Small sample sizes in a hermetically sealed pans can also cause issues. It has been reported, for example, that water loss into the headspace can result in a dehydration endotherm when using hermetically sealed pans with small amounts of hydroxypropylmethylcellulose (HPMC) films. Weighing the pan after the run showed no loss in weight, indicating the water was retained in the pan (56). Note that the dehydration temperature might be slightly higher due to the more confined area in the DSC pan. Increasing the sample size in the pan, using an inverted lid, or using a smaller pan will minimize or prevent this from occurring. Other considerations, such as contact of the sample with the sample pan and baseline corrections, may also be needed for certain compounds (57).
For dry Tg measurements using a conventional DSC, the sample can be dried before the analysis or during the run. If it is dried before the analysis, it is important to understand how exposure to ambient conditions during DSC sample preparation may change the water content of the sample, and this preparation method is not recommended for hygroscopic samples. A second method to collect dry Tg values is to use an open pan, collect data at ~ 20°C/min to a temperature above the Tg (to erase thermal history and remove water or volatiles), quench cool to 50°C below the Tg, hold for about 10 min, and then reheat through the Tg (34). A third cycle through the Tg is recommended. If the Tg is reproducible in the second and third cycles, then the transition is confirmed as a Tg. If different values are obtained in the second and third cycles, then the transition may not be a true Tg and other characterization of the sample may be needed. The use of a dry purge gas, such as nitrogen, in the DSC instrument should maintain a dry environment throughout the heat/cool process.
An open pan can also be used to collect dry Tg measurements using mDSC. Crimped or pinhole pans will allow egress of water out of the pan, but the rate of dehydration will not always be consistent, due to the variable extent of crimping or size of a manual pinhole in the lid, and this inconsistency could significantly affect the thermal curves observed (49,58). If mDSC parameters are chosen correctly, the Tg obtained should be separated from the water loss, with the Tg in the reversing curve and the dehydration in the non-reversing curve, as shown in Fig. 11. Multiple cycles with mDSC have also been reported to remove thermal history (46), and multiple mDSC heating cycles could also be used to confirm dehydration and the dry Tg.
A polymeric drug substance showing the loss of water in the broad non-reversible endotherm and the underlying Tg in the reversible curve (59)
CASE STUDIES
Amorphous Citric Acid
A study with citric acid, a common excipient used in lyophilization and oral dosage forms, was performed to investigate the wet and dry Tg of the amorphous material (60). Conventional DSC data were collected, using scan rates of 10 K/min, and additional studies were performed using scan rates of 5–40 K/min. Amorphous samples were made by heating and quenching the crystalline materials in pinhole (anhydrate) or hermetically sealed (monohydrate) pans and subsequently measuring the Tg. KF values of the crystalline materials resulted in less than 0.05% water in the anhydrate and 8.6% water in the monohydrate.
The Tg value measured for the dry citric acid was 11°C, while the wet citric acid (containing 8.6% water) was significantly lower at − 25°C (Fig. 12a). An additional experiment was performed with the monohydrate in a pinhole pan, which resulted in Tg and ∆Cp values similar to the dry amorphous citric acid material, indicating that the pinhole pan resulted in loss of water during the DSC experiment. The low Tg values explained the difficulties encountered trying to produce and maintain these amorphous materials when made by traditional methods, such as quench melting on a larger scale. The addition of water sorbed by the amorphous material under ambient conditions, thereby lowering the Tg even further, added to the stability issues. The Gordon-Taylor equation was used to calculate the Tg for mixtures of citric acid and water. Excellent agreement was found between the calculated and experimental values. This analysis allowed accurate estimations for the Tg of amorphous citric acid water mixtures for water contents up to 8.6% water.

DSC curves for a dry (anhydrous) and wet (monohydrate) amorphous citric acid samples showing the Tg values for each sample; b 10% (w/v) citric acid aqueous frozen solution. Insert shows two thermal events between − 90 and − 40°C. The derivative DSC (DDSC) curve clearly shows two transitions (60)
The DSC curve for a 10% (w/v) citric acid aqueous frozen solution (Fig. 12b) exhibited two thermal events between − 90 and − 40°C. The lower temperature is attributed to the Tg of a freeze-concentrated solution with high water content but without ice, and the higher transition was due to a freeze-concentrated solution containing ice and is represented as Tg′. For successful freeze drying, the sublimation of ice should be at or below the Tg′. In this case, the Tg′ of citric acid solutions was substantially lower than − 45°C, the lowest temperature that could be attained with their laboratory equipment, therefore, producing amorphous citric acid by lyophilization without crystallization was not successful.
Immiscibility in Amorphous Solid Dispersions with Water
The phase behavior of amorphous solid dispersions containing the hydrophilic polymer PVP and various hydrophobic drugs (nifedipine, indomethacin, ketoprofen, droperidol, and pimozide) was investigated after exposure to elevated RH conditions at room temperature (24). Samples were analyzed using DSC and infrared (IR) spectroscopy to determine miscibility. For all initial ASD samples, analysis confirmed complete miscibility by DSC (one Tg) and IR (specific drug-polymer interactions).
Storage at elevated RH conditions (75–94% RH) resulted in two different phenomena. Two dispersions (indomethacin-PVP and ketoprofen-PVP) were found to maintain miscibility after water exposure. The other three systems were found to separate into immiscible drug-rich and polymer rich amorphous phases, in a process called amorphous-amorphous phase separation (AAPS). As shown in Fig. 13a, for the pimozide-PVP system, the dry Tg of the amorphous pimozide was reported as 60°C (dry PVP K12 was reported around 112°C). The DSC curves clearly showed one Tg initially (94°C) for the ASD, while two Tg values were evident after exposure at 94% RH for 42 h (− 21 and 44°C). The marked decrease in both Tg values, compared with the initial Tg values for the individual components, was due to the water (22.4%) absorbed by the ASD. Upon drying the samples (after RH exposure), two Tg values are still evident, but are now reported at higher temperatures (61 and 112°C). The sample remains a mixture, but the Tg values of the individual components increase due to the water lost upon drying.

Analysis of pimozide-PVP ASDs before and after RH exposure and subsequent drying a Tg values before and after exposure to 94% RH with and without drying. The Tg of pure amorphous pimozide (top) is included for comparison. b IR spectra of the carbonyl regions for pimozide-PVP ASD. A reduction in the intensity of peaks assigned to the free pimozide carbonyl (2709 cm−1) and PVP carbonyl when hydrogen bonded to pimozide (1661 cm−1) was observed as the storage RH was increased and the resulting spectra were found to be more similar to the calculated spectrum of the physical mixture composed of amorphous drug and PVP (24)
The IR spectra confirmed the separation of the pimozide-PVP system. After RH exposure the relative intensity of the peak at 1709 cm−1 (assigned to free carbonyl moiety of the drug) was found to decrease, which suggested an increase in the drug-drug hydrogen bonding (Fig. 13b). A similar decrease was observed in the intensity of the peak at 1661 cm−1, which was assigned to the carbonyl group of PVP when it is hydrogen bonded to drug molecules. These observations were consistent with phase separation of the system into drug- and polymer-rich amorphous regions and confirmed the DSC results.
Physical stability and crystallization were also studied for the various ASDs. Drug crystallization in systems exhibiting AAPS was found to occur earlier (< 6 days at 94% RH) when compared with systems that remain miscible (> 46 days at 94% RH). Evidence of water-induced phase separation was observed after storage at RHs as low as 54% for the pimozide-PVP system. It was evident that the drug crystallization was much faster following the AAPS, since the crystallization inhibitory influence of the polymer would be reduced. These studies highlight one issue with accelerated stability testing at high RH conditions, which may not be representative of physical stability that could be achieved at lower RH or with protective packaging to limit exposure to water.
CONCLUSIONS
As with any solid-state characterization method, it is important to understand the instrumental parameters and sample preparation methods used to collect Tg data. The choice of conventional vs. modulated DSC instruments will be dependent on the amorphous system being analyzed, and, while mDSC can help improve sensitivity and separate overlapping transitions, it may not be the best choice for all samples. Other parameters, such as sample pan configuration and scan rate, can drastically change the value and should be specified for all reported Tg values. When collecting data, it is important to understand if the effect of water is required, and parameters should be chosen to optimize the “wet” Tg value. When reporting “wet” Tg values, it is important to provide accurate water values. When reporting dry Tg values, it is imperative to remove all water in the samples to provide an accurate value.
Abbreviations
- AAPS:
-
Amorphous-amorphous phase separation
- AFM:
-
Atomic force microscopy
- API:
-
Active pharmaceutical ingredient
- ASD:
-
Amorphous solid dispersion
- C p :
-
Heat capacity
- DSC:
-
Differential scanning calorimetry
- DDSC:
-
Derivative differential scanning calorimetry
- DMA:
-
Dynamic mechanical analysis
- H :
-
Enthalpy relaxation
- HPMC:
-
Hydroxypropylmethylcellulose
- IGC:
-
Inverse gas chromatography
- kJ/mol:
-
Kilojoule/mol
- mDSC:
-
Modulated differential scanning calorimetry
- mg:
-
Miligram
- nm:
-
Nanometer
- η:
-
Structural viscosity
- Pas:
-
Pascal seconds
- PECH:
-
Poly (epichlorohydrin)
- PMMA:
-
Poly (methylmethacrylate)
- PVP:
-
Polyvinyl (pyrrolidone)
- PVP/VA:
-
Polyvinyl (pyrrolidone)/vinyl acetate, copovidone
- RH:
-
Relative humidity
- SFM:
-
Scanning force microscopy
- SSNMR:
-
Solid-state nuclear magnetic resonance
- T f :
-
Onset temperature
- T g :
-
Glass transition
- T g′:
-
Glass transition due to freeze-concentrated solution containing ice
- T g1 :
-
Glass transition of component 1
- T g2 :
-
Glass transition of component 2
- T i :
-
Inflection temperature
- T m :
-
Melting temperature
- T gmix :
-
Glass transition of mixture
- TSC:
-
Thermally stimulated current
- T x :
-
Crossover temperature
- w 1 :
-
Weight fraction of component 1
- w 2 :
-
Weight fraction of component 2
- XRPD:
-
X-ray powder diffraction
References
Newman AW, Reutzel-Edens SM, Zografi G. Coamorphous active pharmaceutical ingredient-small molecule mixtures: considerations in the choice of coformers for enhancing dissolution and oral bioavailability. J Pharm Sci. 2018;7:5–17.
Newman A, Knipp G, Zografi G. Assessing the performance of amorphous solid dispersions. J Pharm Sci. 2012;101:1355–77.
Hancock BC, Zografi G. Characteristics and significance of the amorphous state in pharmaceutical systems. J Pharm Sci. 1997;86:1–12.
Hancock BC, Shamblin SL. Molecular mobility of amorphous pharmaceuticals determined using differential scanning calorimetry. Thermochim Acta. 2001;380:95–107.
Liu J, Rigsbee DR, Stotz C, Pikal MJ. Dynamics of pharmaceutical solids: study of enthalpy relaxation by isothermal microcalorimetry. J Pharm Sci. 2002;91:1853–62.
Zografi G, Newman A. Interrelationships between structure and properties of amorphous solids of pharmaceutical interest. J Pharm Sci. 2017;106:5–27.
Ediger MD, Angell CA, Nagel SR. Supercooled liquids and glasses. J.Phys.Chem. 1996;100:13200–12.
Byrn SR, Zografi G, Chen X. Chapter 6 amorphous solids. In: Solid-state properties of pharmaceutical materials. New York: John Wiley & Sons; 2017. p. 69–88.
Hancock BC, Shamblin SL, Zografi G. Molecular mobility of amorphous pharmaceutical solids below their glass transition temperatures. Pharm Res. 1995;12:799–806.
Fukoka E, Makita M, Yamamura S. Glassy state of pharmaceuticals, III. Chem Pharm Bull. 1989;37:1047–50.
Newman A, Engers D, Bates S, Ivanisevic I, Kelly RC, Zografi G. Characterization of amorphous API-polymer mixtures using X ray powder diffraction. J Pharm Sci. 2008;97:4840–56.
Baird JA, Taylor LS. Evaluation of amorphous solid dispersion properties using thermal analysis technqiues. Adv Drug Deliv Rev. 2012;64:396–421.
Pham TN, Watson SA, Edwards AJ, Chavda M, Clawson JS, Strohmeir M, et al. Analysis of amorphous solid dispersions using 2D solid-state NMR and 1HT1 relaxation measurements. Mol Pharm. 2010;7:1667–91.
Gordon M, Taylor JS. Ideal copolymers and the second-order transition of synthetic rubbers. I. Noncrystalline co-polymers. J Appl Chem. 1952;2:493–500.
Couchman PR, Karasz FE. A classical thermodynamic discussion of the effect of composition on glass transition temperature. Macromol. 1978;11:117–9.
Fox TG. Influence of diluent and copolymer composition on the glass transition temperature of a polymer system. Bull Am Phys Soc. 1956;1:123.
Matsumoto T, Zografi G. Physical properties of solid molecular dispersions of indomethacin with poly (vinylpyrrolidone) and poly (vinylpyrrolidone-co-acetate) in relation to indomethacin crystallization. Pharm Res. 1999;16:722–1728.
Shamblin SL, Huang EY, Zografi G. The effects of co-lyophilized polymeric additives on the glass transition temperature and crystallization of amorphous sucrose. J Therm Anal. 1996;47:1567–79.
Khougaz K, Class SD. Crystallization inhibition in solid dispersions of MK-0591 and poly (vinylpyrrolidone) polymers. J Pharm Sci. 2000;89:1325–34.
Newman AW, Reutzel-Edens SM, Zografi G. Characterization of the hygroscopic properties of active pharmaceutical ingredients. J Pharm Sci. 2008;97:1047–59.
Lin X, Hu Y, Liu L, Su L, Na L, Yu J, et al. Physical stability of amorphous solid dispersions: a physicochemical perspective on thermodynamic, kinetic, and environmental aspects. Pharm Res. 2018;35:125.
Oksanen CA, Zografi G. The relationship between the glass transition temperature and water vapor absorption by poly (vinylpyrrolidone). Pharm Res. 1990;7:654–7.
Andronis V, Yoshioka M, Zografi G. Effects of sorbed water on the crystallization of indomethacin from the amorphous state. J Pharm Sci. 1997;86:346–51.
Rumondor ACF, Marsac PJ, Stanford LA, Taylor LS. Phase behavior of poly (vinylpyrrolidone) containing amorphous solid dispersions in the presence of moisture. Mol Pharm. 2009;6:1492–505.
Newman A, Zografi G. An examination of water vapor sorption by multi-component crystalline and amorphous solids and its effects on their solid-state properties. J Pharm Sci. 2019;108:1061–80.
Bliznyuk VN, Assender HE, Briggs GAD. Surface glass transition temperature of amorphous polymers. A new insight with SFM. Macromol. 2002;35:6613–22.
Wu M, Kleiner L, Tang F-W, Hossainy S, Davies MC, Roberts CJ. Nanoscale mechanical measurement determination of the glass transition temperature of poly (lactic acid)/everolimus coated stents in air and dissolution media. Eur J Pharm Sci. 2009;36:493–501.
Dong Y, Ruan Y, Wang H, Zhao Y, Bi D. Studies on glass transition temperature of chitosan with four techniques. J Appl Polym Sci. 2004;93:1553–8.
Gontard N, Ring S. Edible wheat gluten film; influence of water content on glass transition temperature. J Agric Food Chem. 1996;44:3474–8.
Rahman MS, Al-Marhubi IM, Al-Mahrouqi A. Measurement of glass transition temperature by mechanical (DMTA), thermal (DSC and MDSC), water diffusion and density methods; a comparison study. Chem Phys Lett. 2007;440:372–7.
Burnett DJ, Thielmann F, Booth J. Determining the critical relative humidity for moisture-induced transformations. Int J Pharm. 2004;287:123–33.
Surana R, Randall L, Pyne A, Vemuri NM, Suryanarayanan R. Determination of glass transition temperature and in situ study of the plasticizing effect of water by inverse gas chromatography. Pharm Res. 2003;20:1647–54.
Shamblin SL, Zografi G. Enthalpy relaxation in binary amorphous mixtures containing sucrose. Pharm Res. 1998;15:1828–34.
Kerc J, Srcic S. Thermal analysis of glassy pharmaceuticals. Thermochim Acta. 1995;248:81–95.
Song M, Hammiche A, Pollock HM, Hourston DJ, Reading M. Modulated differential scanning calorimetry: 4. Miscibility and glass transition behavour in poly(methyl methacrylate) and poly(epichlorohydrin) blends. Polymer. 1996;37:5661–5.
Carpentier L, Bourgeouis L, Descamps M. Contribution of temperature modulated DSC to the study of of the molecular mobility in glass forming pharmaceutical systems. J Therm Anal Calorim. 2002;68:727–39.
Crowley KJ, Zografi G. The use of thermal methods for predicting glass-former fragility. Thermochim Acta. 2001;380:79–93.
Liu P, Yu L, Liu H, Chen L, Li L. Glass transition temperature of starch studied by a high-speed DSC. Carbohydr Polym. 2009;77:250–3.
Byrn SR, Zografi G, Chen X. Chapter 10. Differential scanning calorimetry and thermogravimetric analysis. In: Solid-state properties of pharmaceutical materials. New York: John Wiley and Sons; 2017. p. 124–143.
Craig DQM, Reading M, editors. Thermal analysis of pharmaceuticals. Boca Raton: CRC Press; 2007.
Kerc J, Srcic S, Mohar M, Smid-Korbar J. Some physicochemical properties of glassy felodinpine. Int J Pharm. 1991;68:25–33.
Coleman NJ, Criag QM. Modulated temperature differential scanning calorimetry: a novel approach to pharmaceutical thermal analysis. Int J Pharm. 1996;135:13–29.
Saunders M, Gabbott P. Chapter 4. Thermal analysis-conventional techniques. In: Storey RA, Ymen I, editors. Solid state characterization of pharmaceuticals. West Sussex: Blackwell; 2011. p. 135–86.
Verdonck E, Schaap K, Thomas LC. A discussion of the principles and applications of modulated temperature DSC (MTDSC). Int J Pharm. 1999;192:3–20.
Knopp MM, Lobmann K, Elder DP, Rades T, Holm R. Recent advances and potential applications of modulated differential scanning calorimetry (mDSC) in drug development. Eur J Pharm Sci. 2016;87:164–73.
Royall PG, Craig DQM, Doherty C. Characterization of the glass transition of an amorphous drug using modulated DSC. Pharm Res. 1998;15:1117–21.
Zhou D, Zhang GGZ, Law D, Grant DJW, Schmitt EA. Physical stability of amorphous pharmaceuticals: importance of configurational thermodynamic quantities and molecular mobility. J Pharm Sci. 2002;91:1863–72.
Shalaev EY, Steponkus PL. Correction of the sample weight in hermetically sealed DSC pans. Thermochim Acta. 2000;345:141–3.
Hill VL, Craig DQM, Feely LC. Characterisation of spray-dried lactose using modulated differential scanning calorimetry. Int J Pharm. 1998;161:85–107.
Bell LN, Touma DE. Glass transition temperatures determined using a temperature-cycling differential scanning calorimeter. J Food Sci. 1996;61:807–10.
Shamblin SL, Zografi G. The effects of absorbed water on the properties of amorphous mixtures containing sucrose. Pharm Res. 1999;16:1119–24.
Zhu D, Zografi G, Gao P, Gong Y, Zhang GGZ. Modeling physical stability of amorphous solids based on temperature and moisture stresses. J Pharm Sci. 2016;105:2932–9.
Crowley KJ, Zografi G. Water vapor absorption into amorphous hydrophobic drug/poly(vinylpyrrolidone) dispersions. J Pharm Sci. 2002;91:2150–65.
Tong P, Zografi G. Effects of water vapor absorption on the physical and chemical stability amorphous sodium indomethacin. AAPS PharmSciTech. 2003;5:9–16.
Royall PG, Craig DQM, Doherty C. Characterisation of moisture uptake effects on the glass transition behavior of an amorphous drug using modulated temperature DSC. Int J Pharm. 1999;192:39–46.
McPhillips H, Craig DQM, Royall PG, Hill VL. Characterisation of the glass transition of HPMC using modulated temperature differential scanning calorimetry. Int J Pharm. 1999;180:83–90.
Yu L, Christie G. Measurement of starch thermal transitions using differential scanning calorimetry. Carbohydr Polym. 2001;46:179–84.
Mukherjee I, Rosolen MA. Thermal transitions of gelatin evaluated using DSC sample pans of various seal integrities. J Therm Anal Calorim. 2013;114:1161–6.
Rabel SR, Jona JA, Mourin MB. Applications of modulated differential scanning calorimetry in preformulation studies. J Pharm Biomed Anal. 1999;21:339–45.
Lu Q, Zografi G. Properties of citric acid at the glass transition. J Pharm Sci. 1997;86:1374–8.
Author information
Authors and Affiliations
Corresponding author
Additional information
Publisher’s Note
Springer Nature remains neutral with regard to jurisdictional claims in published maps and institutional affiliations.
Rights and permissions
Open Access This article is distributed under the terms of the Creative Commons Attribution 4.0 International License (http://creativecommons.org/licenses/by/4.0/), which permits unrestricted use, distribution, and reproduction in any medium, provided you give appropriate credit to the original author(s) and the source, provide a link to the Creative Commons license, and indicate if changes were made.
About this article

Cite this article
Newman, A., Zografi, G. Commentary: Considerations in the Measurement of Glass Transition Temperatures of Pharmaceutical Amorphous Solids. AAPS PharmSciTech 21, 26 (2020). https://doi.org/10.1208/s12249-019-1562-1
Received:
Accepted:
Published:
DOI: https://doi.org/10.1208/s12249-019-1562-1