
Abstract
Background
Renal cell carcinoma (RCC) is the fourteenth most common cancer worldwide, accounting for approximately 4% of all cancers. More than 70% of RCC are clear cell RCC (ccRCC). To date, no reliable biomarkers for the detection of ccRCC have been identified. The aim of this study was to identify blood-based DNA methylation (DNAm) markers for the early detection and treatment of ccRCC.
Results
To identify ccRCC-associated DNAm markers, we performed targeted bisulfite sequencing (TB-seq) and an epigenome-wide association study (EWAS) using whole blood-derived DNA from 50 ccRCC patients and 50 healthy controls in the discovery phase. EWAS was performed using a linear regression model. The analysis was adjusted for age, sex, and the estimated cell-type composition. In the replication phase, the accuracy of the identified ccRCC-associated CpGs was verified in 48 independent ccRCC patients and 48 healthy controls. We identified six ccRCC-associated hypomethylated CpGs in PCBD2/MTND4P12 in the discovery phase (p < 1.75 × 10⁻⁸); four were reproducible in the replication phase (p < 2.96 × 10⁻⁸). The sum of the DNAm levels at the six CpGs was a valid indicator of ccRCC both in the discovery phase (area under the receiver operating characteristic curve [AUC-ROC] = 0.922) and in the replication phase (AUC-ROC = 0.871). Moreover, the results of cis-expression quantitative methylation analysis suggested that the DNAm levels of the ccRCC-associated CpGs affect the gene expression of transcription factor 7 (TCF7) and voltage-dependent anion-selective channel 1 (VDAC1), which are involved in cancer progression.
Conclusions
In this study, we identified six ccRCC-associated CpGs in PCBD2/MTND4P12 by EWAS using blood-based DNA. We found that the DNAm levels of the six CpGs in PCBD2/MTND4P12 may be a potential biomarker for early ccRCC detection, but the value as a biomarker needs to be investigated in future studies.
Background
Renal cell carcinoma (RCC) involves the development of malignant cells in the renal parenchyma. Accounting for 4% of all cancers and 80% of kidney cancers, RCC is the fourteenth most common cancer worldwide [1]. The majority of RCCs are found incidentally during health checkups and examinations for other diseases, such as hypertension, diabetes mellitus, and obesity. The incidence ratio of RCC in males to females is 1.7–2.0:1 [2]. More than 70% of RCC diagnoses are classified as clear cell RCC (ccRCC) [3]. The overall 5-year survival rate for early stage RCC is approximately 93%, while patients with metastatic RCC have a 5-year survival rate of only 12% [4]. Thus, diagnosis of RCC at an early stage is critical for patient survival. However, since there are no major symptoms and no effective biomarkers in the early stages of RCC, early detection relies on computed tomography scans and ultrasonography.
Eleven germline mutations (in BAP1, FLCN, FH, MET, PTEN, SDHB, SDHC, SDHD, TSC1, TSC2, and VHL) are known to confer an inherited predisposition to develop RCC [5, 6]. Although 18 RCC-associated single nucleotide polymorphisms have been identified in genome-wide association studies and meta-analyses [7,8,9,10,11,12], only 3–5% of all RCCs can be explained by genetic background, and those with a genetic predisposition develop RCC at a young age. In contrast, most RCCs develop with increasing frequency after the age of 50 and are often attributable to non-genetic factors such as smoking, alcohol consumption, and obesity. In recent years, it has become clear that different histologically defined RCC subtypes (e.g., ccRCC and CpG island methylator phenotype-RCC (CIMP-RCC)) exhibit characteristic mutations, chromosomal copy number variations, and mRNA, miRNA, and lncRNA expression patterns [13, 14].
Biomarker tests must be simple and minimally invasive. From this perspective, those using whole blood or plasma collected during medical examinations are some of the most suitable. DNA methylation (DNAm), a regulator of gene expression, has attracted attention as a potential biomarker for various diseases, including cancer [15]. Although several DNAm biomarkers associated with RCC have been identified by microarray DNAm analysis using renal tissue-derived DNA [16,17,18], there have been few reports on blood-derived DNAm biomarkers. For comprehensive DNAm analysis and epigenome-wide association studies (EWAS), microarrays are widely used because of their high throughput and low cost. Most of the DNAm data summarized in The Cancer Genome Atlas (TCGA) [19] and EWAS Data Hub [20] are derived from microarray analyses. However, the number of CpG sites (CpGs) that can be detected by microarray analysis (such as using the Infinium MethylationEPIC microarray [21]) is only 3–3.5% of the CpGs in the whole genome, indicating that novel DNAm biomarkers may be hidden in other CpGs and not detected on microarrays. Therefore, we have explored environmental exposure- and disease-associated DNAm biomarkers using sequencing-based methods [22,23,24,25] that cover a large number of CpGs.
In this study, in order to identify whole blood-based novel DNAm biomarkers for the detection of ccRCC, as a major type of RCC, we conducted targeted bisulfite sequencing (TB-seq), which is less expensive than whole-genome bisulfite sequencing (WGBS). We used whole blood DNA from ccRCC patients and matched healthy controls and performed EWAS for ccRCC. Furthermore, to validate the accuracy of the identified whole blood DNAm biomarkers for ccRCC, DNAm analysis and EWAS were performed using whole blood DNA in another independent group of ccRCC patients and controls.
Results
Characteristics of the participants
The overall study design is shown in Fig. 1. The characteristics of individuals in this study are shown in Table 1. In the discovery phase, significant differences (p < 0.05) were observed between the ccRCC and control groups in hemoglobin A1c (HbA1c), total cholesterol (TC), and the number of individuals with dyslipidemia or diabetes. In contrast, the replication phase showed significant differences (p < 0.05) between the ccRCC and control groups in mean estimated glomerular filtration rate (eGFR), HbA1c, high-density lipoprotein cholesterol (HDL), and the number of individuals with chronic kidney disease. Among the participants in this study, ccRCC patients in the discovery phase had undergone surgery at the National Cancer Center (NCC) hospital; thus, pathological information such as cancer stage and tumor size was available. However, pathological information was difficult to obtain for 25% of the ccRCC patients in the replication phase because they had undergone surgery at other hospitals (Table 1). The mean tumor size ± SD for each cancer stage in the discovery group was as follows: stage I, 3.8 ± 1.2 cm; stage II, 7.9 ± 0.8 cm; stage III, 7.2 ± 3.3 cm; stage IV, 7.7 ± 3.7 cm.

Study workflow. In the discovery phase, we compared the differences in DNAm levels in blood-derived DNA of 50 ccRCC patients and 50 TMM controls, and identified CpGs with altered DNAm levels associated with ccRCC (left column). To confirm the accuracy of the ccRCC-associated CpGs found in the discovery phase, we compared the difference in DNAm levels between another 48 ccRCC patients and 48 TMM controls in the replication phase (right column). DNAm, DNA methylation; ccRCC, clear cell renal cell carcinoma; TMM, Tohoku Medical Megabank
Epigenome-wide association study
To identify differentially methylated CpGs associated with ccRCC, we performed epigenome-wide association analysis using a linear regression model. The model was well corrected for sex, age, and cell type composition, with an inflation factor (λ value) of 1.030 (95% confidence interval (CI): 1.027–1.033) (Fig. 2a).

Summary of the results of EWAS in the discovery phase. a Quantile-quantile (QQ) plot. Observed (y-axis) versus expected (x-axis) p-values using a linear regression model. The λ value (inflation factor) was estimated from the median of the observed versus expected p-values. b Manhattan plot. Negative logarithm of the p-values (-log10(p-value)) versus chromosomal positions. Genome-wide significance threshold (red line): Bonferroni corrected p < 1.59 × 10⁻⁸. Suggestive threshold (blue line): p < 1.00 × 10⁻⁶. c Locus zoom plot of the DNAm levels and genetic regulatory elements in PCBD2/MTND4P12 gene. The region of Chr5:134923256-134928594 around the six ccRCC-associated DNAm markers (the region squared by the magenta line) was populated with DNase I hypersensitive sites (DHS), transcription factor binding sites, CCCTC binding factors binding sites. CTCF, CCCTC-binding factor; DHS, DNase I high sensitivity site; TF, transcription factor binding site; EWAS, epigenome-wide association study; DNAm, DNA methylation
In the discovery phase, the results of the EWAS showed 11 CpGs with p-values below the suggestive threshold (p < 1.00 × 10⁻⁶), and six of them were below the significance threshold (p < 1.59 × 10⁻⁸). The six CpGs were located on both the PCBD2 (pterin-4 alpha-carbinolamine dehydratase 2) and MTND4P12 (mitochondrially encoded NADH: ubiquinone oxidoreductase core subunit 4 pseudogene 12) genes on chromosome 5 (Fig. 2b and Additional file 1: Table S1). The region of Chr5:134923256–134928594 around the six ccRCC-associated DNAm markers was densely populated with DNase I hypersensitive sites (DHS), transcription factor binding sites (TFBS), and CCCTC-binding factor (CTCF) binding sites (Fig. 2c). The six CpGs were approximately 10% less methylated in the ccRCC groups than in the Tohoku Medical Megabank (TMM) groups (healthy controls), suggesting that these CpGs are ccRCC-associated (Fig. 3a). The reference interval (RI), defined as the variation in DNAm levels among individuals [22], in the TMM groups was greater than 30% for all six CpGs, indicating that the CpGs varied in DNAm levels among individuals (Additional file 1: Table S1). In addition, in order to determine whether the results of this EWAS were affected by participant characteristics that showed significant differences (p < 0.05; HbA1c, TC, dyslipidemia, and diabetes), an EWAS was conducted with these characteristics added to the correction term. The results showed that the six ccRCC-related CpGs on the PCBD2/MTNT4P12 gene were still associated with ccRCC after correction (p < 0.05; Additional file 1: Table S2).

Box plots with jitter of the DNAm level. Comparison of DNAm levels of six ccRCC-associated CpGs between ccRCC patients and TMM controls in the a discovery phase and b replication phase. p-values were obtained using two-tailed Student's tests (p < 0.05). DNAm, DNA methylation; ccRCC, clear cell renal cell carcinoma; TMM, Tohoku Medical Megabank
In the replication phase, the p-value resulting from the EWAS for ccRCC was not fully corrected for sex, age, and cell-type composition, and the λ value was calculated to be 1.109 (95% CI: 1.104–1.112), indicating a slight inflation (Additional file 2: Fig. S1a). The EWAS results showed the same six CpGs in PCBD2/MTND4P12 below the suggestive threshold; four of the six CpGs were below the significance threshold (p < 3.42 × 10⁻⁸) (Additional file 1: Table S3 and Additional file 2: Fig. S1b). As with the discovery phase, the six CpGs were approximately 10% less methylated in the ccRCC groups than in the TMM groups (Fig. 3b), and the RI was greater than 30% (Additional file 1: Table S3). In addition, in order to determine whether the results of this EWAS were affected by participant characteristics that showed significant differences (p < 0.05; eGFR, HbA1c, HDL, and chronic kidney disease), an EWAS was conducted with these characteristics added to the correction term. The results showed that the six ccRCC-related CpGs on the PCBD2/MTNT4P12 gene were still associated with ccRCC after correction (p < 0.05; Additional file 1: Table S4).
To examine the trends between DNAm levels and cancer stage in the ccRCC-associated DNAm markers, we performed the Jonckheere–Terpstra trend test. There was a significant difference in DNAm levels among the control group and all stages of ccRCC (Additional file 2: Figs. S2 and S3). However, there was no trend among cancer stages both in the discovery and replication phases.
cis-Expression quantitative trait methylation (cis-eQTM) analysis
In the blood-based multi-omics database iMETHYL, we found that there were 56 annotated genes located in the range of one million base pairs upstream or downstream from PCBD2/MTND4P12. The genes whose expression levels were associated with the DNAm levels of the six CpGs in PCBD2/MTND4P12 were examined by cis-eQTM analysis; T cell-specific transcription factor 7 (TCF7) and voltage-dependent anion-selective channel protein 1 (VDAC1) were found to be significantly related (Table 2). TCF7 and VDAC1 were located 0.8 and 0.9 million base pairs upstream from PCBD2/MTND4P12, respectively. The results of eQTM showed that hypermethylation of the CpG located at 134927085 on chromosome 5 was significantly associated with the increased gene expression of TCF7, and hypermethylation of the CpG located at 134927106 on chromosome 5 was associated with the decreased gene expression of VDAC1 (Table 2). In other words, hypomethylation of the CpGs in ccRCC was associated with decreased gene expression of TCF7 and increased gene expression of VDAC1. Meanwhile, cis-eQTM analysis showed that the DNAm levels of the six CpGs had little effect on the gene expression levels of PCBD2/MTND4P12 (Additional file 1: Table S5).
Area under the receiver operating curve (AUC-ROC) analysis
To investigate whether the six identified CpGs are effective DNAm biomarkers for ccRCC detection, we conducted ROC curve analyses using the DNAm level of each of the six CpGs and the sum of their DNAm levels. In the discovery phase, the DNAm level of each of the six CpGs was high enough to detect ccRCC, but the sum of the DNAm levels of the six CpGs showed the best ccRCC detection (AUC-ROC = 0.922) (Table 3 and Fig. 4a). Additionally, the ccRCC detection ability was slightly lower in the replication phase than in the discovery phase when considering the sum of the DNAm levels of the six CpGs, but it was high enough to be reliable (AUC-ROC = 0.871) (Table 3 and Fig. 4b).
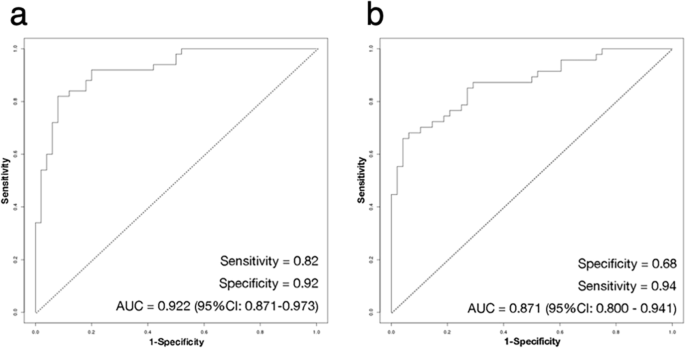
Receiver operating characteristic (ROC) curve plots for sum of DNAm levels of six ccRCC-associated CpGs. a Sum of DNAm levels of the six CpGs of PCBD2/MTND4P12 in ccRCC patients compared with that of TMM controls in the discovery phase. The area under the curve (AUC) is 0.922 (95% CI: 0.871–0.973). b Sum of DNAm levels of the six CpGs in PCBD2/MTND4P12 in ccRCC patients compared with that of TMM controls in the replication phase. The AUC is 0.871 (95% CI: 0.800–0.941). CI, confidence interval; DNAm, DNA methylation; ccRCC, clear cell renal cell carcinoma; TMM, Tohoku Medical Megabank
Discussion
Early detection of ccRCC using minimally invasive screening is very important for patient treatment and survival. In the present study, we identified six CpGs located within PCBD2/MTND4P12 for the first time as whole blood DNAm biomarkers associated with ccRCC using TB-seq and EWAS. Our results not only contribute to the early detection and treatment of ccRCC, but also demonstrate the effectiveness of sequencing-based DNAm analysis in the search for novel cancer-related DNAm biomarkers.
The DNA region containing the ccRCC-associated CpGs identified in this study has not previously been identified as possessing ccRCC-associated CpGs because it is not used in common commercial DNAm microarrays. Furthermore, because there are multiple regions in the human genome that are highly homologous to the PCBD2/MTND4P12 region, it was difficult to design PCR primers specific to this region. However, by utilizing specific probes that can hybridize to the PCBD2/MTND4P12 region, TB-seq analysis was able to avoid the problem that conventional PCR could not amplify this region. Most of the previously reported genome-wide DNAm analyses were performed using microarray technology. Microarray analysis can detect the DNAm levels of CpGs that are loaded on the microarray but cannot detect those that are not loaded. In other words, it is difficult to consider the results of DNAm analysis including the DNAm levels of CpGs that are located around microarray-loaded CpGs but are not loaded on the microarrays. Only 0.8% of previously reported DNAm biomarkers for cancer have been validated, and the high number of false positives for DNAm biomarkers identified by microarray analysis is problematic [15]. In contrast, sequencing-based analysis can detect DNAm markers as “regions,” which heightens the discriminatory power of the biomarker compared with that of a single CpG site. Future applications of sequencing-based DNAm analysis and EWAS to ccRCC as well as various other diseases will allow the identification of new DNAm markers for the early detection of these diseases.
The genomic structure of the region where the six ccRCC-associated CpGs are located includes TFBS and CTCF-binding sites, suggesting that changes in the DNAm level in this region would affect chromatin structure, which in turn could affect gene expression in the vicinity. In fact, the eQTM results of the iMETHYL database revealed that the DNAm levels of PCBD2/MTND4P12 affect the gene expression of VDAC1 and TCF7, which are located 0.8 to 0.9 million base pairs upstream. Located on the plasma and outer mitochondrial membranes, VDAC proteins are associated with the transport of adenine nucleotides [26], calcium ions [27], and several metabolites [28] into and out of mitochondria and cells. Under normal apoptotic stimuli, VDAC1 interacts with the pro-apoptotic protein Bax and other VDAC molecules to oligomerize and inhibit apoptosis by promoting the release of cytochrome c from the mitochondria to the cytosol. Overexpression of VDAC1 has been observed in several cancer cell lines and is thought to be a significant contributing factor in mitochondrial abnormalities in cancer cells, including ccRCC [29,30,31]. The present study supports these results. However, this study did not directly examine the upregulation of VDAC1 gene expression in the blood cells of ccRCC patients, which should be examined in the future.
Meanwhile, TCF7, another eQTM gene identified in this study, encodes the transcription factor T cell factor-1 (TCF1), which has both DNA binding and histone deacetylase (HDAC) activities and plays an important role in the development of multiple lymphoid lineages, including innate lymphoid cells and T cells. TCF1 (TCF7) is involved in the fate of CD8-positive T cells together with the transcription factor LEF1 [32, 33]. Although overexpression of TCF1 (TCF7) has been reported in tumor tissues of several cancer types, including ccRCC [34,35,36], the expression profile of the TCF1 (TCF7) gene in the blood cells of cancer patients has been rarely reported and details are currently unknown. Although a data-driven eQTM analysis, this study provides new insights into TCF1 (TCF7), as, to the best of our knowledge, it is the first to show that the hypomethylation of six CpGs in PCBD2/MTND4P12 is associated with reduced TCF1 (TCF7) gene expression (Table 2 and Additional Data 1: Table S5). However, since we did not analyze expression of the TCF1 (TCF7) gene in the blood cells of ccRCC patients in this study, such an analysis will be necessary in the future.
The main limitation of the present study was its focus on Japanese patients. Whether the ccRCC-associated CpGs are also detectable in other ethnic groups is unclear, and verification of the effectiveness of the identified ccRCC-associated DNAm markers in other ethnic groups is necessary. Furthermore, this study investigated ccRCC only; therefore, it is not possible to distinguish whether the identified ccRCC-associated CpGs are ccRCC-specific or common to other cancers. To clarify this, sequencing-based DNAm analysis and EWAS should be conducted on other cancer types. Although this study identified a blood-based DNAm marker for the detection of ccRCC, changes in the DNAm levels of blood cells do not explain the etiology of ccRCC. Therefore, further studies are needed to reveal why hypomethylation of PCBD2/MTND4P12 occurs in the blood cell DNA of ccRCC patients.
Conclusions
We identified six hypomethylated CpGs in PCBD2/MTND4P12 as DNAm biomarkers for ccRCC by EWAS. Furthermore, we found that the sum of the DNAm levels of these six CpGs provided a more accurate detection of ccRCC. The identified CpGs are novel DNAm biomarkers and may prove useful in the diagnosis of ccRCC. The findings of this study provide insights into new options for the early detection and treatment of ccRCC and the development of ccRCC therapeutics.
Methods
Ethics
The present study was approved by the Ethics Committees of the National Cancer Center (Tokyo, Japan), Keio University, and Iwate Medical University (Approval ID: HG H25-19). All experiments were performed in accordance with the approval guidelines. All participants provided written informed consent.
Study participants and sample collection
The study was divided into two phases: discovery and replication. In the discovery phase, the whole-blood-derived DNA of 50 ccRCC patients was provided by the NCC (Tokyo, Japan), and that of 50 sex- and age-matched healthy controls was provided by the Tohoku Medical Megabank Community-Based Cohort Study (TMM CommCohort) [37]. In the replication phase, the whole-blood-derived DNA from 48 individuals (independent of the discovery phase) was provided by the NCC and TMM CommCohort for the ccRCC and control samples, respectively. All blood samples were collected in EDTA blood collection tubes, and blood-derived DNA was purified using the Gentra Puregene Blood Kit for the NCC samples and QIAGEN Autopure LS for the TMM CommCohort samples. ccRCC was diagnosed by imaging (MRI or CT), as well as microscopic and gross observations by a skilled pathologist. In both phases, the ccRCC and TMM group samples were age-matched within ±2 years, and body mass index (BMI) was matched whenever possible. Individual health checkups and a self-reported questionnaire were used to define smoking status, alcohol consumption status, and prevalent diseases (i.e., chronic kidney disease, hypertension, dyslipidemia, and diabetes). Significance tests on participant characteristics were performed using paired t-tests for numerical values such as laboratory values, and chi-square tests for the number of people such as with disease prevalence.
Preparation of sequencing libraries and TB-seq
Aliquots of genomic DNA (gDNA; 1 μg), eluted in 50 μL of TE buffer, were sheared into 150–200 bp fragments using a Covaris LE220 Focused-ultrasonicator (Thermo-Fisher Scientific, Waltham, MA, USA). Sequencing libraries for TB-seq were prepared using Agilent SureSelect Human Methyl-Seq Capture Library and Reagent Kits on an Agilent Bravo automated library preparation system (Agilent Technologies, Santa Clara, CA, USA) according to the manufacturer's instructions. In the replication phase, we used an Agilent SureSelect Human Methyl-Seq Custom Capture Kit with customized probes (i.e., the common DNA methylation variations (CDMV) [22] probe set). Bisulfite treatment for all sequencing libraries was performed using an EZ DNA Methylation-Gold Kit (Zymo Research, Irvine, CA, USA). The pooled 17-pM libraries were spiked with 20% PhiX Control v3 (Illumina Inc., San Diego, CA, USA) and subjected to paired-end sequencing (2 × 125 bp) on a HiSeq 2500 system (Illumina).
DNA methylation profiling in targeted CpGs
Raw sequencing data were converted to FASTQ format using Illumina bcl2fastq2 Conversion software v2.20. The sequencing quality of the raw data was assessed using FastQC software v0.11.5, adapters were trimmed using Trim Galore software v0.4.2, and short reads (< 20 bp) were removed. The remaining reads were aligned to the Genome Reference Consortium Human Reference 38 (GRCh38) build, downloaded from the UCSC Genome Browser website [38], using Novoalign software v3.6.5. The aligned data were processed using bioinformatics tools, as previously reported [25]. Methylated CpGs were detected by NovoMethyl software v1.4, and the methylation levels in targeted CpGs were calculated as beta values using R software v3.3.1.
Epigenome-wide association study
EWAS was performed using a linear regression model to identify differentially methylated CpGs associated with ccRCC. The analysis was adjusted for age, sex, and the estimated cell-type composition. Cell-type composition was estimated using the estimateCellCounts.R function in the minfi Bioconductor package [39, 40] with modifications. Specifically, instead of using the Illumina Infinium HumanMethylation450 data on sorted blood cell populations implemented in the FlowSorted.Blood.450 k package in Bioconductor, we referred to the DNAm data from six sorted leukocyte populations (B cells, CD4+ T lymphocytes, CD8+ T lymphocytes, monocytes, NK cells, and neutrophils) from the whole-genome bisulfite sequencing of 12 individuals [22, 23] and selected the top 50 CpGs showing hypermethylated and hypomethylated CpGs in each cell type for further analysis. All analyses were conducted under the same conditions in both phases, and the genome-wide suggestive threshold was defined as p < 1.00 × 10⁻⁶; however, the Bonferroni-corrected significance threshold was set to p < 1.59 × 10⁻⁸ (0.05/3145479) in the discovery phase and p < 3.42 × 10⁻⁸ (0.05/1460699) in the replication phase. The statistical analysis scripts used in this study are available on our GitHub website (https://github.com/H-Ohmomo/ccRCC_EWASscript_20220323).
The predictive accuracy of the identified CpGs as whole-blood-based DNAm biomarkers for ccRCC was evaluated by plotting receiver operating characteristic (ROC) curves. Specificity, sensitivity, and the area under the curve (AUC) were calculated based on DNAm levels using ROCR [41] and pROC [42] packages.
To examine trends between DNAm levels of significantly different methylated CpGs for ccRCC and the ccRCC cancer stage, we performed a Jonckheere–Terpstra trend test using the DescTools package [43] in R. A statistically significant difference was defined as Ptrend < 0.05.
Quantitative trait methylation analysis
To evaluate the relationships between ccRCC-associated CpGs and gene expression, we conducted cis-eQTM analyses with a simple linear regression model using the iMETHYL database [44]. The expression levels [log10(FPKM + 0.1)] of each protein-coding gene were specified as dependent variables, and the DNAm levels of each ccRCC-associated CpG site were specified as independent variables. The neighborhood (cis) was defined as the area within 1 million base pairs upstream or downstream of the ccRCC-related CpGs.
Availability of data and materials
To protect the privacy of participants, DNA methylation information for each individual cannot be disclosed. However, summary statistics of DNA methylation information will be made available in the iMETHYL database (http://imethyl.iwate-megabank.org) after acceptance of this paper.
Abbreviations
- AUC-ROC:
-
Area under the receiver operating characteristic curve
- ccRCC:
-
Clear cell renal cell carcinoma
- CTCF:
-
CCCTC-binding factor
- CDMV:
-
Common DNA methylation variations
- Chr:
-
Chromosome
- CIMP-RCC:
-
CpG island methylator phenotype-RCC
- CpGs:
-
Cytosine–guanine nucleotides
- CT:
-
Computed tomography
- DNAm:
-
DNA methylation
- eGFR:
-
Estimated glomerular filtration rate
- eQTM:
-
Expression quantitative trait methylation
- EWAS:
-
Epigenome-wide association study
- FPKM:
-
Fragments Per Kilobase of exon per Million mapped reads
- gDNA:
-
Genomic DNA
- GRCh38:
-
Genome Reference Consortium Human Reference 38
- MRI:
-
Magnetic resonance imaging
- RCC:
-
Renal cell carcinoma
- RI:
-
Reference interval
- TB-Seq:
-
Targeted-bisulfite sequencing
- TFBS:
-
Transcription factor binding sites
- TMM CommCohort:
-
Tohoku Medical Megabank Community-Based Cohort
- WGBS:
-
Whole-genome bisulfite sequencing
References
International Agency for Research on Cancer. Global Cancer Observatory (GCO). http://gco.iarc.fr/. Accessed 10 Nov 2021.
Vincent T Jr, DeVita TS, SAR L. DeVita, Hellman, and Rosenberg’s cancer: principles & practice of oncology (Cancer Principles and Practice of Oncology). 11th ed. WOLTERS KLUWER; 2019.
Moch H, Cubilla AL, Humphrey PA, Reuter VE, Ulbright TM. The 2016 WHO classification of tumours of the urinary system and male genital organs—part a: renal, penile, and testicular tumours. Eur Urol. 2016;70(1):93–105. https://doi.org/10.1016/j.eururo.2016.02.029.
American Cancer Society. Cancer Facts & Figures 2017. Atlanta, GA. https://www.cancer.org/research/cancer-facts-statistics/all-cancer-facts-figures/cancer-facts-figures-2017.html. Accessed 10 Nov 2021.
Linehan WM, Srinivasan R, Schmidt LS. The genetic basis of kidney cancer: a metabolic disease. Nat Rev Urol. 2010;7(5):277–85. https://doi.org/10.1038/nrurol.2010.47.
Haas NB, Nathanson KL. Hereditary kidney cancer syndromes. Adv Chronic Kidney Dis. 2014;21(1):81–90. https://doi.org/10.1053/j.ackd.2013.10.001.
Purdue MP, Johansson M, Zelenika D, et al. Genome-wide association study of renal cell carcinoma identifies two susceptibility loci on 2p21 and 11q13 . 3. Nat Genet. 2011;43(1):60–5. https://doi.org/10.1038/ng.723.
Wu X, Scelo G, Purdue MP, et al. A genome-wide association study identifies a novel susceptibility locus for renal cell. Hum Mol Genet. 2012;21(2):456–62. https://doi.org/10.1093/hmg/ddr479.
Gudmundsson J, Sulem P, Gudbjartsson DF, et al. A common variant at 8q24.21 is associated with renal cell cancer. Nat Commun. 2013;4:2776. https://doi.org/10.1038/ncomms3776.
Henrion M, Frampton M, Scelo G, et al. Common variation at 2q22.3 (ZEB2) influences the risk of renal cancer. Hum Mol Genet. 2013;22(4):825–31. https://doi.org/10.1093/hmg/dds489.
Henrion MYR, Purdue MP, Scelo G, Broderick P. Common variation at 1q24.1 (ALDH9A1) is a potential risk factor for renal cancer. PLoS One. 2015;10(3):e0122589. https://doi.org/10.1371/journal.pone.0122589.
Bigot P, Colli LM, Machiela MJ, et al. Functional characterization of the 12p12.1 renal cancer-susceptibility locus implicates BHLHE41. Nat Commun. 2016;7:12098. https://doi.org/10.1038/ncomms12098.
Arai E, Gotoh M, Tian Y, et al. Alterations of the spindle checkpoint pathway in clinicopathologically aggressive CpG island methylator phenotype clear cell renal cell carcinomas. Int J Cancer. 2015;137(11):2589–606. https://doi.org/10.1002/ijc.29630.
Ricketts CJ, De Cubas AA, Fan H, et al. The cancer genome atlas comprehensive molecular characterization of renal cell carcinoma. Cell Rep. 2018;23:313–326.e5. https://doi.org/10.1016/j.celrep.2018.03.075.
Koch A, Joosten SC, Feng Z, et al. Analysis of DNA methylation in cancer: location revisited. Nat Rev Clin Oncol. 2018;15(7):459–66. https://doi.org/10.1038/s41571-018-0004-4.
Arai E, Ushijima S, Tsuda H, et al. Genetic clustering of clear cell renal cell carcinoma based on array-comparative genomic hybridization: its association with DNA methylation alteration and patient outcome. Clin Cancer Res. 2008;14(17):5531–9. https://doi.org/10.1158/1078-0432.CCR-08-0443.
Arai E, Chiku S, Mori T, et al. Single-CpG-resolution methylome analysis identifies clinicopathologically aggressive CpG island methylator phenotype clear cell renal cell carcinomas. Carcinogenesis. 2012;33(8):1487–93. https://doi.org/10.1093/carcin/bgs177.
Creighton CJ, Morgan M, Gunaratne PH, et al. Comprehensivemolecular characterization of clear cell renal cell carcinoma. Nature. 2013;499(7456):43–9. https://doi.org/10.1038/nature12222.
National Cancer Institute Center for Cancer Genomics. Genomic Data Commons (GDC). https://gdc.cancer.gov/. Accessed 10 Nov 2021.
National Genomics Data Center CNC for B. EWAS Data Hub. https://bigd.big.ac.cn/ewas/datahub/index. Accessed 10 Nov 2021.
Pidsley R, Zotenko E, Peters TJ, et al. Critical evaluation of the Illumina MethylationEPIC BeadChip microarray for whole-genome DNA methylation profiling. Genome Biol. 2016;17(1):208. https://doi.org/10.1186/s13059-016-1066-1.
Hachiya T, Furukawa R, Shiwa Y, et al. Genome-wide identification of inter-individually variable DNA methylation sites improves the efficacy of epigenetic association studies. NPJ Genom Med. 2017;2:11. https://doi.org/10.1038/s41525-017-0016-5.
Komaki S, Ohmomo H, Hachiya T, et al. An epigenome-wide association study based on cell type-specific whole-genome bisulfite sequencing: Screening for DNA methylation signatures associated with bone mass. Integr Mol Med. 2017;4(5):1–7. https://doi.org/10.15761/imm.1000307.
Nasu T, Satoh M, Ohmomo H, et al. Epigenome-wide association study identifies a novel DNA methylation in patients with severe aortic valve stenosis. Circ Genomic Precis Med. 2020;13(1):e002649. https://doi.org/10.1161/CIRCGEN.119.002649.
Ohmomo H, Komaki S, Ono K, et al. Evaluation of clinical formalin-fixed paraffin-embedded tissue quality for targeted-bisulfite sequencing. Pathol Int. 2021;71(2):135–40. https://doi.org/10.1111/pin.13054.
Rostovtseva T, Colombini M. ATP flux is controlled by a voltage-gated channel from the mitochondrial outer membrane. J Biol Chem. 1996;271(45):28006–8. https://doi.org/10.1074/jbc.271.45.28006.
Gincel D, Zaid H, Shoshan-Barmatz V. Calcium binding and translocation by the voltage-dependent anion channel : a possible regulatory mechanism in mitochondrial function. Biochem J. 2001;358(1):147–55. https://doi.org/10.1042/0264-6021:3580147.
Hodge T, Colombini M. Regulation of metabolite flux through voltage-gating of VDAC channels. J Membr Biol. 1997;157(3):271–9. https://doi.org/10.1007/s002329900235.
Shinohara Y, Ishida T, Hino M, Yamazaki N, Baba Y, Terada H. Characterization of porin isoforms expressed in tumor cells. Eur J Biochem. 2000;267(19):6067–73. https://doi.org/10.1046/j.1432-1327.2000.01687.x.
Grills C, Jithesh PV, Blayney J, Zhang SD, Fennell DA. Gene expression meta-analysis identifies VDAC1 as a predictor of poor outcome in early stage non-small cell lung cancer. PLoS One. 2011;6(1):e14635. https://doi.org/10.1371/journal.pone.0014635.
Fabbri L, Dufies M, Lacas-Gervais S, et al. Theranostics Identification of a new aggressive axis driven by ciliogenesis and absence of VDAC1- Δ C in clear cell Renal Cell Carcinoma patients. Theranostics. 2020;10(6):2696–713. https://doi.org/10.7150/thno.41001.
Xing S, Li F, Zeng Z, et al. Tcf1 and Lef1 transcription factors establish CD8(+) T cell identity through intrinsic HDAC activity. Nat Immunol. 2016;17(6):695–703. https://doi.org/10.1038/ni.3456.
Raghu D, Xue HH, Mielke LA. Control of lymphocyte fate, infection, and tumor immunity by TCF-1. Trends Immunol. 2019;40(12):1149–62. https://doi.org/10.1016/j.it.2019.10.006.
Nikuševa-Martić T, Serman L, Zeljko M, et al. Expression of secreted frizzled-related protein 1 and 3, T-cell factor 1 and lymphoid enhancer factor 1 in clear cell renal cell carcinoma. Pathol Oncol Res. 2013;19(3):545–51. https://doi.org/10.1007/s12253-013-9615-3.
Xu X, Liu Z, Tian F, Xu J, Chen Y. Clinical significance of transcription factor 7 (TCF7) as a prognostic factor in gastric cancer. Med Sci Monit. 2019;25:3957–63. https://doi.org/10.12659/MSM.913913.
Zhan Y, Feng J, Lu J, Xu L, Wang W, Fan S. Expression of LEF1 and TCF1 (TCF7) proteins associates with clinical progression of nasopharyngeal carcinoma. J Clin Pathol. 2019;72:425–30. https://doi.org/10.1136/jclinpath-2019-205698.
Hozawa A, Tanno K, Nakaya N, et al. Study profile of the Tohoku Medical Megabank community-based cohort study. J Epidemiol. 2021;31(1):65–76. https://doi.org/10.2188/jea.JE20190271.
Genomics Institute U of CAC. UCSC Genome Browser. https://hgdownload.soe.ucsc.edu/downloads.html. Accessed 10 Nov 2021.
Houseman EA, Accomando WP, Koestler DC, et al. DNA methylation arrays as surrogate measures of cell mixture distribution. BMC Bioinformatics. 2012;13:86. https://doi.org/10.1186/1471-2105-13-86.
Link C, Jaffe AE, Irizarry RA. Accounting for cellular heterogeneity is critical in epigenome-wide association studies The Harvard community has made this article openly available . Accounting for cellular heterogeneity is critical in epigenome-wide association studies. Genome Biol. 2014;15(2):R31. https://doi.org/10.1186/gb-2014-15-2-r31.
Sing T, Sander O, Beerenwinkel N, Lengauer T. ROCR: Visualizing classifier performance in R. Bioinformatics. 2005;21(20):3940–1. https://doi.org/10.1093/bioinformatics/bti623.
Robin X, Turck N, Vutskits L, et al. pROC: an open-source package for R and S+ to analyze and compare ROC curves. BMC Bioinformatics. 2011;12:77. https://doi.org/10.1186/1471-2105-12-77.
Signorell A. DescTools: tools for descriptive statistics. https://cran.r-project.org/web/packages/DescTools/. Accessed 23 May 2022.
Komaki S, Shiwa Y, Furukawa R, et al. iMETHYL: an integrative database of human DNA methylation, gene expression, and genomic variation. Hum Genome Var. 2018;5:18008. https://doi.org/10.1038/hgv.2018.8.
Acknowledgements
The authors thank Kumi Furusawa and Miyuki Horie for their help with the experiments in the present study. We would like to express our deepest gratitude to all participants of the Tohoku Medical Megabank Community-Based Cohort (TMM CommCohort) Study. We would also like to thank the members of the Iwate Tohoku Medical Megabank Organization of Iwate Medical University and the Tohoku Medical Megabank Organization of Tohoku University for their support and encouragement.
Funding
This study was supported by the Japan Agency for Medical Research and Development (AMED; grant numbers JP17km0105003 and JP17km0105004).
Author information
Authors and Affiliations
Contributions
Conception and design: HO, EA, YK, and AS. Acquisition of data: HO, SK, and KO. Analysis and interpretation of data: HO, SK, YS, TH, KA, and AS. Writing, review, and/or revision of the manuscript: All authors. Administrative, technical, or material support: EA, HF, TY, and YK. Study supervision: MS and AS. The author(s) read and approved the final manuscript.
Corresponding author
Ethics declarations
Ethics approval and consent to participate
The present study was approved by the Ethics Committees of the National Cancer Center (Tokyo, Japan), Keio University, and Iwate Medical University (Approval ID: HG H25-19). All participants provided written informed consent.
Consent for publication
Not applicable.
Competing interests
The authors declare that they have no competing interests.
Additional information
Publisher’s Note
Springer Nature remains neutral with regard to jurisdictional claims in published maps and institutional affiliations.
Supplementary Information
Additional file 1: Table S1.
Whole blood-based differentially methylated CpGs (p < 1.00 × 10⁻⁵) between ccRCC patients and healthy controls in the discovery phase. Chr, chromosome; ccRCC, clear cell renal cell carcinoma; TSS, transcription start site; CR, call rate; RI, reference interval; coef, coefficient; SE, standard error; RSQ, R-squared. Table S2. Significant differentially methylated CpGs for ccRCC adjusted by age, sex, cell-type composition, HbA1c, total cholesterol, dyslipidemia, and diabetes in the discovery phase. Chr, chromosome; ccRCC, clear cell renal cell carcinoma; CR, call rate; RI, reference interval; coef, coefficient; SE, standard error; RSQ, r-squared; HbA1c, hemoglobin A1c. Table S3. Whole blood-based differentially methylated CpGs (p < 1.00 × 10⁻⁵) between ccRCC patients and healthy controls in the replication phase. Chr, chromosome; ccRCC, clear cell renal cell carcinoma; TSS, transcription start site; TMM, controls; CR, call rate; CI, confidence interval; RI, reference interval; coef, coefficient; SE, standard error; RSQ, R-squared. Table S4. Significant differentially methylated CpGs for ccRCC adjusted by age, sex, cell-type composition, HbA1c, total cholesterol, dyslipidemia, and diabetes in the replication phase. Chr, chromosome; ccRCC, clear cell renal cell carcinoma; CR, call rate; RI, reference interval; coef, coefficient; SE, standard error; RSQ, r-squared; HbA1c, hemoglobin A1c. Table S5. Results of blood-based cis-eQTM analysis (p < 0.05) for PCBD2/MTND4P12 using the iMETHYL database.
Additional file 2: Supplementary Figure S1.
Summary of the results of EWAS in the replication phase. A, Observed (y-axis) versus expected (x-axis) p-values using a linear regression model. The λ value (inflation factor) was estimated from the median of the observed versus expected p-values. B, Manhattan plot. Negative logarithm of the p-values (-log10(p-value)) versus chromosomal positions. Genome-wide significance threshold (red line): Bonferroni corrected p < 3.42 × 10⁻⁸. Suggestive threshold (blue line): p < 1.00 × 10⁻⁶. EWAS, epigenome-wide association study. Supplementary Figure S2. Comparison of the DNAm level of each of the six CpGs and the sum of their DNAm levels between healthy controls and ccRCC cancer stages in the discovery phase. A, Chromosome (Chr) 5, position 134927030; B, Chr 5, position 134927034; C, Chr5, position 134927079; D, Chr5, position 134927085; E, Chr5, position 134927103; F, Chr5, position 134927106; G, sum of DNAm levels in the six CpGs. Ptrend values were obtained using the Jonckheere–Terpstra trend test. ccRCC, clear cell renal cell carcinoma; DNAm, DNA methylation. Supplementary Figure S3. Comparison of the DNAm level of each of the six CpGs and the sum of their DNAm levels between healthy controls and ccRCC cancer stages in the replication phase. A, Chromosome (Chr) 5, position 134927030; B, Chr 5, position 134927034; C, Chr 5, position 134927079; D, Chr 5, position 134927085; E, Chr 5, position 134927103; F, Chr 5, position 134927106; G, sum of DNAm levels in the six CpGs. Ptrend values were obtained using the Jonckheere–Terpstra trend test. ccRCC, clear cell renal cell carcinoma; DNAm, DNA methylation.
Rights and permissions
Open Access This article is licensed under a Creative Commons Attribution 4.0 International License, which permits use, sharing, adaptation, distribution and reproduction in any medium or format, as long as you give appropriate credit to the original author(s) and the source, provide a link to the Creative Commons licence, and indicate if changes were made. The images or other third party material in this article are included in the article's Creative Commons licence, unless indicated otherwise in a credit line to the material. If material is not included in the article's Creative Commons licence and your intended use is not permitted by statutory regulation or exceeds the permitted use, you will need to obtain permission directly from the copyright holder. To view a copy of this licence, visit http://creativecommons.org/licenses/by/4.0/. The Creative Commons Public Domain Dedication waiver (http://creativecommons.org/publicdomain/zero/1.0/) applies to the data made available in this article, unless otherwise stated in a credit line to the data.
About this article

Cite this article
Ohmomo, H., Komaki, S., Sutoh, Y. et al. Potential DNA methylation biomarkers for the detection of clear cell renal cell carcinoma identified by a whole blood-based epigenome-wide association study. Epigenetics Commun. 2, 2 (2022). https://doi.org/10.1186/s43682-022-00009-7
Received:
Accepted:
Published:
DOI: https://doi.org/10.1186/s43682-022-00009-7