Our study was designed to correlate the degree of parenchymal affection in idiopathic interstitial pneumonia using visual and semi-quantitative HRCT assessment with pulmonary function test results.
The study involved 50 patients diagnosed as idiopathic interstitial pneumonia. They were referred from a chest outpatient clinic to the Radiology Department in the Faculty of Medicine, Cairo University for HRCT assessment in the period from January 2017 to March 2019. Variable lung parenchymal affection was studied using HRCT and variable post acquisition processing (multi-planar reconstruction, volumetric assessment, 3D color-coded images).
Results
Usual interstitial pneumonia was the most common type of IP, found in approximately 40 patients (80% of cases) followed by nonspecific interstitial pneumonia found in 5 patients (10% of cases) and lymphocytic interstitial pneumonia found in 3 patients (6% of cases), and desquamative interstitial pneumonia was the least common type of IP, found only in 2 patients (4% of cases).
Honeycombing was significantly correlated with FVC%, FEV1%, and FEV1/FVC% (p = 0.013, p = <0.001, p = 0.002 respectively). Also, reticular was significantly correlated with FVC% (p = 0.041).
Conclusion
Semi-quantitative image analysis, including the use of machine learning, provides a great deal of promise in the ILD field; such methods may be used together with visual analysis to obtain the most accurate diagnostic and prognostic information.
Summary/keywords
HRCT is most sensitive in the detection of ILD than chest radiography or conventional chest computed tomography (CT). Advances in HRCT scanning and interpretation have facilitated and improved accuracy for use in diagnosing idiopathic pulmonary fibrosis (IPF), eliminating the need for a surgical biopsy in many patients. Consequently, HRCT scans became sufficient to allow a confident IPF diagnosis
It is important to note that there are potential differences in interpretation of HRCT patterns between thoracic radiologists. However, these differences seem to be in general within a clinically acceptable range of observer variation and can be partially mitigated by review of difficult cases at ILD referral centers.
Semi-quantitative CT assessment is increasingly being used in ILD to identify pulmonary abnormalities and diagnose specific ILDs; recent studies showed that outcomes of computer-assisted imaging can be correlated with lung function tests and degree of dyspnea and functional disability
This study was designed to correlate the degree of parenchymal affection in IP using visual and semi-quantitative HRCT assessment with PFT results. Semi-quantitative imaging, including color-coded images (HU related), is a new and promising approach in the field of ILD diagnosis and prognosis.
High-resolution computed tomography (HRCT) is the most sensitive method for the detection of interstitial lung disease than chest radiography or conventional chest computed tomography (CT) [1]. Advances in HRCT scanning and interpretation have facilitated improved accuracy for use in diagnosing interstitial pulmonary fibrosis [2].
Since HRCT examination is not an invasive technique, semi-quantitative HRCT is used in evaluating the extent of lung damage and disease extension [3, 4].
Surgical lung biopsy is difficult in many cases, and consequently, efforts are being made to limit the need for this measure to reach a diagnosis (e.g., by considering clinical and radiographic features as well as PFT) [5].
HRCT may be used to identify sites for bronchoalveolar lavage and lung biopsy, guide treatment strategies, and predict treatment outcomes [6].
Identification of a UIP pattern on HRCT is one of the main diagnostic criteria for this ILD [7], which is characterized by bilateral peripheral subpleural reticular opacities, often associated with traction bronchiectasis and honeycombing [8].
The extent of honeycombing and reticulation has been used as a predictor of mortality in patients with idiopathic pulmonary fibrosis (IPF) [9]. Patients presenting with a UIP pattern have a worse prognosis than those without, highlighting the potential importance of identifying this HRCT pattern [10].
Honeycombing is a feature of established fibrosis and is considered as an important criterion when diagnosing UIP and IPF, although recent evidence suggests that honeycombing may not be required for an HRCT-based diagnosis of IPF in selected patients. This highlights the importance of considering the presence/absence of multiple features of fibrosis when examining HRCT images [11].
It is important to note that there are potential differences in interpretation of HRCT patterns between thoracic radiologists [12]. However, these differences seem to be in general within a clinically acceptable range of observer variation and can be partially mitigated by review of difficult cases at ILD referral centers [12].
Classification and quantification of interstitial lung disease is difficult, and even experienced chest radiologists frequently struggle with differential diagnosis. The development of semi-quantitative CT-based measures for lung fibrosis has been more challenging [13].
The purpose of the effort to develop software for analysis of thoracic HRCT is to provide a reproducible way to quantify and characterize the extent of diffuse parenchymal disease [13].
Semi-quantitative HRCT analysis paired with visual analysis may reduce variability in results [9].
Quantitative imaging techniques are of limited accuracy as it is restricted to descriptors such as mild, moderate, or severe, or reporting imaging outcomes to the nearest 5, 10, 15, 20, or 25% [14].
Semi-quantitative imaging, including color-coded images (HU related), is a new and promising approach in the field of ILD diagnosis and prognosis [15].
Automated textural analysis utilizes a machine-learning approach to develop a predictive model for CT patterns and analyses and can be used, for example, to quantify fibrosis based on textural patterns for ground glass opacification, honeycombing, and reticulation which was shown to be predictive of disease progression and patient survival [14].
Semi-quantitative imaging is increasingly being used in ILD to identify pulmonary abnormalities and diagnose specific ILDs; recent studies showed that outcomes of computer-assisted imaging can be correlated with lung function tests and degree of dyspnea and functional disability [16].
This study was designed to correlate the degree of parenchymal affection in idiopathic interstitial pneumonia (IIP) using visual and semi-quantitative HRCT assessment with PFT result correlation.
Methods
This cross-section study included 50 patients (43 females, 7 males) with age ranging from 35 to 68 years (mean age of 50.23 years) diagnosed with interstitial lung disease, referred from the Chest Department in the Faculty of Medicine Cairo University. HRCT was done to all patients as requested. The study was conducted from January 2017 till March 2019.
Inclusion criteria
Inclusion criteria are pathologically proven cases of interstitial pneumonia.
Exclusion criteria
Exclusion criteria are pregnant females, patients presenting with acute chest infection symptoms and consolidation, and acute exacerbation of interstitial lung disease.
Methods
All enrolled patients were subjected to the following:
1-
Thorough clinical examination with history taking and general and chest examination.
2-
Pulmonary function test (spirometers PFT with emphasis on FVC%, FEV1%, and FEV1/FVC% to all 50 patients).
PFTs were performed within 1 month before or after HRCT scans.
It included spirometry and measurement of DLco. Forced expiratory volume in 1 s (FEV1) and forced vital capacity (FVC) were measured according to standard techniques, and the ratio of FEV1 to FVC (FEV1/FVC) was obtained. Values for each PFT except FEV1/FVC were expressed as percentages or predicative values.
In restrictive lung disease, both forced expiratory volume in 1 s (FEV1) and forced vital capacity (FVC) are reduced; however, the decline in FVC is more than that of FEV1, resulting in a higher than 80% FEV1/FVC ratio.
3-
HRCT chest was done to all patients using (Toshiba) 16-channel MSCT in Kasr Al-Ainy. Reconstructed axial, coronal, and sagittal images were taken from all patients; also complementary mediastinal images were taken (see Table 1 for HRCT technique used in this study).
Then, the images acquired were sent to a separate workstation to be processed, manipulated, and reconstructed.
Reconstruction of the images was done using different reconstruction software available at the workstation.
Several reconstruction techniques were done, each of them aiming for a certain diagnostic achievement as follows:
Images are reconstructed in axial, coronal, and sagittal planes to detect the distribution of parenchymal affection.
The total lung volume and the volume of the different type of parenchymal affection (honeycombing, reticulation, ground glass) is calculated separately to be changes to percentage.
2.
Volumetric assessment
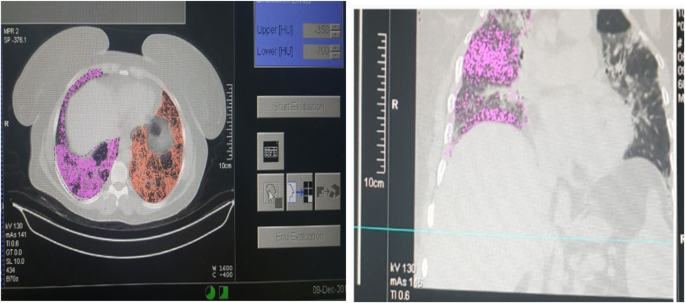
Volumes for all parenchymal density (normal lung, emphysema, ground glass opacification, reticular pattern, and honeycombing) were converted into a percentage of the total lung volume (Fig. 1).
3.
VR (3 colors, 3D volume rendering lung images)
Fig. 1
Volumes of different parenchymal densities were converted into a percentage compared to the total lung volume
Images were sent to the workstation to be processed using software; axial and three-dimensional models of the lungs were reconstructed. Threshold limits of − 200 to − 1024 HU were applied to exclude soft tissue surrounding the lung and large vessels within the lung
In axial images, the attenuation coefficient of each pixel was generated and presented in a specific color.
After the lung density analysis preset was selected, the lungs were automatically segmented from the chest wall, mediastinum, airways, and vessels.
Segmentation is image analysis; it is often essential to distinguish the object of interest from the rest of the image, usually referred to as the background.
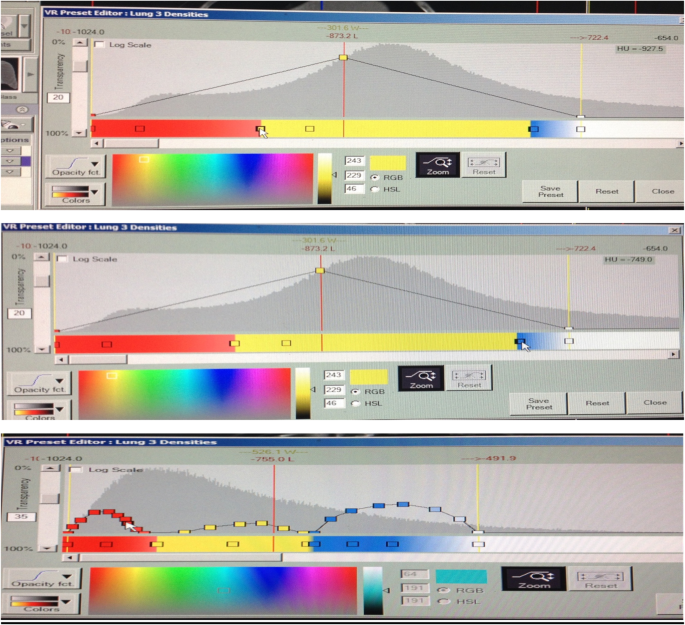
This software automatically analyses the density distribution of the lungs into different colors by using color mask tool, by entering the density range, selecting the desired color, which indicates the area that the HU ranges occupy in the image.
HAAs were defined as areas in lung fields with CT values ranging from − 200 to − 600 HU and LAAs less than − 960 HU, while in the normal lung the CT values range from − 700 to − 950 HU.
LAAs were indicative of emphysematous patches and honeycombing. To extract honeycombing from LAAs, areas of honeycombing were defined as LAA clusters, with visual assessment rechecking from the source axial images.
The red color was selected (or any other color) for voxels with a density lower than − 900/− 950 HU (LAA) and the blue color (or any other color) for voxels with a density between − 500 and − 700 HU (HAA) and the yellow color (or any other color) for voxels with a density between − 700 to − 950 HU (normal aerated lung) (Fig. 2).
Data were coded and entered using the statistical package SPSS (Statistical Package for the Social Sciences) version 25. Data was summarized using mean, standard deviation, median, minimum, and maximum in quantitative data and using frequency (count) and relative frequency (percentage) for categorical data. Comparisons between quantitative variables were done using the non-parametric Mann-Whitney test [17]. For comparing categorical data, the chi-square (χ2) test was performed. The exact test was used instead when the expected frequency is less than 5 [18]. Correlations between quantitative variables were done using Spearman correlation coefficient [19]. P values less than 0.05 were considered as statistically significant.
Results
This cross-section study included 50 patients (43 females, 7 males) with age ranging from 35 to 68 years (mean age of 50.23 years), diagnosed with interstitial lung disease. They were referred from the chest unit to perform HRCT in the Radiology Department, Cairo University.
The most common symptom was dyspnea found in 38 patients (76% of cases), followed by chronic cough found in 22 patients (44% of cases ) and chest pain found in 18 patients (36% of cases ) as shown in Table 2.
Table 2 Distribution of the chest main symptoms in the studied cases
In the studied 50 patients with interstitial pneumonia, UIP was the most common type of IP, found in approximately 40 patients (80% of cases) followed by nonspecific interstitial pneumonia (NSIP) found in 5 patients (10% of cases) and LIP found in 3 patients (6% of cases) and desquamative interstitial pneumonia (DIP) was the least common type of IIP, found in 2 patients (4% of cases).
Following HRCT performance in the 50 patients, the volume of each area of abnormal parenchymal affection was measured using a quantification result of automated system (QCT). The most common finding was normal lung % (mean 23.93 ), followed by ground glass % (GGO) (mean 22.59), emphysema % (EMPH) (mean 20.94), reticular opacities % (RO) (mean 18.25), and the least common was honeycombing % (HC) (mean 14.30) (Table 3).
Table 3 The quantification of various parenchymal changes in IP patients using automated system (QCT)
Normal lung was mostly founded in NSIP (mean 36.50) and least found in UIP (mean 21.15); ground glass was mainly found in UIP and NSIP (mean 23.09, 23.21 respectively) and least found in LIP (mean 16.70); honeycombing was mostly found in UIP and LIP (mean 14.88, 14.73 respectively) and least found in DIP (mean 9.02); reticular opacities were mostly found in DIP (mean 21.24) and least found in NSIP (mean 14.04); and emphysema was mostly found in UIP (mean 22.09) and least found in NSIP (Table 4).
Table 4 Distribution of honeycombing, ground glass, reticular, emphysema, and normal lung derived from all CT slices by QCT according to IIP types
There was a significant correlation between volume of honeycombing % and FVC%, FEV1 and FEV1/FVC% (p = 0.013, p = <0.001, p = 0.002 respectively).
Also, reticulation volume % was significantly correlated with FEV1/FVC% (p = 0.041).
Normal lung volume % was significantly correlated with FVC%, FEV1, and FEV1/FVC% (p = 0.011, p = <0.001, p = <0.001 respectively), while ground glass and emphysema volume % showed to be insignificantly correlated with PFT (
Table 6 Correlation between different pulmonary affection (honeycombing, ground glass, reticulation, emphysema, normal lung) using quantitative CT analysis and PFTs
There was a significant correlation between FEV1/FVC% and honeycombing as well as reticular opacities (see
Fig. 3
a Correlation between FEV1/FVC% and Reticular opacities showing that there is significant correlation. b Correlation between FEV1/FVC% and honeycombing showing that there is significant correlation
There was a significant correlation between FEV1/ FVC% and the normal lung.
Discussion
IIPs as one of ILD include a subset of diffuse lung diseases [1].
The characteristic HRCT findings of reticular abnormality and honeycombing with basal and peripheral predominance are virtually diagnostic in the correct clinical context of UIP [20].
Quantitative CT analysis can be used as an objective tool for quantitative evaluation of disease extent [21]. It can be used to quantify fibrosis based on textural patterns for ground glass opacification, honeycombing, and reticulation [22].
This study involved 50 patients, referred to the Radiology Department at kasr Al-Ainy hospital from the chest outpatient clinic, with chronic chest complaint (dyspnea, dry cough, chest pain, finger clubbing). They were diagnosed as interstitial pneumonia. HRCT was done to all cases in the period between April 2017 and January 2019.
The mean age of the studied patients was 50.23 years with female predominance 86.7%.
The main clinical symptoms of our patient were as follows: dyspnea (76.7% of cases), chronic cough (43.3% of cases), and chest pain (36.7% of cases). We noted dyspnea was the commonest clinical symptom which was in agreement with the study done by Bonini et al. [23] who noted that dyspnea was one of the most common and disabling symptom in patients with ILD.
In the current study, among 50 cases of IIP, 40 cases were diagnosed as UIP, 5 cases as NSIP, 3 cases as LIP, and 2 cases as DIP according to HRCT-specific findings.
It was noted that usual interstitial pneumonia is the most common type of IIP 80%, which agreed with Koelsch et al. [24] who studied the idiopathic interstitial pneumonia according to its radiological findings, and agreed with Tanaka et al. [25] who studied the Update on Rare Idiopathic Interstitial Pneumonias according to histologic patterns; they both claim that UIP is the most common type of IIP.
In this study using color-coded images and semi-quantitative assessment of different HU allowed more objective evaluation of the degree of variable parenchymal affection in different interstitial lung disease.
Correlating the results of semi-quantitative CT assessment of parenchymal changes in interstital lung disease and PFT results showed the great advance in HRCT attribution in the accurate diagnosis and prognosis of interstitial lung disease.
As well as color-coded images allowed definite diagnosis of early diffuse ground glass opacification which used to be a subjective diagnosis.
Semi-quantitative CT assessment of honeycombing, ground glass, reticular opacities, emphysema, and normal lung showed the mean total volume of normal lung, ground glass, emphysema, reticulation, and honeycombing to be 21.15, 23, 22.09, 18.7, and 14.88, respectively. which is matching to result of Yagihashi study who found reticulation, ground glass, and honeycombing mean volume of 30.1, 21, and 9.1 respectively [26].
The honeycombing is considered the most specific sign of UIP as we noted honeycombing mostly found in UIP than other types of IIP [27] (Fig. 4).
Fig. 4
A 48-year-old female patient presenting with dry cough. Diagnosed as UIP. HRCT axial lung and color-coded image, showing bilateral subpleural ground glass opacification, reticulation, and honeycombing. Area of ground glass opacification and reticulation appear green with microcystic honeycombing appearing as small deep blue lucincies within (ground glass and reticulation ranging above − 750 HU, and honeycombing ranging below − 900 HU), and normal lung appears blue (range HU between − 750 and − 900 HU)
NSIP is characterized by predominantly basal ground glass opacity and reticular pattern, often with traction bronchiectasis [28] (Fig. 5).
Fig. 5
A 40-year-old female patient, diagnosed as NSIP (reported case of scleroderma). HRCT axial lung and color-coded density images showing bilateral fairly symmetrical subpleural ground glass opacification and reticulation with minimal traction bronchiolectatic change with dilated pulmonary artery and pericardial effusion. Color-coded images allowed better evaluation of area reticulation and honeycombing (yellow color) for HU above − 750 and blue color for normal lung ranging between − 750 and − 900 HU
In our study, in patients with NSIP, we noted ground glass pattern opacities are the most common QCT finding (mean 23) and honeycombing is the least common finding (mean 6.1) (Fig. 6). Escalon et al. agreed with our result; he noted that NSIP is characterized by symmetric lower lobe predominant ground glass abnormality and honeycombing is a rare finding in NSIP [29].
Fig. 6
A 42-year-old female patient with long history of dry cough. Diagnosed as fibrotic type NSIP. HRCT axial lung and color-coded image, showing bilateral subpleural ground glass opacification, reticulation, and minimal microcystic honeycombing. Area of ground glass opacification and reticulation appears green with microcystic honeycombing appearing as small deep blue lucencies within (ranging above − 750 HU), and normal lung appears blue (ranging HU between − 750 and − 900 HU)
LIP in our study had the least QCT finding of honeycombing (mean 5.6) which is in agreement with Kokosi et al., who noted honeycomb change is notably rare or absent in LIP [30] (Fig. 7).
Fig. 7
A 38-year-old female patient, presented with collagen vascular disease and progressive dysnea. Diagnosed as LIP. HRCT axial lung and color-coded density images showing bilateral fairly symmetrical subpleural ground glass opacification and reticulation with few scattered cysts. Color-coded images allowed better evaluation of areas reticulation and ground glass (green color) for HU above − 750 and blue color for normal lung ranging between − 750 and − 900 HU
In our study, all patients were subjected to spiometers PFT with emphasis on FVC%, FEV1%, and FEV1/FVC%; we noted that:
FVC (mean 75.74) has mild reduction indicating restrictive lung diseases, which agrees with Moon et al. and Jacob et al., with FVC mean 76.5 ± 18.2, 71% respectively [3, 31].
Also in our result, FEV1% and FEV1/FVC% with mean 52.82 and 69.14 respectively revealed moderate to severe reduction indicating obstructive lung diseases which yielded different results with those of Nakagawa et al., who showed FEV1% and FEV1/FVC% with mean 81.9 ± 18.7 and 80.5 ± 8.3 respectively [32].
In the present study, we aimed to compare the percentage of honeycombing, ground glass, emphysema, and reticular opacities to total normal lung volume measured with the help of semi-quantitative CT analysis, and correlate it with the pulmonary function tests (FVC% , FEV1%, FEV1/FVC%).
By correlation between semi-quantitative CT and spirometer PFT, we found as follows:
Honeycombing % had significant inverse correlation with FVC% (r = − 0.448, p values = 0.013), FEV1% (r = − 0.652, p values = < 0.001), and FEV1/FVC% (r = − 0.551, p values = 0.002). Nakagawa et al. agrees with our result, which found significant correlation between honeycombing and PFT “significant inverse correlation with FVC% (r = − 0.60, p value = 0.001) and FEV1% (r = − 0.66, p value = < 0.001) and signification correlation with FEV1/FVC% r = 0.20, p values = 0.322)” [32].
Reticular opacities % also had significant inverse correlation with FVC% (r = − 0.376, p value = 0.041) which agreed with Park et al.’s study which found negative correlation between RO and FVC (r = −VC (d wp value = < 0.001) [33].
Yoon in his study showed insignificant correlation between honeycombing %, reticular opacities %, and PFT which showed different results from our study [34].
Normal lung was significantly correlated with FVC% (r = 0.455, p value = 0.011), FEV1% (r = 0.691, p value = < 0.001), FEV1/FVC% (r = 0.753, p value = < 0.001) that is matching with Moon’s study which showed a very strong positive correlation with functional lung volume and FVC% (r = 0.72, p < 0.01) [31].
Shin et al.’s study also agreed with our study, which showed a high positive correlation with FLV and a high positive correlation with FVC and FEV1 (r = 0.80 and 0.73, p < 0.01) [21].
Insignificant correlation between PFT and ground glass %, emphysema %, and PFT (p values more than 0.05) agrees with Yoon’s study which showed insignificant relation between ground glass %, emphysema %, and PFT [34].
Park ’s study found that there is a negative correlation between the GGO% and FVC (p < 0.001), whereas the emphysema % correlated positively to the FVC with statistical significance (p < 0.001) which yielded a different result than ours [33].
Conclusion
Semi-quantitative image analysis, including the use of machine learning, provides a great deal of promise in the ILD field; such methods may be used together with visual analysis to obtain the most accurate diagnostic and prognostic information.
Availability of data and materials
The datasets used and/or analyzed during the current study are available from the corresponding author on reasonable request.
Raghu G, Remy-Jardin M, Myers JL et al (2018) Diagnosis of idiopathic pulmonary fibrosis. An official ATS/ERS/JRS/ ALAT clinical practice guideline. Am J Respir Crit Care Med 198:44–68
Jacob J, Bartholmai BJ, Rajagopalan S, Kokosi M, Nair A, Karwoski R et al (2016) Automated quantitative computed tomography versus visual computed tomography scoring in idiopathic pulmonary fibrosis. J Thorac Imaging. 31:304–311
Jacob J, Bartholmai BJ, Rajagopalan S, Kokosi M, Egashira R, Brun AL et al (2018) Serial automated quantitative CT analysis in idiopathic pulmonary fibrosis: functional correlations and comparison with changes in visual CT scores. Eur Radiol. 28:1318–1327
Brownell R, Moua T, Henry TS et al (2017) The use of pretest probability increases the value of high-resolution CT in diagnosing usual interstitial pneumonia. Thorax 72:424–429
Raghu G, Collard HR, Egan JJ et al (2011) An official ATS/ERS/JRS/ALAT statement: idiopathic pulmonary fibrosis: evidence-based guidelines for diagnosis and management. Am J Respir Crit Care Med 183:788–824
Walsh SLF, Devaraj A, Enghelmayer JI, Kishi K, Silva RS et al (2018) Role of imaging in progressive-fibrosing interstitial lung diseases. European Respiratory Review 27:180073
Lynch DA, Sverzellati N, Travis WD et al (2018) Diagnostic criteria for idiopathic pulmonary fibrosis: A Fleischner Society White Paper. Lancet Respir Med 6:138–153
Walsh SL, Calandriello L, Sverzellati N et al (2016) Interobserver agreement for the ATS/ERS/JRS/ALAT criteria for a UIP pattern on CT. Thorax 71:45–51
Chung JH, Montner SM, Adegunsoye A et al (2017) CT findings, radiologic-pathologic correlation, and imaging predictors of survival for patients with interstitial pneumonia with autoimmune features. AJR Am J Roentgenol 208:1229–1236
Iwasawa T, Takemura T, Okudera K et al (2017) The importance of subpleural fibrosis in the prognosis of patients with idiopathic interstitial pneumonias. Eur J Radiol 90:106–113
Tashkin DP, Volkmann ER, Tseng CH et al (2016) Relationship between quantitative radiographic assessments of interstitial lung disease and physiological and clinical features of systemic sclerosis. Ann Rheum Dis 75:374–381
Chan YH Biostatistics102: Quantitative data – parametric & non-parametric tests. Singapore Med J 44(8):391–396
Chan YH Biostatistics 103: Qualitative data –tests of independence. Singapore Med J 44(10):498–503
Chan YH Biostatistics 104: Correlational analysis. Singapore Med J 44(12):614–619
Argiriadi PA, Mendelson DS, David S (2009) High resolution computed tomography in idiopathic interstitial pneumonias. Mount Sinai Journal of Medicine 76(1):37–52
Bonini M, Giueseppe F (2017) Exertional dysnea in interstitial lung diseases: The clinical utility of cardiopulmonary exercise testing. European Respiratory Review 26:143–160
Tanaka T, Kaori I (2018) Update on rare idiopathic interstitial pneumonias and rare histologic patterns. Archives of pathology and laboratory medicine 142(9):1069–1079
Diken OE, Sengul A et al (2019) DIP: Risk factors, laboratory and bronchoalveolar lavage findings, radiological and histopathological examination, clinical features, treatment and prognosis. Experimental and therapeutic medicine 17(1):587–595
Moon JW, Bae JP et al (2016) Perfusion and pattern base quantitative CT indexes using contrast enhanced dual energy CT in diffuse ILD: relationships with physiologic impairment and prediction of prognosis. European radiology 26(5):1368–1377
Nakagawa H, Nagatani M et al (2016) Quantitative CT analysis of honeycombing area in IPF: correlations with PFTs. European Journal of radiology 85(1):125–130
Park HJ, Leet SM et al (2016) Texture based automated quantitative assessment of regional patterns on initial CT in patients with IPF: relationship to decline in forced vital capacity. American journal of Roentgenology 207(5):976–983
Yoon RG, Seo JB et al (2013) Quantitative assessment of change in regional disease pattern on serial HRCT of fibrotic IP with texture base automated quantification system. European radiology 23(3):692–701
MF shared in the study conception and design, collecting patient’s data, processing CT findings at the CT workstation machine, and writing and correcting the manuscript and critical revision. MG shared in the study conception and design, acquisition of data, analysis and interpretation of data, and drafting of the manuscript. Both authors read and approved the final manuscript.
This study was approved by the Research Ethics Committee of the Faculty of Medicine at Cairo University Kasr ElAini in Egypt in January 2017; reference number I-060117.
All patients included in this study gave verbal informed consent to participate in this research. If the patient was less than 16 years old or unconscious at the time of the study, written informed consent for their participation was given by their parent or legal guardian.
Consent for publication
All patients included in this research gave written informed consent to publish the data contained within this study. If the patient was less than 16 years old, deceased, or unconscious when consent for publication was requested, informed consent for the publication of this data was given by their parent or legal guardian.
All authors agreed for publication of the research paper.
Competing interests
Both authors declare that they have no competing interests.
Additional information
Publisher’s Note
Springer Nature remains neutral with regard to jurisdictional claims in published maps and institutional affiliations.
Rights and permissions
Open Access This article is distributed under the terms of the Creative Commons Attribution 4.0 International License (http://creativecommons.org/licenses/by/4.0/), which permits unrestricted use, distribution, and reproduction in any medium, provided you give appropriate credit to the original author(s) and the source, provide a link to the Creative Commons license, and indicate if changes were made.