
Abstract
Background
Coronavirus disease 2019 (COVID-19) is a highly infectious disease causing severe respiratory distress syndrome that was first discovered by the end of 2019 in Wuhan, China.
Main text
A wide variety of CT findings in COVID-19 have been reported in different studies, and the CT findings differ according to the stage of the disease and disease severity and associated co-morbidities. We will discuss each sign separately and its importance in diagnosis and prognosis.
Conclusion
CT plays a pivotal role in the diagnosis and management of COVID-19 pneumonia. The typical appearance of COVID-19 pneumonia is bilateral patchy areas of ground glass infiltration, more in the lower lobes. The appearance of other signs like consolidation, air bronchogram, crazy pavement appearance, and air bubble signs appear during the course of the disease. In the context of pandemic, the CT chest can be used as a screening tool in symptomatic patients as it is cheaper, available, and time saving.
Background
Coronavirus, named after their crown-like appearance, is a large family of viruses that was first discovered by researchers in Chicago in 1965 [1]. The virus was not investigated again till 2003, when the severe acute respiratory distress syndrome (SARS) outbreak started in China and rapidly spread to 29 countries. The SARS outbreak infected a total of 8089 patients with high mortality rate (774 deaths in 17 countries). Ten years later, Middle East respiratory distress syndrome (MERS) outbreak started in Saudi Arabia, infected totally 2506, with total deaths of 862 [2, 3].
Coronavirus disease 2019 (COVID-19) is a highly infectious disease causing severe respiratory distress syndrome that was first discovered by the end of 2019 in Wuhan, China, and spread globally. On 11 March 2020, the pandemic of coronavirus disease 2019 has been declared by the World Health Organization as an international public health emergency. More than 5.3 million cases and 342,000 deaths were reported all over the world by 24 May 2020, and the disease was reported in 188 countries [4,5,6]. In literature, the mortality rate ranges from 4.3 to 15% [7,8,9]. The updated mortality rate is about 5.8% according to the online Johns Hopkins Center dashboard (retrieved 24 May 2020) [6]. The disease is transmitted by person to person (direct contact by exposure to expired air from infected person) and touching a surface contaminated from infected person (indirect contact) [10]. The disease affects males more than females probably due to immune-linked chromosomes or occupational exposure [11]. The incubation period is 2–14 days, average period 5.2 days [11]. The clinical picture ranges from simple lung infection to severe respiratory distress syndrome, metabolic acidosis, diarrhea, intestinal symptoms, coagulation dysfunction, and septic shock [11].
Rapid detection of COVID-19 is vital for early treatment of patients and more importantly for quick isolation of the patient to stop the chain of contamination.
Nowadays, the standard technique for confirming COVID-19 is the real-time polymerase chain reaction (RT-PCR). Other laboratory findings include low white blood cells, lymphopenia, thrombocytopenia, high serum C reactive protein, and elevated serum ferritin [12, 13].
Radiologic imaging, especially thin slice CT, has important roles in the diagnosis, management, and follow-up of patients with COVID-19 pneumonia. Chest CT can detect early phases of infection and enable early isolation of patients [14, 15].
The current review will discuss the main findings of COVID pneumonia in the literature, main differential diagnosis, and the relation between the CT appearance and the clinical severity and prognosis.
CT signs of coronavirus pneumonia
The cell receptor of COVID-19 is angiotensin-converting enzyme-2 (ACV2) [16]. COVID-19 starts as interstitial pneumonitis and then affects lung parenchyma. A wide variety of CT findings in COVID-19 have been reported in the different studies, and the CT findings differ according to the stage of the disease and disease severity and associated co-morbidities. The current study will discuss each sign separately and its importance in diagnosis and prognosis.
Ground glass opacity
Ground glass opacity (GGO) is the non-specific hazy opacification of the lung in the X-ray or computed tomography with no obliteration of bronchial or vascular markings. The presumed pathology include partial filling of the lung alveoli by fluid, interstitial thickening, or partial collapse of lung alveoli [17].
In patients with COVID-19 pneumonia, the most common findings in chest CT is GGO, which is usually described as patchy, peripheral, bilateral, and subpleural. Bao et al. [18] in a meta-analysis of 13 studies found that GGO was the most common manifestation, reported in 83.31% of cases. The meta-analysis involved 13 studies; GGO was the main finding in 11 of them. The two studies which did not report GGO were not radiological studies but were clinical studies, and they only reported bilateral abnormalities in the CT chest, and they should be excluded in our opinion [19, 20]. In another meta-analysis by Zhu et al. [21] involving 32 articles and 4121 patients, they reported ground glass opacification as the most common finding (68.1%). The relative low prevalence of GGO in this meta-analysis is because of the marked heterogeneity in the articles concerned mostly about clinical or laboratory findings. The ground glass opacification is the main CT chest findings in all articles published in radiology journal or other imaging journals [22,23,24,25,26,27,28,29,30,31,32,33,34,35,36,37,38,39,40,41,42]. For example, Guan et al. [37] in a study including 53 patients with COVID-19 reported GGO in all patients (100%). Ng et al. [15] reported 86% incidence of GGO, and the rest of the patients had GGO with consolidation. The expert recommendations from the Chinese Medical Association Radiology Branch classified the CT manifestations according to the appearance of GGO into four stages [43]; the early stage (Fig. 1) is characterized by dilatation of capillaries and engorgement of vessels, mild fluid exudates in the alveoli, and interstitial edema, resulting in single or multiple patchy ground glass opacities. The ground glass opacities are mostly peripheral and subpleural. The second stage is the advanced stage (Figs. 2 and 3) in which the lesions increase in density and size, forming mixed pattern of GGO and consolidation with or without air bronchogram. The cause of this appearance is the exudation into the alveolar space and the lung interstitium [10, 44]. The third severe stage in which there is fibrous exudates into the alveoli reflected in the chest CT as wide areas of consolidation with air bronchogram, with the non-consolidated area showing patchy ground glass infiltration (Fig. 4). In the 4th dissipation stage, the consolidation and ground glass infiltration gradually resolves, with small areas of residual fibrosis (Fig. 5). In some cases, the diffuse ground glass infiltration may give the lungs a white lung appearance (Fig. 6).

Three different cases of early COVID-19 pneumonitis. a Patient in second day after appearance of symptoms with ill-defined early ground glass infiltration patches in the left lower lobe. b Patient in third day of symptoms with multiple patchy areas of sub-pleural ground glass infiltration in both lungs. c Another patient 4 days after symptoms with bilateral wide areas of ground glass infiltration

Two different cases with bilateral multiple patches of ground glass infiltration and subsegmental consolidation, lesions mainly peripheral and posterior

Wide areas of ground glass infiltration with air bronchogram. Patient with COVID-19 pneumonia 8 days after onset of symptoms

Patient with COVID-19 pneumonia 10 days after onset of symptoms. Wide areas of ground glass appearance and consolidation with fibrous bands

Patient about 24 days after onset of symptoms. A well-defined area of consolidation/fibrosis seen in the right lower lobe, no other abnormality was noted in both lungs

Two cases of white lung. a, b Patient with ground glass infiltration diffusely affecting both lungs giving the lung white out appearance. c Another case with relatively dense ground glass infiltration and consolidation diffusely affecting both lungs with air bronchogram
In summary, GGO is the most common and the earliest sign of COVID-19 pneumonia.
Consolidation and air bronchogram
Consolidation is defined as an area of increased attenuation which obscures the bronchial and vascular markings and caused by filling the alveolar spaces by fluid, exudates, transudate, blood, or neoplastic cells [45]. Consolidation in COVID-19 pneumonia tends to be patchy or segmental, irregular or nodular, and mainly subpleural and peripheral with reported incidence 2–64% depending on the duration of the illness [46, 27, 47]. Consolidations usually appear after 10–12 days of the onset of symptoms, after the appearance of GGO. Yuan et al. [48] reported high mortality in patients with consolidation. Li et al. [46] in a series including 83 patients also reported consolidation in patients with severe or advanced disease. In a study by Song et al. [24], the incidence of consolidation was significantly higher in older patients (> 50 years) than younger patients and in patients with symptoms more than 4 days (Figs. 3, 4, and 5).
Air bronchogram, which is defined as air-filled bronchi in area with high density, has variable incidence in different reports ranging from 28 to 80% of patients [24, 49]. Air bronchogram is usually a sign of advanced disease, usually seen after the second week from the onset of symptoms. Air bronchogram can be seen in both GGO and consolidation (Fig. 7).

a Ground glass infiltration with air bronchogram. b Small area of consolidation with air bronchogram. Note the presence of sub-pleural line (white arrow)
Reticulations
Reticulations which appear as lineal interlobular or intralobular density are a relatively late finding in patients with COVID-19, and its reported incidence is 48.5–59% [32, 22]. The appearance of reticulations is usually associated with clinical progression of the disease. The cause of reticulations is probably caused by lymphocyte infiltration of the interstitial tissues with interlobular and septal thickening. In some studies, the reticular pattern was a common pattern, considered the third common sign after GGO and consolidation [22] (Fig. 8).

Patient with COVID-19 pneumonia, 8 days after appearance of symptoms with ground glass infiltration and reticulations
Crazy paving sign
The crazy paving signs represent thickened interlobular septa superimposed on GGO. This sign represents alveolar edema and interstitial inflammatory reaction [45, 47]. In the meta-analysis of Bao et al. [18], the crazy paving sign had incidence of 14.81% (95% CI 6.61–25.99%). On the other hand, some articles reported higher incidence like study performed by Guan et al. [37], who reported 89.4% incidence of crazy paving sign, and they thought this sign was due to hyperplasia of interlobular and intralobular interstitia. Interestingly, though the crazy paving sign is a sign of progressive disease and its appearance may indicate that the disease is entering the peak stage [47], yet it is the first CT sign to resolve in the absorptive stage while the consolidation, and GGO may persist for up to 26 days [50] (Figs. 9 and 10).

Axial and coronal CT images of patient with COVID-19, 10 days after the onset of symptoms, showing extensive ground glass infiltration with crazy paving infiltration. The appearance of crazy paving appearance indicates a progressive disease

Patient with advanced COVID-19 and crazy paving appearance
Nodules
A nodule is an opacity less than 3 cm in diameter with regular or irregular outline. In general, viral pneumonitis is characterized by the presence of nodules [51]. The reported incidence of pulmonary nodules in patients with COVID-19 pneumonia is 3–13% [23] and may be associated with surrounding halo [52]. Yang et al. [53] considered the appearance of nodules in CT chest a sign of progressive course (Figs. 11 and 12).

Patient with COVID-19 pneumonia, with left lower nodule (arrow), note also the presence of ground glass patches and subpleural line (arrow head)
Patient with COVID-19. Multiple small nodules in both lungs, mainly subpleural and posterior
Subpleural curvilinear line (Fig. 13)
Subpleural curvilinear line appears as thin linear shadow 1–3 mm in thickness, parallel to and lying within 1 cm from the pleural surface. About 20% of patients with COVID-19 have these signs, and it may represent edema or fibrosis [32, 54]. Zhou et al. [55] reported this sign in 9.7% of their studied patients. Rouhezamin et al. [56] considered the presence of this sign as a differentiating sign of COVID-19 from lung contusion. In another study which included 62 patients, the subpleural line was reported in 21 (33.9%) patients, and it was more common in advanced disease than early disease [57].

Two different patients with COVID-19 pneumonia with subpleural lines (arrow), note also the presence of patches of ground glass infiltration
Halo sign (Figs. 14, 15, and 16)
Halo sign is defined as ground glass opacity surrounding a nodule or mass. Previously, this sign is considered a manifestation of fungus infection, viral pneumonia, or hypervascular metastasis [52]. In a recent study by Bai et al. [58], they reported halo sign in 26% of patients with COVID-19 pneumonia and 21% of cases with other viral pneumonia, and they found it a non-helpful sign in differentiating COVID-19 pneumonia from other viral pneumonia.

Patient with COVID-19 pneumonia with multiple peripheral areas of GGO. Halo sign is seen in the left lung

Patient with COVID-19, with few patches of GGO, with halo sign in few lesions

Another patient with patches of ground glass infiltration and halo sign
Inverted (reversed) halo sign or atoll sign
The reversed halo sign represents an area of GGO surrounded by near complete ring of consolidation [45]. The proposed mechanisms in COVID-19 pneumonia is either disease progression with development of consolidation around area of GGO or consolidated area with resolution of the central area leaving area of decreased density [7, 49]. The reversed halo sign is usually seen in relatively long time onset of symptoms, and the presence of this sign suggests that organizing pneumonia may be one of the mechanisms of lung injury in COVID-19 pneumonia [59, 60] (Fig. 17).

Patient with COVID-19 pneumonia with reversed halo sign
Subpleural transparent line
Subpleural transparent line is defined as thin and transparent line between the areas GGO or consolidation and the visceral pleura, and it was reported in 53.2% in one study [57]. Another study by Zhou et al. [61] involving 100 patients reported the incidence of transparent line to be 45.3% in the early stage, 47.7% in the advanced stage, and 6.5% in the absorption stage, and they suggested that the presence of this sign indicates advanced stage (Fig. 18).

Subpleural transparent line in three different patients with COVID-19 pneumonia
Air bubble sign (vacuolar sign)
Air bubble sign (vacuolar sign) refers to a small air-containing space < 5 mm in length within the lung lesion [57]. Some authors called it small cystic changes [22] and cavity sign [62]. Generally, Zhou et al. [57] reported it in 54.4% of their patients, and they considered it as a sign of progressive disease (Fig. 19). The air bubble sign may be due to dilatation of physiological spaces or transverse section of a bronchus within an area of consolidation. It may represent an early sign of consolidation resorption.

Air bubble sign (vacuolar sign) in three different patients (arrows)
Vascular enlargement
Vascular dilatation within or around the lesions in CT chest is a common finding in patients with COVID-19. In a study which included 51 patients, vascular enlargement was reported in 42 (82.4%) patients [63]. This signs were also observed in the studies of Lomoro et al. [64] (23.8%), Zhao et al. [65] (71.3%), and Zhou et al. [57] (45.2%), and it has been correlated to hyperemia induced by acute inflammatory response and the disruption of the capillary wall inflammatory mediators [54].
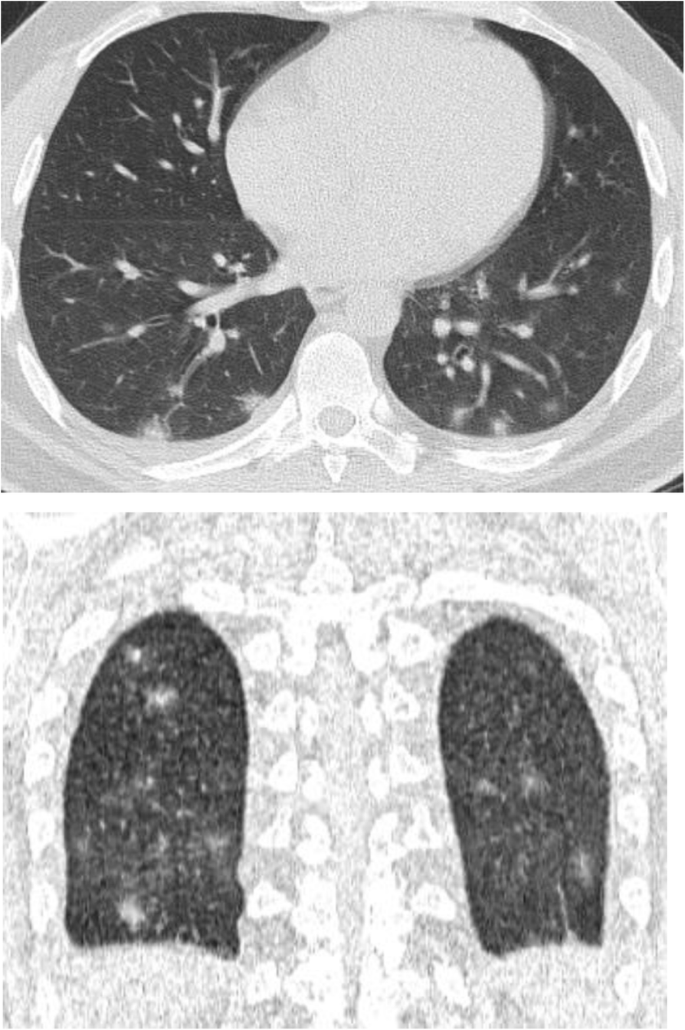
Interestingly, the vascular enlargement was reported in asymptomatic patients with COVID-19, as an association with GGO [66]. In a study by Dai et al. [40], they reported vascular enlargement associated with GGO as the most common findings in patients with COVID-19, and they attributed it to vascular congestion and dilatation of small vessels. The vascular enlargement associated with GGO can be considered as early predictor of lung impairment (Fig. 20).

Dilated pulmonary vessels in patient with acute COVID-19 pneumonia
Bronchial changes
Bronchial wall thickening in patients with COVID-19 pneumonia has been reported in 20% of patients, and it is attributed to inflammatory changes in the bronchial wall, bronchial obstruction, and fibrosis [67, 32]. In a study including 83 patients, bronchial wall thickening was found in patients with severe or progressive disease [67]. Bronchial wall thickening is more common in pediatric patients than adult patients [68].
Bronchiectasis was reported in some cases of COVID-19 patients [69]. Zhao et al. [65] reported bronchiectasis in 52.5% of their patients, and they considered this sign, together with architectural distortion and pleural effusion, a reflection of the severity of the disease and expression of viral load and virulence of the disease (Fig. 21).

Mild bronchial dilatation, bronchial wall thickening (arrow). Note the presence of spider web sign in the left lower lobe (arrow head)
Spider web sign (Fig. 21)
Originally described by Wu et al. [32], spider web sign represents subpleural triangular area of GGO, with web-like thickening of the interlobular septa and retraction of the adjacent pleura. In the meta-analysis study by Zhu et al. [21], including 4121 patients, spider web sign was reported in 39.5% of patients in eleven studies. They considered it a common sign of COVID-19 pneumonia.
Pleural changes
Pleural thickening and pleural effusion are relatively less common findings in patients with COVID-19. The reported incidence of pleural thickening is about 27–32% [21, 27]. The incidence of pleural effusion is less common (2–5%). There is agreement between studies that the presence of pleural effusion carries a poor prognosis and reflects high viral load and high virulence [65, 67] (Fig. 22).

Pleural thickening in the right side in patient with COVID-19 pneumonia
Pericardial effusion
Pericardial effusion is relatively uncommon in patients with COVID-19. In the study by Li et al. [63], they divided their patients into two groups, group with severe clinical symptoms and ordinary group, and they found pericardial effusion in 5% of patients with severe disease and not reported in the ordinary group; they concluded that pericardial effusion is an indication of severe disease.
Mediastinal lymphadenopathy (Fig. 23)
Mediastinal lymph nodes are said to be enlarged when the short axis diameter is 1 cm or more [45]. In patients with COVID-19, mediastinal lymphadenopathy is not a typical feature, with incidence of 1–6% [22, 65, 67]. In general, the presence of enlarged lymph nodes is considered a sign of severe or critical disease [67]. Also, the presence of enlarged lymph nodes may indicate superimposed bacterial infection [70]. Recently, Valette et al. [71] reported high incidence of lymphadenopathy (66%) in patients admitted to ICU with severe respiratory distress syndrome, with some lymph nodes large in size, and they considered it a sign of critically ill patients.

Enlarged mediastinal lymph nodes in patient with COVID-19
Fibrosis
Lung fibrosis and fibrous strips have been reported in patients with COVID-19, with reported incidence about 17% [23]. Some authors consider it a sign of regression of disease severity and carries good prognosis [23], but other authors consider it a sign of severe disease [72] or a warning sign of development of interstitial fibrosis [73].
Anatomical lesion distribution
Bao et al. [18] in a meta-analysis involved 13 studies; the disease was bilateral in 81.8% of patients. The lesions are more common in the peripheral areas (76.95%). Few lesions were located in the central (peribronchovascular) area. The lower lobes are more commonly involved; the right lower lobe and left lower lobe were the most commonly involved, 87.21% and 81.41% respectively, and both lower lobes in 65.22%. The upper lobes were involved in 65.22% and 69.43% for the right and left sides respectively. There are about 39.54% of patients with all lobes affected and 20.51% patients with four lobes affected.
In general, the disease most commonly affects both lungs, the lower zones more commonly affected and the right middle lobe is the least involved one. Also, patchy multifocal distribution is more frequent compared with diffuse disease, but unilateral or unifocal affection can occur. The peribronchial distribution is rare and considered atypical [24, 74].
Normal CT chest in patients with COVID-19 pneumonia
CT plays a very important role in the diagnosis and management of COVID-19 pneumonia. However, multiple studies reported normal CT chest in patients with COVID-19 pneumonia. Bernheim et al. [27] reported that 20 out of 36 patients (56%) had normal CT chest within 2 days from onset of symptoms. Ai et al. [28] reported 21 of 601 (3%) patients with positive RT-PCR had normal CT chest. Chung et al. [34] reported three of 21 patients with positive coronavirus and normal CT chest, with one of these patients progressed 3 days later and developed a solitary rounded ground-glass lesion. They thought that chest CT lacks complete sensitivity and cannot alone exclude the disease, particularly early in the infection. Also, this may be related to the incubation period of the disease or there may be a prodromal phase where viral infection symptoms appear before the appearance of imaging manifestations. The Centers for Disease Control and Prevention has noted that symptoms of COVID-19 pneumonia may appear in as few as 2 days or as long as 2 weeks after exposure, which is similar to the incubation period of MERS [34].
CT score
The total severity score was presumed by Chung et al. [34] based on assessment of the degree of involvement of each of the five lung lobes by ground glass infiltration or other abnormality and classification as none (0%); minimal (1–25%), corresponded to a lobe score 1; mild (26–50%), corresponded to a lobe score 2; moderate (51–75%), corresponded to lobe score 3; or severe (76–100%), corresponded to lobe score 4. An overall lung “total severity score” was achieved by summing the five lobe scores, with range of possible scores 0–20.
Later, Zhang et al. [75] in a study which included 84 patients found the severity score to be correlated with the laboratory data in the early and progressive phases, and the severity score may be a useful tool in patient assessment. However, the severity score did not reduce and lag behind the laboratory findings in the late stage.
Another scoring system was suggested by Yuan et al. [48] who graded the CT attenuation into three grades: 1 for normal attenuation, 2 for ground glass opacification, and 3 for consolidation. The degree of lung involvement was evaluated for 6 lung regions: upper, middle, and lower lung on each side. The involvement of each lobe was graded using a 5-point scale: 0, no involvement; 1, less than 25%, 2, 25–50%; 3, 50–75%, and 4, > 75%. The highest CT score was 72. They used a cutoff value of 24.5 and expected mortality with a sensitivity of 85.6% and a specificity of 84.5%, and they concluded that the high CT score correlates with the patient’s mortality.
In our opinion, the CT score by Yuan et al. [48] is more applicable and put into consideration the density of the lesion and not only the width of involvement.
Accuracy of CT chest in diagnosis of COVID-19 pneumonia
The reported sensitivity of CT in the diagnosis of COVID-19 is 60–98%, and the reported specificity is 25–56% [28, 35, 76, 77]. The reported positive and negative predictive values are 92% and 42% respectively [76]. The low specificity and negative predictive values suggest that CT is unsuitable as a screening tool [74].
A meta-analysis performed by Xu et al. [78], involving 16 studies and 3186 patients, emphasized the high sensitivity (92%) and low specificity (25–33%) of CT in the diagnosis of COVID-19. The high sensitivity of CT led to adoption of chest CT as a diagnostic criterion in the fifth edition of the Diagnosis and Treatment Program of 2019 New Coronavirus Pneumonia proposed by the National Health Commission of China [79]; however, CT chest was later removed in the sixth edition [80]. Generally speaking, in the epidemic areas, the addition of CT as diagnostic criterion will allow early diagnosis and effective control of the epidemic.
The low specificity of CT chest in the diagnosis of COVID may be due to negative CT in early disease or mild disease. Also, it may be because of overlap between COVID pneumonia and other viral pneumonia. In the current pandemic situation, the sensitivity is more important than specificity because there is need to isolate any suspicious case to prevent cross infection [78]. It is to be mentioned that CT alone cannot diagnose COVID-19. According to the guideline of Diagnosis and Treatment of Pneumonitis Caused by 2019-nCoV (trial sixth version), the chest CT findings should be a diagnostic criterion only when combined with epidemiology history, clinical manifestations, and laboratory results [80].
Differential diagnosis
The pneumonia from bacterial origin is easily differentiated from COVID-19 pneumonia because it is characterized by airspace consolidation with lobar or segmental distribution with additional ground glass attenuation, centrilobular nodules, bronchial wall thickening, and mucoid impactions which is quite different from COVID-19 pneumonia presentation [81].
The diffuse GGO in Pneumocystis jiroveci pneumonia in immunocompromised persons can be differentiated from COVID-19 pneumonia because it spares the subpleural spaces [82].
The main challenge is to differentiate COVID-19 pneumonia from pneumonia due to other viral causes with overlapping CT features. The abnormalities in COVID-19 pneumonia tend to be peripheral lesions and usually not associated with pleural effusion or lymphadenopathy, yet, in the context of COVID-19 pandemic, we should always suggest COVID-19 as the cause of GGO in patients with fever and respiratory complaint. In a recent study which included 122 patients, the authors found that the rounded opacities associated with interlobular septal thickening, in the absence of nodules and tree-in-bud sign in a lung periphery, favors the diagnosis COVID-19 [83].
Artificial intelligence (AI)
A major recent advance in the current decade is the artificial intelligence (AI). The application of diagnostic AI models would enable prioritization and help reduce reporting time. The AI would be extremely useful in the epidemic situation compensating the shortage of manpower and hospital beds. AI models for the chest radiographs and CT scans may help alleviate the work overload of radiologists and clinicians and enhance rapid diagnosis and management. Li et al. [84] found the deep learning model accurate with high sensitivity and specificity in the diagnosis of COVID-19 and differentiating it from other forms of pneumonia.
Chest CT compared to RT-PCR
The sensitivity of CT depends on the duration of symptoms. Bernheim et al. [27] reported negative CT in 56% of patients scanned in the first 2 days of symptom onset, whereas negative scans were demonstrated in 9% of patients scanned within 3–5 days, and 4% in patients scanned 6–12 days of symptoms, respectively.
Generally, CT appears to have a higher sensitivity than rRT-PCR test. Long et al. [85] reported higher CT sensitivity of 97.2% compared to initial rRT-PCR test sensitivity of 83.3%. The microbiological tests such as real-time polymerase chain reaction (RT-PCR) may not be available in an emergency setting, and their results take 4–5 days. On the other hand, computed tomography (CT) can be used as an important complement to RT-PCR for diagnosing COVID-19 pneumonia in the current epidemic context. Also, false negative result is obtained on RT-PCR when the viral load is insufficient [24].
In the study by Ai et al. [28] comparing the performance of RT-PCR and CT chest in 1014 patents, they found that 59% (601/1014) had positive RT-PCR compared to 88% (888/1014) positive CT chest. They found 60% of patients had positive CT findings before or parallel to positive RT-PCR, and nearly all patients (56/57) had positive CT before or within 6 days of positive RT-PCR. Moreover, 70% of patients with negative RT-PCR had typical appearance on chest CT. The RT-PCR can be also affected by the sampling technique, source of specimen (upper or lower respiratory tract), viral load, time of sampling, and the type of kit.
Conclusion
CT plays a pivotal role in the diagnosis and management of COVID-19 pneumonia. The typical appearance of COVID-19 pneumonia is bilateral patchy areas of ground glass infiltration, more in the lower lobes. The appearance of other signs like consolidation, air bronchogram, crazy pavement appearance, and air bubble signs appear during the course of the disease. The appearance of pleural effusion or pericardial effusion carries a poor prognostic value. Thin section chest CT has a good sensitivity but low specificity in the diagnosis of COVID-19 pneumonia. Though RT-PCR is still the recommended screening test for COVID-19 pneumonia, we think that during the context of pandemic like the current situation, the CT chest can be used as a screening tool in symptomatic patients as it is cheaper, available, and time saving.
Availability of data and materials
Data are available upon reasonable request.
Abbreviations
- SARS:
-
Severe acute respiratory distress syndrome
- MERS:
-
Middle East respiratory syndrome
- RT-PCR:
-
Reverse transcription polymerase chain reaction
- GGO:
-
Ground glass opacity
- WHO:
-
World Health Organization
- NPV:
-
Negative predictive value
- PPV:
-
Positive predictive value
References
Hamre D, Procknow JJ (1966) A new virus isolated from the human respiratory tract. Proc Soc Exp Biol Med 121(1):190–193. https://doi.org/10.3181/00379727-121-30734
Su S, Wong G, Shi W, Liu J, Lai AC, Zhou J et al (2016) Epidemiology, genetic recombination, and pathogenesis of coronaviruses. Trends Microbiol 24(6):490–502. https://doi.org/10.1016/j.tim.2016.03.003 PMC 7125511. PMID 27012512
Zhu N, Zhang D, Wang W, Li X, Yang B, Song J et al (2020) A novel coronavirus from patients with pneumonia in China, 2019. N Engl J Med 382(8):727–733
Hui DS, Azhar EI, Madani TA, Ntoumi F, Kock R, Dar O et al (2020) The continuing 2019-nCoV epidemic threat of novel coronaviruses to global health - the latest 2019 novel coronavirus outbreak in Wuhan, China. Int J Infect Dis 91:264–266. https://doi.org/10.1016/j.ijid.2020.01.009 PMC 7128332. PMID 31953166
WHO Director-General’s opening remarks at the media briefing on COVID-19”. World Health organization (WHO) (Press release). 11 March 2020. Archived from the original on 11 March 2020.
COVID-19 dashboard by the Center for Systems Science and Engineering (CSSE) at Johns Hopkins University (JHU). ArcGIS. Johns Hopkins University. Retrieved 24 May 2020
Huang C, Wang Y, Li X et al (2020) Clinical features of patients infected with 2019 novel coronavirus in Wuhan, China. Lancet. https://doi.org/10.1016/S0140-6736(20)30183-5
Wang D, Hu B, Hu C et al (2020) Clinical characteristics of 138 hospitalized patients with 2019 novel coronavirus-infected pneumonia in Wuhan, China. JAMA. https://doi.org/10.1001/jama.2020.1585
Chen N, Zhou M, Dong X et al (2020) Epidemiological and clinical characteristics of 99 cases of 2019 novel coronavirus pneumonia in Wuhan, China: a descriptive study. Lancet. https://doi.org/10.1016/S0140-6736(20)30211-7
Jin YH, Cai L, Cheng ZS, Cheng H, Deng T, Fan YP et al (2020) A rapid advice guideline for the diagnosis and treatment of 2019 novel coronavirus (2019-nCoV) infected pneumonia (standard version). Mil Med Res 7:4. https://doi.org/10.1186/s40779-020-0233-6
Zu ZY, Jiang MD, Xu PP, Chen W, Ni QQ, Lu GM et al (2020) Coronavirus disease 2019 (COVID-19): a perspective from China. Radiology 200490. https://doi.org/10.1148/radiol.2020200490 [Epub ahead of print]
Wu J, Liu J, Zhao X et al (2020) Clinical characteristics of imported cases of COVID-19 in Jiangsu Province: a multicenter descriptive study [published online ahead of print, 2020 Feb 29]. Clin Infect Dis. https://doi.org/10.1093/cid/ciaa199
Habibzadeh P, Stoneman EK (2020) The novel coronavirus: a bird’s eye view. Int J Occup Environ Med 11:65. https://doi.org/10.15171/ijoem.2020.1921
Pan Y, Guan H (2020) Imaging changes in patients with 2019-nCov [published online ahead of print, 2020]. Eur Radiol:1–2. https://doi.org/10.1007/s00330-020-06713-z
Ng MY, Lee EY, Yang J, Yang F, Li X, Wang X et al (2020) Imaging profile of the COVID-19 infection: radiologic findings and literature review. Radiol Cardiothorac Imaging 2:e200034. https://doi.org/10.1148/ryct.2020200034
Xu X, Chen P, Wang J et al (2020) Evolution of the novel coronavirus from the ongoing Wuhan outbreak and modeling of its spike protein for risk of human transmission. Sci China Life Sci 2020:1–4
Hodler J, von Schulthess GK, Zollikofer CL (2007) Diseases of the heart, chest & breast: diagnostic imaging and interventional techniques. Springer, Berlin/Heidelberg, p 95 ISBN 9788847006331
Bao C, Liu X, Zhang H, Li Y, Liu J. Coronavirus disease 2019 (COVID-19) CT findings: a systematic review and meta-analysis. J Am Coll Radiol. 2020:S1546-1440(20)30262-3. doi: https://doi.org/10.1016/j.jacr.2020.03.006. Online ahead of print.
Wu J, Liu J, Zhao X et al (2020) Clinical characteristics of imported cases of COVID-19 in Jiangsu Province: a multicenter descriptive study. Clin Infect Dis [Online ahead of print]
Zhang JJ, Dong X, Cao YY et al (2020) Clinical characteristics of 140 patients infected with SARS-CoV-2 in Wuhan, China. Allergy [Online ahead of print]
Zhu J, Zhong Z, Li H et al (2020) CT imaging features of 4121 patients with COVID-19: a meta-analysis. J Med Virol:1–12. https://doi.org/10.1002/jmv.25910
Shi H, Han X, Jiang N et al (2020) Radiological findings from 81 patients with COVID-19 pneumonia in Wuhan, China: a descriptive study. Lancet Infect Dis 20:425–434
Pan Y, Guan H, Zhou S, Wang Y, Li Q, Zhu T, Hu Q, Xia L (2020) Initial CT findings and temporal changes in patients with the novel coronavirus pneumonia (2019-nCoV): a study of 63 patients in Wuhan, China. Eur Radiol 30(6):3306–9. https://doi.org/10.1007/s00330-020-06731-x. Epub 2020. Feb 13. PMID: 32055945; PMCID: PMC7087663
Song F, Shi N, Shan F, Zhang Z, Shen J, Lu H, Ling Y, Jiang Y, Shi Y (2020) Emerging 2019 Novel Coronavirus (2019-nCoV) Pneumonia. Radiology 297(3):E346. https://doi.org/10.1148/radiol.2020209021. Erratum for: Radiology. 2020;295(1):210–217. PMID: 33196374
Duan YN, Qin J (2020) Pre- and posttreatment chest CT findings: 2019 novel coronavirus (2019-nCoV) pneumonia. Radiology 12 [Epub ahead of print]
Guan WJ, Ni ZY, Hu Y et al (2020) Clinical characteristics of coronavirus disease 2019 in China. N Engl J Med [Online ahead of print]
Bernheim A, Mei X, Huang M, Yang Y, Fayad ZA, Zhang N, Diao K, Lin B, Zhu X, Li K, Li S, Shan H, Jacobi A, Chung M (2020) Chest CT Findings in Coronavirus Disease-19 (COVID-19): Relationship to Duration of Infection. Radiology 295(3):200463. https://doi.org/10.1148/radiol.2020200463. Epub 2020 Feb 20. PMID: 32077789; PMCID: PMC7233369
Ai T, Yang Z, Hou H, Zhan C, Chen C, Lv W, Tao Q, Sun Z, Xia L (2020) Correlation of Chest CT and RT-PCR Testing for Coronavirus Disease 2019 (COVID-19) in China: A Report of 1014 Cases. Radiology 296(2):E32-E40. https://doi.org/10.1148/radiol.2020200642. Epub 2020 Feb 26. PMID: 32101510; PMCID: PMC7233399
Lei J, Li J, Li X, Qi X (2020) CT imaging of the 2019 novel coronavirus (2019-nCoV) pneumonia. Radiology 31 [Epub ahead of print]
Caruso D, Zerunian M, Polici M et al Chest CT features of COVID-19 in Rome, Italy [published online ahead of print, 2020 Apr 3]. Radiology. 2020:201237. https://doi.org/10.1148/radiol.2020201237
Wang J, Liu J, Wang Y et al (2020) Dynamic changes of chest CT imaging in patients with corona virus disease-19 (COVID-19). Zhejiang Da Xue Xue Bao Yi Xue Ban 49 [Online ahead of print]
Wu J, Wu X, Zeng W et al (2020) Chest CT Findings in patients with corona virus disease 2019 and its relationship with clinical features. Invest Radiol 55:257–261
Xu X, Yu C, Qu J et al (2020) Imaging and clinical features of patients with 2019 novel coronavirus SARS-CoV-2. Eur J Nucl Med Mol Imaging 47:1275–1280
Chung M, Bernheim A, Mei X et al (2020) CT imaging features of 2019 novel coronavirus (2019-nCoV). Radiology 295(1):202–207. https://doi.org/10.1148/radiol.2020200230
Fang Y, Zhang H, Xu Y, Xie J, Pang P, Ji W (2020) CT manifestations of two cases of 2019 novel coronavirus (2019-nCoV) pneumonia. Radiology 295(1):208–209. https://doi.org/10.1148/radiol.2020200280 Epub 2020 Feb 7
Chen D, Jiang X, Hong Y et al (2020) Can chest CT features distinguish patients with negative from those with positive initial RT-PCR results for coronavirus disease (COVID-19)? [published online ahead of print, 2020 May 5]. AJR Am J Roentgenol:1–5. https://doi.org/10.2214/AJR.20.23012
Guan CS, Lv ZB, Yan S et al (2020) Imaging features of coronavirus disease 2019 (COVID-19): evaluation on thin-section CT. Acad Radiol 27(5):609–613. https://doi.org/10.1016/j.acra.2020.03.002
Cheng Z, Lu Y, Cao Q et al (2020) Clinical features and chest CT manifestations of coronavirus disease 2019 (COVID-19) in a single-center study in Shanghai, China [published online ahead of print, 2020 Mar 14]. AJR Am J Roentgenol:1–6. https://doi.org/10.2214/AJR.20.22959
Huang G, Gong T, Wang G et al (2020) Timely diagnosis and treatment shortens the time to resolution of coronavirus disease (COVID-19) pneumonia and lowers the highest and last CT scores from sequential chest CT [published online ahead of print, 2020 Mar 30]. AJR Am J Roentgenol:1–7. https://doi.org/10.2214/AJR.20.23078
Dai H, Zhang X, Xia J et al (2020) High-resolution chest CT features and clinical characteristics of patients infected with COVID-19 in Jiangsu, China [published online ahead of print, 2020 Apr 6]. Int J Infect Dis 95:106–112. https://doi.org/10.1016/j.ijid.2020.04.003
Xiong Y, Sun D, Liu Y et al (2020) Clinical and high-resolution CT features of the COVID-19 infection: comparison of the initial and follow-up changes. Invest Radiol 55(6):332–339. https://doi.org/10.1097/RLI.0000000000000674
Yang W, Cao Q, Qin L et al (2020) Clinical characteristics and imaging manifestations of the 2019 novel coronavirus disease (COVID-19): a multi-center study in Wenzhou city, Zhejiang, China. J Infect 80(4):388–393. https://doi.org/10.1016/j.jinf.2020.02.016
Chinese Medical Association Radiology Branch (2020) Radiological diagnosis of new coronavirus pneumonia: expert recommendations from the Chinese Medical Association Radiology Branch (first edition). Chin J Radiol 54(00):E001–E001
Shi H, Han X, Zheng C (2020) Evolution of CT manifestations in a patient recovered from 2019 novel coronavirus (2019-nCoV) pneumonia in Wuhan, China. Radiology. https://doi.org/10.1148/radiol.2020200269
Hansell DM, Bankier AA, MacMahon H, McLoud TC, Müller NL, Remy J (2008) Fleischner Society: glossary of terms for thoracic imaging. Radiology 246:697–722
Li K, Wu J, Wu F, Guo D, Chen L, Fang Z et al (2020) The clinical and chest CT features associated with severe and critical COVID-19 pneumonia. Invest Radiol. https://doi.org/10.1097/RLI.0000000000000672
Pan F, Ye T, Sun P et al (2020) Time course of lung changes on chest CT during recovery from 2019 novel coronavirus (COVID-19) pneumonia. Radiology 13 [Epub ahead of print]
Yuan M, Yin W, Tao Z, Tan W, Hu Y (2020) Association of radiologic findings with mortality of patients infected with 2019 novel coronavirus in Wuhan, China. PLoS One 15:e0230548
Yoon SH, Lee KH, Kim JY et al (2020) Chest radiographic and CT findings of the 2019 novel coronavirus disease (COVID-19): analysis of nine patients treated in Korea. Korean J Radiol 21:494–500
Abbasi-Oshaghi E, Mirzaei F, Farahani F, Khodadadi I, Tayebinia H (2020;S1743-9191(20)30401-5) Diagnosis and treatment of coronavirus disease 2019 (COVID-19): laboratory, PCR, and chest CT imaging findings [published online ahead of print, 2020 May 15]. Int J Surg. https://doi.org/10.1016/j.ijsu.2020.05.018
Franquet T (2011) Imaging of pulmonary viral pneumonia. Radiology 260:18–39
Li X, Zeng X, Liu B, Yu Y (2020) COVID-19 infection presenting with CT halo sign. Radiology: Cardiothoracic Imaging. https://doi.org/10.1148/ryct.2020200026
Yang Z, Shi J, He Z et al (2020) Predictors for imaging progression on chest CT from coronavirus disease 2019 (COVID-19) patients. Aging (Albany NY) 12(7):6037–6048. https://doi.org/10.18632/aging.102999
Ye Z, Zhang Y, Wang Y, Huang Z, Song B (2020) Chest CT manifestations of new coronavirus disease 2019 (COVID-19): a pictorial review [published online ahead of print, 2020 Mar 19]. Eur Radiol:1–9. https://doi.org/10.1007/s00330-020-06801-0
Zhou Z, Guo D, Li C et al (2020) Coronavirus disease 2019: initial chest CT findings. Eur Radiol. https://doi.org/10.1007/s00330-020-06816-7
Rouhezamin MR, Paydar S, Haseli S. COVID-19 or pulmonary contusion? A diagnostic dilemma [published online ahead of print, 2020 Apr 15]. Acad Radiol. 2020;S1076-6332(20)30200-2. doi:https://doi.org/10.1016/j.acra.2020.04.008
Zhou S, Wang Y, Zhu T, Xia L (2020) CT features of coronavirus disease 2019 (COVID-19) pneumonia in 62 patients in Wuhan, China. AJR Am J Roentgenol 214(6):1287–1294. https://doi.org/10.2214/AJR.20.22975
Bai HX, Hsieh B, Xiong Z, Halsey K, Choi JW, Tran TML et al (2020) Performance of radiologists in differentiating COVID-19 from viral pneumonia on chest CT. Radiology. https://doi.org/10.1148/radiol.2020200823
Farias LPG, Strabelli DG, Sawamura MVY (2020) COVID-19 pneumonia and the reversed halo sign. J Bras Pneumol 46(2):e20200131. Published 2020 Apr 22. https://doi.org/10.36416/1806-3756/e20200131
Wu Y, Xie YL, Wang X (2020) Longitudinal CT findings in COVID-19 pneumonia: case presenting organizing pneumonia pattern. Radiol Cardiothorac Imaging 2(1):e200031. https://doi.org/10.1148/ryct.202020003
Zhou S, Zhu T, Wang Y et al (2020) Imaging features and evolution on CT in 100 COVID-19 pneumonia patients in Wuhan, China. Eur Radiol. https://doi.org/10.1007/s00330-020-06879-6
Kong W, Agarwal PP (2020) Chest imaging appearance of COVID-19 infection. Radiology: Cardiothoracic Imaging. https://doi.org/10.1148/ryct.2020200028
Li Y, Xia L (2020) Coronavirus disease 2019 (COVID-19): role of chest CT in diagnosis and management. Am J Roentgenol 214(6):1280–1286
Lomoro P, Verde F, Zerboni F, Simonetti I, Borghi C, Fachinetti C, Natalizi A, Martegani A (2020) COVID-19 pneumonia manifestations at the admission on chest ultrasound, radiographs, and CT: single-center study and comprehensive radiologic literature review. Eur J Radiol Open 7:100231
Zhao W, Zhong Z, Xie X, Yu Q, Liu J (2020) Relation between chest CT findings and clinical conditions of coronavirus disease (COVID-19) pneumonia: a multicenter study AJR. Am J Roentgenol:1–6. https://doi.org/10.2214/AJR.20.22976
Meng L, Xiong R, He R et al CT imaging and clinical course of asymptomatic cases with COVID-19 pneumonia at admission in Wuhan, China. J Infect. https://doi.org/10.1016/j.jinf.2020.04.004
Li K, Wu J, Wu F et al (2020) The clinical and chest CT features associated with severe and critical COVID-19 pneumonia. Invest Radiol 55(6):327–331. https://doi.org/10.1097/RLI.0000000000000672
Chen A, Huang J, Liao Y, Liu Z, Chen D, Yang C, Yang R, Wei X (2020) Differences in clinical and imaging presentation of pediatric patients with COVID-19 in comparison with adults. Radiol: Cardiothoracic Imaging 2:2
Xie X, Zhong Z, Zhao W, Zheng C, Wang F, Liu J (2020) Chest CT for typical 2019-nCoV pneumonia: relationship to negative RTPCR testing. Radiology. https://doi.org/10.1148/radiol.2020200343
Kanne JP, Little BP, Chung JH, Elicker BM, Ketai LH (2020) Essentials for radiologists on COVID-19: an update—radiology scientific expert panel. Radiology. https://doi.org/10.1148/radiol.202020052
Valette X, du Cheyron D, Goursaud S. Mediastinal lymphadenopathy in patients with severe COVID-19 [published online ahead of print, 2020 Apr 21]. Lancet Infect Dis. 2020;S1473-3099(20)30310-8. doi:https://doi.org/10.1016/S1473-3099(20)30310-8
Zhong Q, Li Z, Shen X et al (2020) Zhejiang Da Xue Xue Bao Yi Xue Ban 49(1):0
Spagnolo P, Balestro E, Aliberti S, et al. Pulmonary fibrosis secondary to COVID-19: a call to arms? [published online ahead of print, 2020 May 15]. Lancet Respir Med. 2020;S2213-2600(20)30222-8. doi: https://doi.org/10.1016/S2213-2600(20)30222-8
Güneyli S, Atçeken Z, Doğan H, Altınmakas E, Atasoy KÇ (2020) Radiological approach to COVID-19 pneumonia with an emphasis on chest CT [published online ahead of print, 2020 Apr 30]. Diagn Interv Radiol. https://doi.org/10.5152/dir.2020.20260
Zhang B, Zhang J, Chen H et al (2020) Novel coronavirus disease 2019 (COVID-19): relationship between chest CT scores and laboratory parameters [published online ahead of print, 2020 May 12]. Eur J Nucl Med Mol Imaging:1–7. https://doi.org/10.1007/s00259-020-04854-3
Wen Z , Chi Y, Zhang L, et al (2020) Coronavirus Disease 2019: Initial Detection on Chest CT in a Retrospective Multicenter Study of 103 Chinese Subjects. Radiology: Cardiothoracic Imaging 2:2.
Inui S, Fujikawa A, Jitsu M et al (2020) Chest CT findings in cases from the cruise ship “Diamond Princess” with coronavirus disease 2019 (COVID-19). Radiology [Epub head of print]
Xu B, Xing Y, Peng J et al Chest CT for detecting COVID-19: a systematic review and meta-analysis of diagnostic accuracy [published online ahead of print, 2020 May 15](2020) Eur Radiol:1–8. https://doi.org/10.1007/s00330-020-06934-2
General Office of National Health Committee. Office of state administration of traditional Chinese medicine. Notice on the issuance of a program for the diagnosis and treatment of novel coronavirus (2019-nCoV) infected pneumonia (trial fifth edition). URL NEEDED. Published February 26, 2020.
General Office of National Health Committee. Office of State Administration of Traditional Chinese Medicine. Notice on the issuance of a program for the diagnosis and treatment of novel coronavirus (2019-nCoV) infected pneumonia (trial sixth edition). URL NEEDED. Published February 19, 2020.
Tanaka N, Matsumoto T, Kuramitsu T, Nakaki H, Ito K, Uchisako H et al (1996) High resolution CT findings in community-acquired pneumonia. J Comput Assist Tomogr 20:600–608
Kuhlman JE, Kavuru M, Fishman EK, Siegelman SS (1990) Pneumocystis carinii pneumonia: spectrum of parenchymal CT findings. Radiology 175:711–714
Liu M, Zeng W, Wen Y, Zheng Y, Lv F, Xiao K (2020) COVID-19 pneumonia: CT findings of 122 patients and differentiation from influenza pneumonia [published online ahead of print, 2020 May 12]. Eur Radiol:1–7. https://doi.org/10.1007/s00330-020-06928-0
Li L, Qin L, Xu Z et al (2020) Artificial intelligence distinguishes COVID-19 from community acquired pneumonia on chest CT [published online ahead of print, 2020 Mar 19]. Radiology.:200905. https://doi.org/10.1148/radiol.2020200905
Long C, Xu H, Shen Q et al (2020) Diagnosis of the coronavirus disease (COVID-19): rRT-PCR or CT? Eur J Radiol 126:108961
Acknowledgements
None
Funding
None
Author information
Authors and Affiliations
Contributions
The author(s) read and approved the final manuscript.
Corresponding author
Ethics declarations
Ethics approval and consent to participate
Not applicable
Consent for publication
Not applicable
Competing interests
Nothing to declare.
Additional information
Publisher’s Note
Springer Nature remains neutral with regard to jurisdictional claims in published maps and institutional affiliations.
Rights and permissions
Open Access This article is licensed under a Creative Commons Attribution 4.0 International License, which permits use, sharing, adaptation, distribution and reproduction in any medium or format, as long as you give appropriate credit to the original author(s) and the source, provide a link to the Creative Commons licence, and indicate if changes were made. The images or other third party material in this article are included in the article's Creative Commons licence, unless indicated otherwise in a credit line to the material. If material is not included in the article's Creative Commons licence and your intended use is not permitted by statutory regulation or exceeds the permitted use, you will need to obtain permission directly from the copyright holder. To view a copy of this licence, visit http://creativecommons.org/licenses/by/4.0/.
About this article

Cite this article
Hefeda, M.M. CT chest findings in patients infected with COVID-19: review of literature. Egypt J Radiol Nucl Med 51, 239 (2020). https://doi.org/10.1186/s43055-020-00355-3
Received:
Accepted:
Published:
DOI: https://doi.org/10.1186/s43055-020-00355-3