
Abstract
Background
High-resolution computed tomography (HRCT) is the most accepted imaging tool for the detection, characterization, and monitoring of interstitial lung diseases (ILDs). The correct interpretation of HRCT findings still represents often a problem for the radiologists since there is wide interobserver variability. Therefore, a quantitative and noninvasive imaging method able to permit an accurate assessment of ILD is highly desirable. The purpose of this study is to compare the visual method and quantitative CT histogram in the evaluation of ILDs and to identify the best quantitative parameter in the prediction of severity of ILDs.
Results
There is a correlation between the HRCT score by the qualitative method and CT histogram parameters by the quantitative method in the evaluation of ILDs. Total lung volume inspiratory, mean lung density expiratory, and high attenuation area expiratory showed a significant correlation with the HRCT score.
Conclusion
The single best predictor of fibrosis severity in interstitial lung disease is HAAs % expiratory.
Background
Interstitial lung diseases (ILDs) are considered as a group of diseases with different etiology and features [1]. High-resolution computed tomography (HRCT) is the most accepted imaging tool for the detection, characterization, and monitoring of ILD [2,3,4,5,6]. The correct interpretation of HRCT findings still represents often a problem for the radiologists since there is a wide interobserver variability [7]. Therefore, a quantitative and noninvasive imaging method able to permit an accurate assessment of ILD is highly desirable [8, 9]. Compared to the conventional visual interpretation of HRCT lung findings, the automatic computer-based assessment may reveal better improvement in the objectivity, sensitivity, and repeatability of quantitative changes in the lung features [10]. In this study, we aim to compare the visual method and quantitative CT histogram in the evaluation of ILDs and to identify the best quantitative parameter in the prediction of severity of ILDs.
Methods
Patients
This study was approved by the institutional ethical committee, and informed consent obtained assuring respect for the confidentiality of the medical records.
Fifty patients (45 females and five males) were included in this prospective cross-sectional analytic study that took place over 2 years of duration.
Methods
Inspiratory and expiratory HRCT, as well as statistical and comparative analysis, was performed for all included patients.
MDCT technique
The scans were performed using a 64-multidetector computed tomography (MDCT).
All patients were scanned at the end of full inspiration and at the end of forced expiration calibrated according to the manufacturer’s guidelines using parameters of 120 kV and 140 mA without modulation, rotation time = 0.4 s, collimation = 64 × 0.5 mm, and helical beam pitch = 0.8. Axial slices were reconstructed for visual ILD scoring with 0.5-mm slices, 0.4-mm increment, and lung kernel (FC30), while for densitometry, 5-mm-thick slices with an increment of 2.5 mm and smooth kernel (FC03) were used. The scans covered the whole thorax. No contrast medium administrated.
Image evaluation and data analysis
MDCT images for each patient were reviewed on a picture archiving and communication system (PACS; GE Centricity, Milwaukee, WI) using a window setting for lung parenchyma (center, − 600 HU; width, 1600 HU). Then, these images were evaluated during inspiratory and expiratory scans by both visual methods to detect parenchymal abnormalities and air trapping respectively and quantitative method using CT histogram to calculate quantitative CT indices of ILDs.

a An inspiratory axial MDCT image showing ground-glass appearance. b An expiratory axial MDCT images showing areas of air trapping

a An inspiratory axial MDCT image showing ground-glass and honeycombing appearance. b, c Expiratory axial MDCT images showing areas of air trapping as well as subpleural cyst
-
Inspiratory images were evaluated for parenchymal abnormalities as follows:
The parenchymal abnormalities on HRCT were coded and scored in all the images according to Warrick score (9) as follows:
A point value was given to each abnormality as follows: ground-glass appearance = 1, irregular pleural margins = 2, septal/subpleural lines = 3, honeycombing = 4, and subpleural cysts = 5. In each patient, the “severity of disease” score was obtained by adding single point values (maximal severity score 15). An “extent of disease” score was obtained by counting the number of bronchopulmonary segments involved for each abnormality: one to three segments scored as 1, four to nine segments scored as 2, and more than nine segments scored as 3 (maximal extent score 15). The severity and extent of disease were then calculated as the total HRCT score (range from 0 to 30) (15 points to the severity and 15 points to the extent); then, grading of the degree of fibrosis is classified according to the HRCT score, mild fibrosis less than 10 and severe fibrosis more than 10.
-
Expiratory images were reviewed for the presence of air trapping.
-
2)
Quantitative assessment: as shown in Figs. 3, 4, and 5
Fig. 3 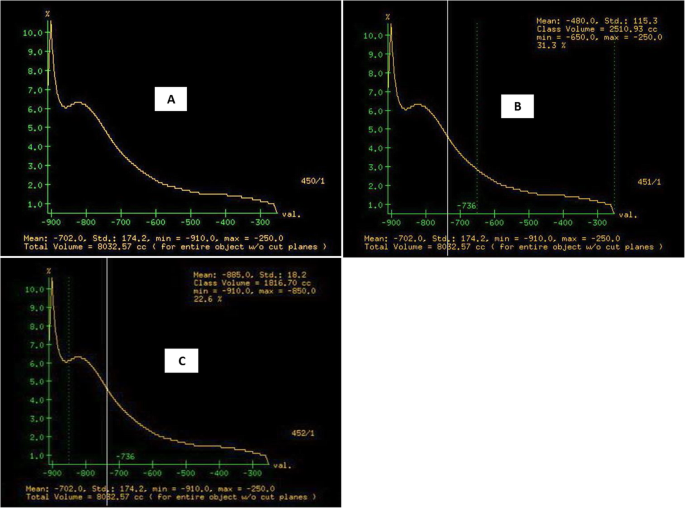
CT histogram analysis a showing total lung volume (TLV) and mean lung density (MLD) between threshold densities − 250 and − 910HU, b showing the percentage of the lung occupied by high attenuation areas (HAAs %) about 31.3%, and c showing the percentage of the lung occupied by low attenuation areas (LAAs %) about 22.6%
Fig. 4 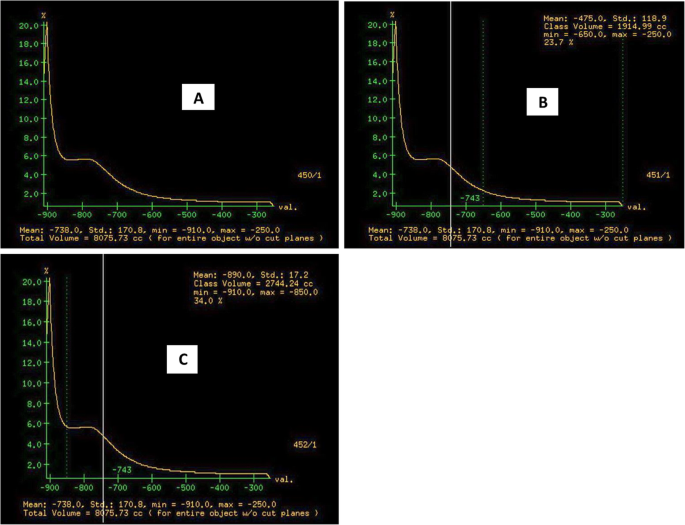
CT histogram analysis a showing total lung volume (TLV) and mean lung density (MLD) between threshold densities − 250 and − 910 HU, b showing the percentage of the lung occupied by high attenuation areas (HAAs %) about 23.7%, and c showing the percentage of lung occupied by low attenuation areas (LAAs %) about 34%
Fig. 5 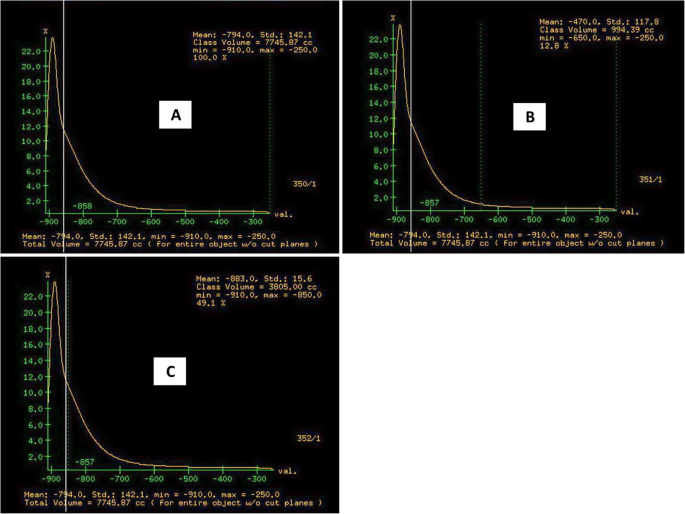
CT histogram analysis a showing total lung volume (TLV) and mean lung density (MLD) between threshold densities − 250 and − 910 HU, b showing the percentage of the lung occupied by high attenuation areas (HAAs %) about 12.8%, and c showing the percentage of lung occupied by low attenuation areas (LAAs %) about 49.1%


The lung density histogram of each CT was obtained using the GE software. The program uses a semi-automated thresholding technique to isolate the lungs from other tissues and structures. The radiodensity of the lung parenchyma isolated from the mediastinum and the thoracic wall ranges between − 250 and − 910. Then, descriptive parameters of the computer analysis were obtained. The parameters derived from the lung density histogram during inspiratory and expiratory scans are as follows:
-
Total lung volume (TLV) and mean lung density (MLD) of lung parenchyma ranged from − 250 to − 910 Hounsfield units (HU)
-
Percentage of the lung occupied by high attenuation areas (HAAs; defined by attenuation values between − 600 and − 250 HU)
-
Percentage of the lung occupied by low attenuation areas (LAAs; defined attenuation values between − 850 and − 910 HU)
Results
This study included 50 patients: 45 females and 5 males. Their age ranged between 24 and 69 years with a mean age of 49.66 years as shown in Table 1. All patients had progressive dyspnea and dry cough. The average HRCT score for all fifty cases ranged from 7 to 27 (14 patients recorded as mild fibrosis with HRCT score ranged from 7 to 10 and 36 patients recorded as severe fibrosis with HRCT score ranged from 11 to 27 as shown in Table 2). As regards the correlation between mild and severe fibrosis by qualitative measures and quantitative values for ILDs, the following parameters showed a significant correlation with HRCT score as follows: TLV inspiratory, MLD expiratory, and HAA expiratory as shown in Table 3. Then, by multiple regression analysis and operating characteristic (ROC) curve analysis, the single best predictor of fibrosis severity is HAAs % expiratory as shown in Tables 4 and 5.
Discussion
This study describes the correlation between the histogram-based quantitative evaluation of MDCT during inspiration and expiration and the visual-based qualitative method.
In this study, we used TLV (cc), MLD (HU), HAAs %, and LAAs % as histogram parameters during inspiratory and expiratory MDCT as well as HRCT score as the visual-based method in the evaluation of ILDs according to Warrick et al. [9]. The HRCT score was classified into mild and severe. In this study, the average HRCT score for all fifty cases measures about 16.42 ± 6.43, 14 patients recorded as mild fibrosis with the HRCT score about 8.57 ± 1.28 and 36 patients recorded as severe fibrosis with the HRCT score about 19.47 ± 4.81.
There is a discrepancy with Salaffi et al. [11] who stated that the average total HRCT score equals 12.1 ± 6.9. The potential increase in the average HRCT score in the current study is explained by that 72% of cases classified as severe fibrosis showing high grade of HRCT score and greater mean of decline in forced vital capacity (FVC) than in Salaffi et al. study [11] in that most of their patients were classified as mild fibrosis evident by a mild decline in FVC; also, there was a difference in sample size: his sample size was seventy-nine patients, while in the current study, fifty patients only were included.
The total lung volume (TLV) inspiratory in this study was significantly low in severe fibrosis compared to mild fibrosis with P value 0.040. This agreed with Ohkubo et al. [12] who stated that lung volume showed a significant negative correlation with the severity of lung fibrosis. On the other hand, TLV expiratory showed no significant correlation between mild and severe fibrosis.
Mean lung density (MLD) inspiratory in ILDs in this study showed no significant correlation with fibrosis score; this agreed with Tanizawa et al. [13] who stated that MLD (HU) inspiratory failed to correlate with fibrosis score. This is explained by that as honeycombing or low attenuation area (LAA) expands, fibrosis score increases, whereas MLD may remain unchanged or decrease. The reason is that increments in LAA (including honeycombing) offset any fluctuations in HAA, while MLD expiratory in this study showed a significant correlation with fibrosis score with P value 0.036. To our knowledge, no previous studies are available for comparison of this point.
High attenuation areas (HAAs %) inspiratory showed weak correlation with no significant difference with fibrosis score, and this agreed with Tanizawa et al. [13] who stated that HAA % inspiratory correlated weakly with fibrosis score (|rs| = 0.23). This can be explained by that as fibrosis score increases, honeycombing or low attenuation area (LAA) expands and offsets any fluctuations in HAA. In this study, HAA expiratory showed a significant correlation with fibrosis score with P value 0.006. No previous studies are available for comparison.
Low attenuation areas (LAAs %) in inspiratory and expiratory phases in this study showed no significant correlation with fibrosis score, as this study not only depends on IPF patients diagnosed by ATS/ERS/JRS/ALAT guidelines, but the included patients were any type of interstitial lung disease (where honeycombing areas are not a constant finding). This result has disagreed with Nakagawa et al. [14] who concluded that LAAs % correlated significantly with fibrosis score; this is explained by that only IPF patients were included in their study according to ATS/ERS/JRS/ALAT guidelines for the diagnosis and management of IPF that established HRCT key features of UIP patterns, such as subpleural/basal predominance, honeycombing with or without traction bronchiectasis.
In the study done by Tanizawa et al. [13], IPF and non-IPF patients were included. They stated that cystic areas (CA%) correlated weakly with fibrosis score (rs = 0.35) and CA% corresponds mainly with diagnosis and HRCT features and was significantly higher in patients with definite UIP pattern.
As regards the predictive power of histogram parameters in severe fibrosis, using univariate and multiple regressions then receiver operating characteristic (ROC) curve analysis, the HAA % expiratory was the best predictor of ILD severity in HRCT by using cutoff values > 21.5 HU, giving sensitivity 66.68%, specificity 85.71%, accuracy 72%, and area under the curve (AUC) 0.753 at P value < 0.001 and 95% CI 1.042–1.423 and odds ratio 1.218. This is explained by the additional value for expiratory CT in the evaluation of ILDs.
Limitations
The diagnosis of pulmonary fibrosis was based on radiological findings, not by histological examination. The sample size was relatively small (conducted at a single institution). Also, no previous studies could be detected about the quantitative method in the expiratory phase; therefore, it is necessary to validate our evaluation in further studies.
Conclusion
TLV inspiratory, MLD expiratory, and HAA expiratory showed a significant correlation with the HRCT score. HAAs % expiratory was the best predictor for ILD severity among all CT histogram parameters by using a cutoff value > 21.5% giving sensitivity 66.68% and specificity about 85.71%.
Availability of data and materials
The datasets used and/or analyzed during the current study are available on reasonable request.
Abbreviations
- ALAT:
-
Latin American Thoracic Association
- ATS:
-
American Thoracic Society
- AUC:
-
Area under the curve
- ERS:
-
European Respiratory Society
- FVC:
-
Forced vital capacity
- HAAs:
-
High attenuation areas
- HRCT:
-
High-resolution computed tomography
- HU:
-
Hounsfield units
- ILDs:
-
Interstitial lung diseases
- IPF:
-
Interstitial pulmonary fibrosis
- JRS:
-
Japan Radiological Society
- LAAs:
-
Low attenuation areas
- MDCT:
-
Multidetector computed tomography
- MLD:
-
Mean lung density
- PACS:
-
Picture archiving and communication system
- ROC:
-
Receiver operating characteristic
- TLV:
-
Total lung volume
- UIP:
-
Usual interstitial pneumonia
References
Narra R, Jukuri N, Pasupaleti B et al (2014) Etiological classification and HRCT features of diffuse interstitial lung disease at Katuri Tertiary Referral Center. Int J Curr Med Appl Sci 5:41–46
Simeon CP, Armadans L, Fonollosa V et al (2003) Mortality and prognostic factors in Spanish patients with systemic sclerosis. Rheumatology 42:71–75
Goh NSL, Desai SR, Veeraraghavan S et al (2008) Interstitial lung disease in systemic sclerosis: a simple staging system. Am J Respir Crit Care Med 177:1248–1254
Remy-Jardin M, Remy J, Wallaert B et al (1993) Pulmonary involvement in progressive systemic sclerosis: sequential evaluation with CT, pulmonary function tests, and bronchoalveolar lavage. Radiology 188:499–506
Goldin JG, Lynch DA, Strollo DC et al (2008) High resolution CT findings in scleroderma-related lung diseases: findings from Scleroderma Lung Study. Chest 134:358–367
Giacomelli R, Valentini G, Salsano F et al (2002) Cyclophosphamide pulse regimen in the treatment of alveolitis in systemic sclerosis. Journal of Rheumatology 29:731–736
Khanna D, Tseng CH, Farmani N et al (2011) Clinical course of lung physiology in patients with scleroderma and interstitial lung disease: analysis of the Scleroderma Lung Study Placebo Group. Arthritis and Rheumatism 63:3078–3085
Goldin JG (2002) Quantitative CT of the lung. Radiologic clinics of North America 40:145–162
Warrick JH, Bhalla M, Schabel SI et al (1991) High resolution computed tomography in early scleroderma lung disease. J Rheumatol 18:1520–1528
Uppaluri R, Hoffman EA, Sonka M et al (1999) Interstitial lung disease: a quantitative study using the adaptive multiple feature method. Am J Respir Crit Care Med 159:519–525
Salaffi F, Carotti M, Bosello S, et al. Computer-aided quantification of interstitial lung disease from high resolution computed tomography images in systemic sclerosis: correlation with visual reader-based score and physiologic tests. Bio Med Research International Volume 2015, Article ID 834262, 8 pages.
Ohkubo H, Kanemitsu Y, Uemura T et al (2016) Normal lung quantification in usual interstitial pneumonia pattern: the impact of threshold-based volumetric CT analysis for the staging of idiopathic pulmonary fibrosis. Plos one 11:e0152505
Tanizawa K, Handa T, Nagai S et al (2015) Clinical impact of high-attenuation and cystic areas on computed tomography in fibrotic idiopathic interstitial pneumonias. BMC Pulmonary Medicine 15:74
Nakagawa H, Nagatani Y, Takahashi M et al (2016) Quantitative CT analysis of honeycombing area in idiopathic pulmonary fibrosis: Correlations with pulmonary function tests. European Journal of Radiology. 85:125–130
Acknowledgements
Not applicable.
Funding
This research did not receive any specific grant from funding agencies in the public, commercial, or not-for-profit sectors.
Author information
Authors and Affiliations
Contributions
DH: design of the work, data collection, data analysis, and manuscript drafting. HI: design and guidance of the work, interpretation of data, and manuscript revision. HMegally: guidance of the work, interpretation of data, and manuscript revision. HMakhlouf: design of the work, guidance of the clinical work, interpretation of the data, and drafting and revision of the manuscript. RE: design of the work, guidance of the work, interpretation of the data, drafting and revision of the manuscript, and manage publication (corresponding author). All authors have approved the article and actively contributed in the work.
Corresponding author
Ethics declarations
Ethics approval and consent to participate
This study has been approved by the ethical committee of the Faculty of Medicine, Assiut University. The approval number is not applicable. A written consent was obtained from each study participant.
Consent for publication
All patients included in this research gave written informed consent to publish the data contained within this study. If the patient was less than 16 years old, deceased, or unconscious when consent for publication was requested, written informed consent for the publication of this data was given by their parent or legal guardian.
Competing interests
The authors declare that they have no competing interests.
Additional information
Publisher’s Note
Springer Nature remains neutral with regard to jurisdictional claims in published maps and institutional affiliations.
Supplementary information
Additional file 1.
Fibrosis score used in this study.
Rights and permissions
Open Access This article is licensed under a Creative Commons Attribution 4.0 International License, which permits use, sharing, adaptation, distribution and reproduction in any medium or format, as long as you give appropriate credit to the original author(s) and the source, provide a link to the Creative Commons licence, and indicate if changes were made. The images or other third party material in this article are included in the article's Creative Commons licence, unless indicated otherwise in a credit line to the material. If material is not included in the article's Creative Commons licence and your intended use is not permitted by statutory regulation or exceeds the permitted use, you will need to obtain permission directly from the copyright holder. To view a copy of this licence, visit http://creativecommons.org/licenses/by/4.0/.
About this article

Cite this article
Hasan, D., Imam, H., Megally, H. et al. The qualitative and quantitative high-resolution computed tomography in the evaluation of interstitial lung diseases. Egypt J Radiol Nucl Med 51, 135 (2020). https://doi.org/10.1186/s43055-020-00254-7
Received:
Accepted:
Published:
DOI: https://doi.org/10.1186/s43055-020-00254-7