
Abstract
Background
Climate change and increasing demand in non-agricultural sectors profoundly affect the availability and quality of water resources for irrigated agriculture. The FAO AquaCrop simulation model provides a sound theoretical framework to investigate crop yield response to environmental stress. This model has successfully simulated crop growth and yield as influenced by varying soil moisture environments for crops. Integrating crop models that simulate the effects of water on crop yield with targeted experimentation can facilitate the development of irrigation strategies for high yield procurement and improving farm level water management and water use efficiency (WUE) under climatic condition of District Hyderabad, Sindh, Pakistan.
Results
This study was based on completely randomized block design with three treatments including T1 (30% soil moisture depletion), T2 (50% soil moisture depletion) and T3 (70% soil moisture depletion) with three replicates. In order to determine the crop water requirements under desired treatments, the gypsum blocks were used for computing the daily soil moisture depletion. The result shows that total volume of water applied to crop under T1, T2 and T3 was 9689, 5200 and 2045 m3 ha−1, respectively. As a result, the grain yield under T1, T2 and T3 was 13.2, 12.1 and 14.3 t ha−1, respectively. These results advocate that total yield of crop under T1 and T2 was less as compared to T3. The T3 gave higher yield and WUE compared than other treatments. On the other hand, results revealed that the simulated sunflower yields showed a good agreement with their measured under T3. The simulated grain yield was 15.5 t ha−1, while the measured yield varied from 12.1 to 14.3 t ha−1. This study suggested that WUE under T3 was more as compared to T1 and T2. The results showed that the T3 gave the highest crop yield in relation to WUE and optimize yield of sunflower crop under water scarcity.
Conclusion
The Aquacrop model could very well predict crop yield and WUE at T3 under experiential region for sunflower production.
Background
Sunflower (Helianthus annuus L.) belongs to the family Asteraceae. The sunflower plant originated in the eastern North America. According to the literature, in the late 1800s the sunflower was introduced in the Russian Federation, where it become a food crop and Russian farmers made significant improvements in the way of the cultivated sunflower. Since 3000 B.C., a wide range of uses of sunflower have been reported throughout the world such as ornamental plant, medicinal, alimentary, feedstock, fodder, dyes for textile industry, body painting, decorations. So it is one of the 4th most important edible oil crops in the world that due to its high content of unsaturated fatty acids and low cholesterol level (Ismail and El-Nakhlawy 2018). In Pakistan, although it was introduced as an oilseed crop 40 years back, but its expansion in acreage and production is fluctuating due to various production and socio-economic constraints. Research work on this crop has shown that there is a great potential of growing it under all the soil and climatic conditions in rain-fed as well as irrigated farming system in different agro-ecological zones. It has great potential to bridge the gaps between the production and consumption of edible oil.
Population growth, land use change, climate change and increasing demand in non-agricultural sectors profoundly affect the availability and quality of water resources for irrigated agriculture. Amid increasing concerns that water scarcity and food security are among the main problems to be faced by many societies in the Twenty-first century, a global challenge for the agricultural sector is to produce more food with less water. Irrigation strategies focusing on increasing agricultural water efficiency, like as deficit irrigation practices couple with crop modeling to investigate multiple alternatives, have a pivotal role towards in the sustainable agricultural development by providing less than the exact crop water requirements, specifically during drought-tolerant at different crop growth stages, crop grain yields can be stabilized and maximum crop water productivity attained. Judicious planning is required as supplying crops with less than their water that, can significantly affect crop growth and development, inevitably affecting crop yield, if water stress occurs during the susceptible growth stage. In each case, various water amounts can be supplied. Owing to their cost and time effectiveness, crop-water simulation models are ideally suited for the evaluation of irrigation strategies during different stages.
According to FAO, AquaCrop simulation model provides a sound theoretical framework examine crop grain yield response to environmental stress. This model has successfully simulated crop growth and yield as influenced by varying soil moisture environments for crops, lie as sunflower. Geerts et al. (2009) suggested that the AquaCrop model maintains a good balance between robustness and accuracy, and a noteworthy feature of the model compared to other simulated models. It requires advanced skill for its calibration or operation and does not require a large numbers of inputs. The relatively small number of input data describes the soil-crop-atmosphere climatic in which the crop growths, most of which can be derived by simple ways. Heng et al. (2009) and Hsiao et al.(2009) reported that the AquaCrop model simulated maize development, grain yield and water variables, such as the evapotranspiration and WUE, to name a few, reasonably well in cases of non-limiting conditions. Still, some studies reported that model performance declines in estimating some variables in severe water stress environments.
The availability of a model adapted to local conditions should have a strong impact on planned expansions and would aid in assessing competing management alternatives and possible constraints. Integrating crop models that simulate the effects of water on crop yield with targeted experimentation can facilitate the development of irrigation strategies for high yield procurement and improving farm level water management and water use efficiency (Soothar et al. 2021).
Methods
The field trial was carried out at the experimental station of Department Irrigation and Drainage, Faculty of Agricultural Engineering, Sindh Agriculture University Tandojam, Pakistan during Rabi season. The experimental site is located at latitude: 25° 25′ 28″ N; longitude: 68° 32′ 25″ E; altitude: 26 m. The design of the study was based on complete Randomized block design (CRBD) with including 3-Treatments, i.e., T1 = 30 percentage soil moisture depletion (SMD), T2 = 50 percentage soil moisture depletion and T3 = 70 percentage soil moisture depletion under basin irrigation method with three replications (R). Total nine plots with an average field size of 3 by 3 m were prepared. The experimental layout is shown in Fig. 1.
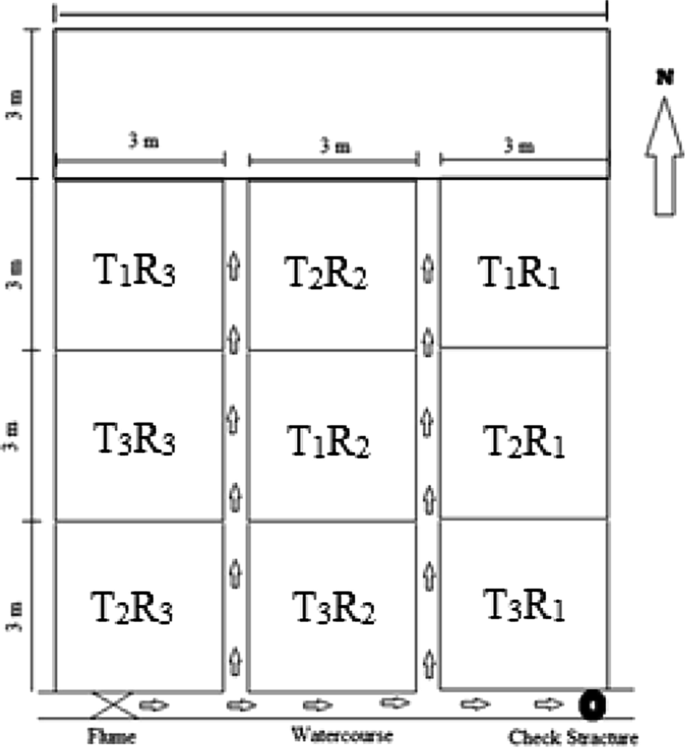
Layout of experimental plot and setup
Soil properties
Before experiment, the soil physical properties such as dry bulk density, field capacity, soil porosity and infiltration rate were measured. Similarly, the collected soil samples were analyzed and basis soil proprieties are present in Table 1.
Crop variety and fertilizers application
Hysun 39 variety of Sunflower crop was selected in this research work. Hysun 39 sunflower variety is very much popular in local market. Fertilizers application was applied as the recommendations of On-Farm Water Management authorized by (MINFAL 2005).
Depth and frequency of irrigation
In order to determine the crop water requirements under different treatments (30, 50 and 70 percentage soil moisture depletion), the soil moisture meter with gypsum blocks was used to compute the daily soil moisture depletion level and irrigated plots at designed irrigation regimes.
Irrigation water measurements
In order to apply the required depth of water to experimental plot, a cut-throat flume was installed at the head of the ridge for the measurement of irrigation water to be applied. The following formula was used to determine the flow rate described by Skogerboe et al. (1997), and calculated discharge was verified through volumetric method at source of irrigation water.
-
(i)
Formula for free flow (if Hd/Hu < 0.68)
$$Q_{{f}} = {{ C}}_{{{\text{f }}}} (h_{{\text{u}}} )^{{{n}}_{{\text{f}}} }$$where f = subscript denoting free flow; u = subscript denoting upstream; Qf = free flow, discharge rate, L3/T; Cf = free flow coefficient = 3.999 (for 8″ × 18″ size flume); nf = free flow exponent, dimensionless = 1.939 (for 8″ × 18″ size flume).
-
(ii)
Formula for submerged flow (if Hd/Hu > 0.68)
$$Q = \frac{{{{[ C}}_{{\text{s}}} {{ (h}}_{{\text{u}}} {{ - h}}_{{\text{d}}} )^{{{{n}}_{{\text{f}}} }} ]}}{{[( - \log S)^{{{{n}}_{{\text{s}}} }} ]}}$$where S = subscript denoting submerged flow; d = subscript denoting downstream; Qs = submerged flow discharge rate, L3/T; nf = submerged flow exponent = 1.939 (for 8″ × 1.5′ size flume); Cs = submerged flow coefficient = 1.606 (for 8″ × 1.5′ size flume); hd = downstream flow depth, L; ns = submerged flow exponent, dimensionless = 1.728 (for 8″ × 1.5′ size flume); S = submergence which is defined by the ratio of downstream head with upstream; head = hd/hu; dimensionless.
Measurements of plant growth and yield
The experimental site was visited on daily basis and measurement of different crop growth parameters at maturity stage, like as plant height (cm), stem girth (cm), flower diameter, seed index and crop yield, selected and tagged. According to Abdou et al. (2011), the girth is the circumference of the plant around stem. Stem girth was measured with the help of vernier calliper at 10 cm height from soil surface. Measuring tape was used for measuring the height (cm) from the ground level to the tip of the disk.
Validation of Aquacrop model
Evaluation is an important step of model verification. It involves a comparison between independent field measurements (data) and output created by the model. Soil water content over the root depth during entire period of experiment was considered in this study for model evaluation. Different statistic indices including coefficient of determination of normalized root mean square error (RMSE) and agreement (D-index) were employed for comparison of simulated against observed data. The normalized RMSE expressed in percent, and it was calculated according procedure given by Loague and Green (1991).
where Pi and Oi refer to simulated and observed values of the study variables, respectively, e.g., days from planting to anthesis, days from anthesis to physiological maturity. M is the mean of the observed variable.
Normalized RMSE gives a measure (%) of the relative difference of simulated versus observed data. The simulation is considered excellent if a normalized RMSE is less than 10%, good if the normalized RMSE is greater than 10% and less than 20%, fair if normalized RMSE is greater than 20 and less than 30%, and poor if the normalized RMSE is greater than 30% described by Jamieson et al. (1991). The index of agreement (D-index) proposed by Willmott et al. (1985) was estimated through following formula. According to the d-statistic, the closer the index value is to one, the better the agreement between the two variables that are being compared and vice versa.
where n is the number of observations, Pi the predicted observation, Oi is a measured observation, \(P_{i}^{/} =P_{i} -M\) and \(O_{i}^{/} = O_{{i}} - M\)(M is the mean of the observed variable).
Water use efficiency
The water use efficiency (WUE) for all treatments was calculated by using following formula (Soothar et al. 2019);
where WUA = Water use efficiency (kg m−3), Y = Yield of crop (kg ha−1), WR = Total water consumed for crop production (m3 ha−1).
Statistical analysis
The data collected were statistically analyzed using (analysis of variance) techniques following CRBD during field experiment. Tukey test was performed to see the significance of plant growth parameters and yield using the grand mean under different irrigation regimes. The software packages STATISTIX 8.1 was used for statistical analysis.
Results
Irrigation water used
Total volume of water applied to crop under all treatments is shown in Fig. 2, and detailed date vise volumes of water applied are presented in Table 2. It is apparent from Table 2 that the total volume of water applied to crop under T1, T2 and T3 was 8.72, 4.68 and 1.84 m3, respectively. It was further calculated as 9689, 5200 and 2045 m3 ha−1. These results revealed that total volume of water used under T3 was less as compared to T1 and T2.
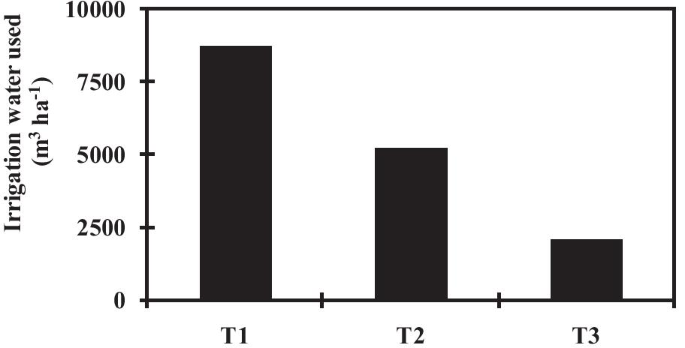
Total volume of irrigation water applied during experimental period under different soil moisture regimes. T1, T2 and T3 represent 30, 50 and 70% soil moisture depletion levels, respectively. The values are means (n = 3)
Plant growth parameters
The obtained data in Fig. 3 showed that the average plant height under T1, T2 and T3 was 134, 135 and 128 cm, respectively (Fig. 3a). However, the average stem girth plant was 2.52, 2.48 and 2.27 cm under T1, T2 and T3, respectively (Fig. 3b). Sunflower flower diameter was observed 15.3, 14.1 and 14.4 cm under T1, T2 and T3, respectively (Fig. 3c). These results imply that plant growth response was better and approximately same under all treatments (Fig. 3). The average value seed Index was non-significant difference among all treatments (Fig. 3d). The results of the experiment revealed that the crop irrigated by T1 under basin irrigation produced higher seed Index 7.2 g followed by T2 and T3 (6.93 and 6.92 g, respectively). These results implied that seed Index of dry grain was better T1 over T2 and T3. The results revealed that the grain yield of sunflower under T1, T2 and T3 was 13.2, 12.1 and 14.3 t ha−1 under different treatments, respectively. These results advocate that total yield of crop under T1 and T2 was less as compared to T3. However, the T1 and T2 produced approximately same crop yield. However, simulated sunflower yield through Aquacrop model were found 15.5 t ha−1. However, it consistently tended to overestimate crop yield by AquaCrop model under all treatments. Analysis of Variance (ANOVA) showed that the values of crop growth parameters were non-significantly difference among each other under the influence as plant height, stem girth, flower diameter of sunflower.
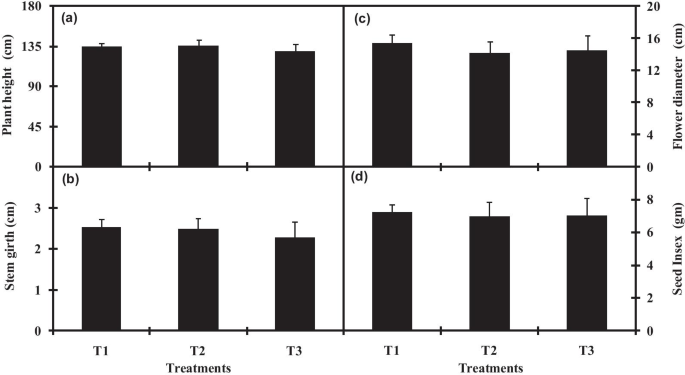
Average plant height (a), stem girth (b), flower diameter (c) and seed Index (d) under different soil moisture regimes. T1, T2 and T3 represent 30, 50 and 70% soil moisture depletion levels, respectively. The values are means ± SE (n = 3)
Aquacrop model validation for sunflower yield under different irrigation regimes
Validation is an important step in model verification and is done by comparing independent field measurements (data) with the outputs created by the model. Soil water content and sunflower crop yield were considered in this study for model validation. Table 3 showed that the measured and simulated results for the validated data sets for sunflower yield during 2016–2017. The simulated sunflower yields showed a good agreement with their measured under T3. The simulated crop yield was 15.6 t ha−1, while the measured yield varied from 12.1 to 14.3 t ha−1 under T1, T2 and T3 during experimental period. This could possibly be due to the fact that the senescence of the canopy accelerates under severe water stress, and the underground root system might be restricted and prevented from extracting more deeply stored soil water, thereby limiting its water uptake.
Water use efficiency
Results of water use efficiency of sunflower under all treatments are illustrated in Fig. 4. These result showed that water used efficiency in T1, T2 and T3 was 2.36, 3.60 and 10.24. Therefore, it is clear from the above results that T3 used less water as compare to T1 and T2 and gave higher yield and water used efficiency than that of T1 and T2. Similarly, water use efficiency simulated through Aquacrop model was found 4.2 kg m−3 of water evapo-transpired. However, it consistently tended to overestimate water use efficiency by T1 and T2, similarly, underestimate by T3.
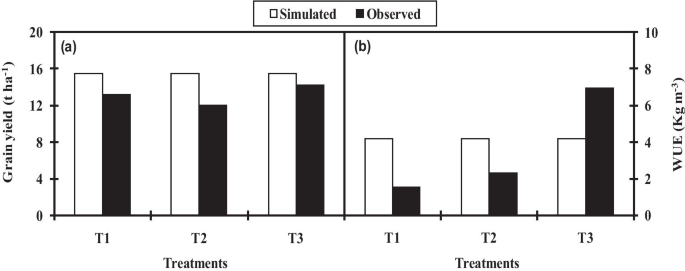
a Grain yield and b water use efficiency (WUE) under different soil moisture regimes. T1, T2 and T3 represent 30, 50 and 70% soil moisture depletion levels, respectively. The values are means ± SE (n = 3)
Discussion
Water irrigation plays an important parameter for plant growth and performance of sunflower production. Therefore, optimum water irrigation scheduling became very necessary for high yield of sunflower (Abdou et al. 2011). Lamm et al. (2013) found that the sunflower yield declines with deficit irrigation and yield increases with marginal irrigation system. (Ghani 2000) observed that 60% of the depletion of available water is optimum for better sunflower production. Bashir and Mohamed (2014); Buriro et al. (2015) reported that the maximum yield of sunflower grain was obtained with full irrigation. Our study quantity of water applied to crop under T1, T2 and T3 was 8.72, 4.68 and 1.84 m3, respectively. Less amount of water was used in T3 treatment. Therefore, highest WUE was 10.24 obtained from T3 treatment and it was 65 to 77% higher than T1 and T2 treatment. Most recent study found that full irrigation produced the sunflower yield of 2049 kg ha−1, where deficit irrigation produced 1710 kg ha−1. However, deficit irrigation increased 22% more WUE than full irrigation (Eltarabily et al. (2020). The highest yield of 3119 kg ha−1 was obtained with six irrigations in contrast to 2200 kg ha−1 with two irrigations (Ghani 2000). Four times irrigations were an optimal irrigation system for attaining higher economical yields (Buriro et al. 2015). Similarly, approximately maximum yields were achieved despite water deficit only sufficient irrigation water provided during flowering stage. Applying deficit irrigation excluding flowering stage saves more irrigation water, which can be efficiently covered more land with the objective of stable yield (Ali et al. 2007). In our results revealed that the total grain yield of sunflower under T1, T2 and T3 was 13.2, 12.1 and 14.3 t ha−1, respectively, under different treatments. These results indicated that the highest yield of crop produced by T3 in comparison with T1 and T2. However, our simulated Aquacrop model found 15.5 t ha−1 of sunflower yield. From above discussion found that T3 used less amount of water and gave higher yield and WUE than that of T1 and T2 treatment. Similarly, WUE simulated through Aquacrop model was found 4.2 kg m−3 of water evapo-transpired. Several studies (Damdar et al. 2003; Prasad et al. 1999; Taha et al. 2001) reported that plant height was increased with increase in irrigation levels. These results are in line with Imam et al. (1999) reported that head diameter of sunflower was increased with increase in number of irrigations. Taha et al. (2001) reported that the seed Index was linearly related to the amount of irrigations.
Heng et al. (2009) reported that the much greater deviations under severe water stress, as compared to well-watered treatments for maize and canola crops simulated by AquaCrop. Table 3 shows the statistical assessment of the AquaCrop model for experimental time under all treatments. The results of NRMSE (9%), d-index (0.99) and percent deviation (8.8%) are comparable with those obtained by others authors. According to Paredes et al. (2014), they suggested that the AquaCrop model performance was obtained relative to biomass and yield predictions, with RMSE lower than 11 and 9% of the average observed biomass and yield, respectively. Iqbal et al. (2014) also suggested that the AquaCrop is a valid model and can be used with a reliable degree of accuracy for optimizing winter wheat grain yield production and water requirement on the NCP in terms of model validation.
Conclusion
These results revealed that total volume of water used under T3 was less as compared to T1 and T2. The simulated sunflower yields showed a good agreement with their measured under T3 and the results shown that the NRMSE is 9%, d (0.99) and percent deviation with 8.8%. The AquaCrop model successfully predicted cop yield of sunflower. The crop parameters are adjusted to simulate crop yield for sunflower under different irrigation regimes. These adjustments were made to obtain more stable and closer relationships between the simulated values and the measured values. Plant growth parameters were non-significantly affected. Seed Index under T1, T2 and T3 was 7.2, 6.93 and 6.92 g, respectively. Similarly, the yield of sunflower crop under T1, T2 and T3 was 13.2, 12.1 and 14.3 t ha−1, respectively. The T3 gave higher yield and water used efficiency than other Treatments. Similarly, water use efficiency simulated through Aquacrop model was found 4.2 kg m−3 of water evapo-transpired. However, it consistently tended to overestimate WUE under T1 and T2, similarly, underestimate by T3. The results of this study on T3 give more crop yield in relation to water use efficiency and optimize yield of sunflower crop under water scarcity. The AquaCrop model could very well predict crop yield and water use efficiency at 70% soil moisture depletion level under experiential region for sunflower production. From the comparison of results, it is concluded that the AquaCrop model is able to accurately simulate sunflower yield under climate conditions.
Availability of data and materials
The datasets generated and/or analyzed during the current study are included in this study.
Abbreviations
- SMD:
-
Soil moisture depletion
- CRBD:
-
Completely randomized block design
- RMSE:
-
Root mean square error
- WUE:
-
Water use efficiency
- ANOVA:
-
Analysis of variation
References
Abdou SMM, Abd El-Latif KM, Farrag RMF, Yousef KMR (2011) Response of sunflower yield and water relations to sowing dates and irrigation scheduling under middle Egypt condition. Adv Appl Sci Res 2:141–150
Ali MH, Hoque MR, Hassan AA, Khair A (2007) Effects of deficit irrigation on yield, water productivity, and economic returns of wheat. Agric Water Manag 92:151–161. https://doi.org/10.1016/j.agwat.2007.05.010
Bashir MA, Mohamed YM (2014) Evaluation of full and deficit irrigation on two sunflower hybrids under semi-arid environment of Gezira, Sudan. J Agric Food Appl Sci 2:53–59
Buriro M, Sanjrani AS, Chachar QI, Chachar NA, Chachar SD, Buriro B, Gandahi AW, Mangan T (2015) Effect of water stress on growth and yield of sunflower. J Agric Technol 11:1547–1563
Bouwer H (1986) Intake rate: cylinder infiltrometer. In Methods of soil analysis, part 1, 2 edn. Agron Monogr 9:825–844
Damdar NN, Abdul H, Karunakar AP, Mohammed S, Jiotode DJ (2003) Effect of land configurations and irrigation levels on growth, yield and irrigation water economy in hybrid sunflower. Ind Res Crop 4:182–185. https://doi.org/10.2054/ijcmas.2019.809.266
Eltarabily MG, Burke JM, Bali KM (2020) Impact of deficit irrigation on shallow saline groundwater contribution and sunflower productivity in the imperial valley, California. Water 12:1–21. https://doi.org/10.3390/w12020571
Geerts S, Raes D, Garcia M, Miranda R, Cusicanqui JA, Taboada C, Mendoza J, Huanca R, Mamani A, Condori O, Mamani J, Morales B, Osco V, Steduto P (2009) Simulating yield response of quinoa to water availability with aquacrop. Agron J 101:499–508. https://doi.org/10.2134/agronj2008.0137s
George JB (1962) Hydrometer method improved for making particle size analyses of soils. Agron J 54:464–465
Ghani A (2000) Effect of different Irrigation regimens on the growth and yield of Sunflower. Int J Agric Biol 2:334–335
Heng LK, Hsiao T, Evett S, Howell T, Steduto P (2009) Validating the FAO AquaCrop model for irrigated and water deficient field maize. Agron J 101:488–498. https://doi.org/10.2134/agronj2008.0029xs
Hsiao TC, Heng L, Steduto P, Rojas-Lara B, Raes D, Fereres E (2009) Aquacrop -the FAO crop model to simulate yield response to water: III. Parameterization and testing for maize. Agron J 101:448–459. https://doi.org/10.2134/agronj2008.0218s
Imam B, Inayat UA, Muhammad SB (1999) Effect of various irrigation frequencies on the yield and yield components of sunflower. Pakistan J Biol Sci 2:194–195. https://doi.org/10.3923/plbs.1999.194.195
Iqbal MA, Shen Y, Stricevic R, Pei H, Sun H, Amiri E, Penas A, Rio S (2014) Evaluation of the FAO AquaCrop model for winter wheat on the North China Plain under deficit irrigation from field experiment to regional yield simulation. Agric Water Manag 135:61–72. https://doi.org/10.1016/j.agwat.2013.12.012
Ismail SM, El-Nakhlawy FS (2018) Optimizing water productivity and production of sunflower crop under arid land conditions. Water Sci Technol Water Supply 18:1861–1868. https://doi.org/10.2166/ws.2018.011
Jamieson PD, Porter JR, Wilson DR (1991) A test of the computer simulation model ARCWHEAT1 on wheat crops grown in New Zealand. Field Crop Res 27:337–350. https://doi.org/10.1016/0378-4290(91)90040-3
Lamm FR, Aiken RM, Aboukheira AM (2013) Irrigation of sunflowers in Northwestern Kansas. In: Proceedings of 2013 Irrig. Assoc. Tech. Conf. Austin, Texas, pp 1–13
Loague K, Green RE (1991) Statistical and graphical methods for evaluating solute transport models; overview and application. J Contam Hydrol 7(1):51–73. https://doi.org/10.1016/0169-7722(91)90038-3
Mclntyre DS, Loveday J (1997) Bulk density in Loveday (ed) Methods of analysis for irrigated soils. In: Common wealth agricultural bureau of technical communication No 54, Farnham Royal, England
MINFAL (2005) Irrigation agronomy field manual, Federal Water Management Cell, Ministry of Food, Agriculture and Livestock, Government of Pakistan. Islamabad 6(1):289–292
Paredes P, de Melo-Abreu JP, Alves I, Pereira LS (2014) Assessing the performance of the FAO AquaCrop model to estimate maize yields and water use under full and deficit irrigation with focus on model parameterization. Agric Water Manag 144:81–97. https://doi.org/10.1016/j.agwat.2014.06.002
Prasad UK, Prasad TN, Kumar A (1999) Effect of irrigation and nitrogen on growth and yield of sunflower (Helianthus annuus L.). Ind J Agric Sci 69:567–569
Skogerboe GV, Lashari BK, Soomro AR, Mangrio MA, Shafique MS (1997) Monitoring and evaluation of irrigation and drainage system at pilot distributaries. Int. Water Manage. Institute Pakistan National Program Res. Report No. 39
Soothar RK, Zhang W, Liu B, Wang C, Tankari M, Li L, Xing H, Gong D, Wang Y (2019) Sustaining yield of winter wheat under alternate irrigation using saline water at different growth stages: a case study in the North China Plain. Sustainability 11:4564. https://doi.org/10.3390/su11174564
Soothar RK, Wang C, Li L, Cui N, Zhang W, Wang Y (2021) Soil salt accumulation, physiological responses, and yield simulation of winter wheat to alternate saline and fresh water irrigation in the North China Plain. J Soil Sci Plant Nutr. https://doi.org/10.1007/s42729-021-00503-2
Taha M, Mishra BK, Acharya N (2001) Effect of irrigation and nitrogen on yield and yield attributing characters of sunflower. Ann Agric Res 22:182–186
Veihmeyer FJ, Hendrickson AH (1931) The moisture equivalent as a measure of the field capacity of soils. Soil Sci 32:181–193
Willmott CJ, Akleson GS, Davis RE, Feddema JJ, Klink KM, Legates DR, Odonnell J, Rowe CM (1985) Statistic for the evaluation and comparison of models. J Geophys Res 90:8995–9005. https://doi.org/10.1029/JC090iC05p08995
Acknowledgements
I would like to acknowledge the contributions of several of my researcher who conducted research and co-authored articles with me on this topic over the years. In particular, I would like to acknowledge contributions by Ashutus Singha for guidance and statistical support during elaboration of the data.
Funding
There are currently no funding sources in the design of the study and collection, analysis, and interpretation of data and in writing the manuscript.
Author information
Authors and Affiliations
Contributions
RKS contributed to design, formulation and supervision of experiment; AS contributed to guideline and writing and review of manuscript; SAS contributed to the analysis of data; AC conducted the experiment and writing of manuscript; FK contributed to stress measurements; MAR contributed to review of manuscript. All authors read and approved the final manuscript.
Corresponding author
Ethics declarations
Ethics approval and consent to participate
Not applicable.
Consent for publication
Not applicable.
Competing interests
The authors declare that they have no competing interests.
Additional information
Publisher's Note
Springer Nature remains neutral with regard to jurisdictional claims in published maps and institutional affiliations.
Rights and permissions
Open Access This article is licensed under a Creative Commons Attribution 4.0 International License, which permits use, sharing, adaptation, distribution and reproduction in any medium or format, as long as you give appropriate credit to the original author(s) and the source, provide a link to the Creative Commons licence, and indicate if changes were made. The images or other third party material in this article are included in the article's Creative Commons licence, unless indicated otherwise in a credit line to the material. If material is not included in the article's Creative Commons licence and your intended use is not permitted by statutory regulation or exceeds the permitted use, you will need to obtain permission directly from the copyright holder. To view a copy of this licence, visit http://creativecommons.org/licenses/by/4.0/.
About this article

Cite this article
Soothar, R.K., Singha, A., Soomro, S.A. et al. Effect of different soil moisture regimes on plant growth and water use efficiency of Sunflower: experimental study and modeling. Bull Natl Res Cent 45, 121 (2021). https://doi.org/10.1186/s42269-021-00580-4
Received:
Accepted:
Published:
DOI: https://doi.org/10.1186/s42269-021-00580-4