
Abstract
Student success plays a vital role in educational institutions, as it is often used as a metric for the institution’s performance. Early detection of students at risk, along with preventive measures, can drastically improve their success. Lately, machine learning techniques have been extensively used for prediction purpose. While there is a plethora of success stories in the literature, these techniques are mainly accessible to “computer science”, or more precisely, “artificial intelligence” literate educators. Indeed, the effective and efficient application of data mining methods entail many decisions, ranging from how to define student’s success, through which student attributes to focus on, up to which machine learning method is more appropriate to the given problem. This study aims to provide a step-by-step set of guidelines for educators willing to apply data mining techniques to predict student success. For this, the literature has been reviewed, and the state-of-the-art has been compiled into a systematic process, where possible decisions and parameters are comprehensively covered and explained along with arguments. This study will provide to educators an easier access to data mining techniques, enabling all the potential of their application to the field of education.
Introduction
Computers have become ubiquitous, especially in the last three decades, and are significantly widespread. This has led to the collection of vast volumes of heterogeneous data, which can be utilized for discovering unknown patterns and trends (Han et al., 2011), as well as hidden relationships (Sumathi & Sivanandam, 2006), using data mining techniques and tools (Fayyad & Stolorz, 1997). The analysis methods of data mining can be roughly categorized as: 1) classical statistics methods (e.g. regression analysis, discriminant analysis, and cluster analysis) (Hand, 1998), 2) artificial intelligence (Zawacki-Richter, Marín, Bond, & Gouverneur, 2019) (e.g. genetic algorithms, neural computing, and fuzzy logic), and 3) machine learning (e.g. neural networks, symbolic learning, and swarm optimization) (Kononenko & Kukar, 2007). The latter consists of a combination of advanced statistical methods and AI heuristics. These techniques can benefit various fields through different objectives, such as extracting patterns, predicting behavior, or describing trends. A standard data mining process starts by integrating raw data – from different data sources – which is cleaned to remove noise, duplicated or inconsistent data. After that, the cleaned data is transformed into a concise format that can be understood by data mining tools, through filtering and aggregation techniques. Then, the analysis step identifies the existing interesting patterns, which can be displayed for a better visualization (Han et al., 2011) (Fig. 1).
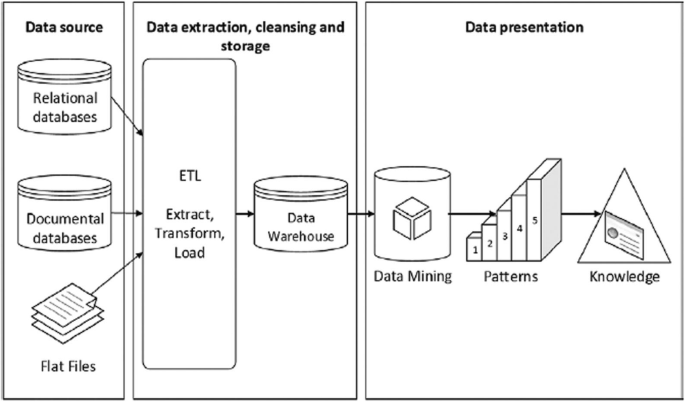
standard data mining process (Han et al. 2011)
Recently data mining has been applied to various fields like healthcare (Kavakiotis et al., 2017), business (Massaro, Maritati, & Galiano, 2018), and also education (Adekitan, 2018). Indeed, the development of educational database management systems created a large number of educational databases, which enabled the application of data mining to extract useful information from this data. This led to the emergence of Education Data Mining (EDM) (Calvet Liñán & Juan Pérez, 2015; Dutt, Ismail, & Herawan, 2017) as an independent research field. Nowadays, EDM plays a significant role in discovering patterns of knowledge about educational phenomena and the learning process (Anoopkumar & Rahman, 2016), including understanding performance (Baker, 2009). Especially, data mining has been used for predicting a variety of crucial educational outcomes, like performance (Xing, 2019), retention (Parker, Hogan, Eastabrook, Oke, & Wood, 2006), success (Martins, Miguéis, Fonseca, & Alves, 2019; Richard-Eaglin, 2017), satisfaction (Alqurashi, 2019), achievement (Willems, Coertjens, Tambuyzer, & Donche, 2018), and dropout rate (Pérez, Castellanos, & Correal, 2018).
The process of EDM (see Fig. 2) is an iterative knowledge discovery process that consists of hypothesis formulation, testing, and refinement (Moscoso-Zea et al., 2016; Sarala & Krishnaiah, 2015). Despite many publications, including case studies, on educational data mining, it is still difficult for educators – especially if they are a novice to the field of data mining – to effectively apply these techniques to their specific academic problems. Every step described in Fig. 2 necessitates several decisions and set-up of parameters, which directly affect the quality of the obtained result.
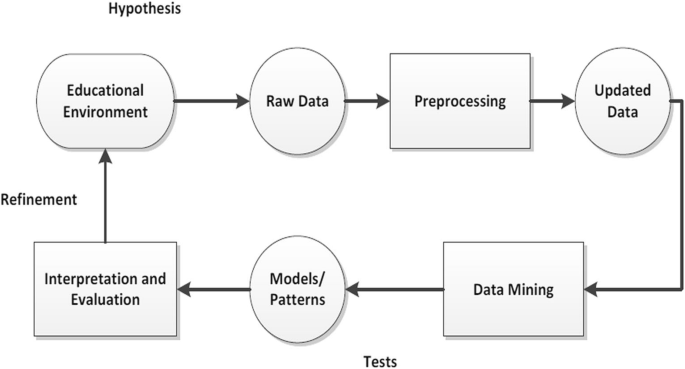
Knowledge discovery process in educational institutions (Moscoso-Zea, Andres-Sampedro, & Lujan-Mora, 2016)
This study aims to fill the described gap, by providing a complete guideline, providing easier access to data mining techniques and enabling all the potential of their application to the field of education. In this study, we specifically focus on the problem of predicting the academic success of students in higher education. For this, the state-of-the-art has been compiled into a systematic process, where all related decisions and parameters are comprehensively covered and explained along with arguments.
In the following, first, section 2 clarifies what is academic success and how it has been defined and measured in various studies with a focus on the factors that can be used for predicting academic success. Then, section 3 presents the methodology adopted for the literature review. Section 4 reviews data mining techniques used in predicting students’ academic success, and compares their predictive accuracy based on various case studies. Section 5 concludes the review, with a recapitulation of the whole process. Finally, section 6 concludes this paper and outlines the future work.
Academic success definition
Student success is a crucial component of higher education institutions because it is considered as an essential criterion for assessing the quality of educational institutions (National Commission for Academic Accreditation &, 2015). There are several definitions of student success in the literature. In (Kuh, Kinzie, Buckley, Bridges, & Hayek, 2006), a definition of student success is synthesized from the literature as “Student success is defined as academic achievement, engagement in educationally purposeful activities, satisfaction, acquisition of desired knowledge, skills and competencies, persistence, attainment of educational outcomes, and post-college performance”. While this is a multi-dimensional definition, authors in (York, Gibson, & Rankin, 2015) gave an amended definition concentrating on the most important six components, that is to say “Academic achievement, satisfaction, acquisition of skills and competencies, persistence, attainment of learning objectives, and career success” (Fig. 3).

Defining academic success and its measurements (York et al., 2015)
Despite reports calling for more detailed views of the term, the bulk of published researchers measure academic success narrowly as academic achievement. Academic achievement itself is mainly based on Grade Point Average (GPA), or Cumulative Grade Point Average (CGPA) (Parker, Summerfeldt, Hogan, & Majeski, 2004), which are grade systems used in universities to assign an assessment scale for students’ academic performance (Choi, 2005), or grades (Bunce & Hutchinson, 2009). The academic success has also been defined related to students’ persistence, also called academic resilience (Finn & Rock, 1997), which in turn is also mainly measured through the grades and GPA, measures of evaluations by far the most widely available in institutions.
Review methodology
Early prediction of students’ performance can help decision makers to provide the needed actions at the right moment, and to plan the appropriate training in order to improve the student’s success rate. Several studies have been published in using data mining methods to predict students’ academic success. One can observe several levels targeted:
Degree level: predicting students’ success at the time of obtention of the degree.
Year level: predicting students’ success by the end of the year.
Course level: predicting students’ success in a specific course.
Exam level: predicting students’ success in an exam for a specific course.
In this study, the literature related to the exam level is excluded as the outcome of a single exam does not necessarily imply a negative outcome.
In terms of coverage, section 4 and 5 only covers articles published within the last 5 years. This restriction was necessary to scale down the search space, due to the popularity of EDM. The literature was searched from Science Direct, ProQuest, IEEE Xplore, Springer Link, EBSCO, JSTOR, and Google Scholar databases, using academic success, academic achievement, student success, educational data mining, data mining techniques, data mining process and predicting students’ academic performance as keywords. While we acknowledge that there may be articles not included in this review, seventeen key articles about data mining techniques that were reviewed in sections 4 and 5.
Influential factors in predicting academic success
One important decision related to the prediction of students’ academic success in higher education is to clearly define what is academic success. After that, one can think about the potential influential factors, which are dictating the data that needs to be collected and mined.
While a broad variety of factors have been investigated in the literature with respect to their impact on the prediction of students’ academic success (Fig. 4), we focus here on prior-academic achievement, student demographics, e-learning activity, psychological attributes, and environments, as our investigation revealed that they are the most commonly reported factors (summarized in Table 1). As a matter of fact, the top 2 factors, namely, prior-academic achievement, and student demographics, were presented in 69% of the research papers. This observation is aligned with the results of The previous literature review which emphasized that the grades of internal assessment and CGPA are the most common factors used to predict student performance in EDM (Shahiri, Husain, & Rashid, 2015). With more than 40%, prior academic achievement is the most important factor. This is basically the historical baggage of students. It is commonly identified as grades (or any other academic performance indicators) that students obtained in the past (pre-university data, and university-data). The pre-university data includes high school results that help understand the consistency in students’ performance (Anuradha & Velmurugan, 2015; Asif et al., 2015; Asif et al., 2017; Garg, 2018; Mesarić & Šebalj, 2016; Mohamed & Waguih, 2017; Singh & Kaur, 2016). They also provide insight into their interest in different topics (i.e., courses grade (Asif et al., 2015; Asif et al., 2017; Oshodi et al., 2018; Singh & Kaur, 2016)). Additionally, this can also include pre-admission data which is the university entrance test results (Ahmad et al., 2015; Mesarić & Šebalj, 2016; Oshodi et al., 2018). The university-data consists of grades already obtained by the students since entering the university, including semesters GPA or CGPA (Ahmad et al., 2015; Almarabeh, 2017; Hamoud et al., 2018; Mueen et al., 2016; Singh & Kaur, 2016), courses marks (Al-barrak & Al-razgan, 2016; Almarabeh, 2017; Anuradha & Velmurugan, 2015; Asif et al., 2015; Asif et al., 2017; Hamoud et al., 2018; Mohamed & Waguih, 2017; Mueen et al., 2016; Singh & Kaur, 2016; Sivasakthi, 2017) and course assessment grades (e.g. assignment (Almarabeh, 2017; Anuradha & Velmurugan, 2015; Mueen et al., 2016; Yassein et al., 2017); quizzes (Almarabeh, 2017; Anuradha & Velmurugan, 2015; Mohamed & Waguih, 2017; Yassein et al., 2017); lab-work (Almarabeh, 2017; Mueen et al., 2016; Yassein et al., 2017); and attendance (Almarabeh, 2017; Anuradha & Velmurugan, 2015; Garg, 2018; Mueen et al., 2016; Putpuek et al., 2018; Yassein et al., 2017)).

a broad variety of factors potentially impacting the prediction of students’ academic success
Students’ demographic is a topic of divergence in the literature. Several studies indicated its impact on students’ success, for example, gender (Ahmad et al., 2015; Almarabeh, 2017; Anuradha & Velmurugan, 2015; Garg, 2018; Hamoud et al., 2018; Mohamed & Waguih, 2017; Putpuek et al., 2018; Sivasakthi, 2017), age (Ahmad et al., 2015; Hamoud et al., 2018; Mueen et al., 2016), race/ethnicity (Ahmad et al., 2015), socioeconomic status (Ahmad et al., 2015; Anuradha & Velmurugan, 2015; Garg, 2018; Hamoud et al., 2018; Mohamed & Waguih, 2017; Mueen et al., 2016; Putpuek et al., 2018), and father’s and mother’s background (Hamoud et al., 2018; Mohamed & Waguih, 2017; Singh & Kaur, 2016) have been shown to be important. Yet, few studies also reported just the opposite, for gender in particular (Almarabeh, 2017; Garg, 2018).
Some attributes related to the student’s environment were found to be impactful information such as program type (Hamoud et al., 2018; Mohamed & Waguih, 2017), class type (Mueen et al., 2016; Sivasakthi, 2017) and semester period (Mesarić & Šebalj, 2016).
Among the reviewed papers, also many researchers used Student E-learning Activity information, such as a number of login times, number of discussion board entries, number / total time material viewed (Hamoud et al., 2018), as influential attributes and their impact, though minor, were reported.
The psychological attributes are determined as the interests and personal behavior of the student; several studies have shown them to be impactful on students’ academic success. To be more precise, student interest (Hamoud et al., 2018), the behavior towards study (Hamoud et al., 2018; Mueen et al., 2016), stress and anxiety (Hamoud et al., 2018; Putpuek et al., 2018), self-regulation and time of preoccupation (Garg, 2018; Hamoud et al., 2018), and motivation (Mueen et al., 2016), were found to influence success.
Data mining techniques for prediction of students’ academic success
The design of a prediction model using data mining techniques requires the instantiation of many characteristics, like the type of the model to build, or methods and techniques to apply (Witten, Frank, Hall, & Pal, 2016). This section defines these attributes, provide some of their instances, and reveal the statistics of their occurrence among the reviewed papers grouped by the target variable in the student success prediction, that is to say, degree level, year level, and course level.
Degree level
Several case studies have been published, seeking prediction of academic success at the degree level. One can observe two main approaches in term of the model to build: classification where CGPA that is targeted is a category as multi class problem such as (a letter grade (Adekitan & Salau, 2019; Asif et al., 2015; Asif et al., 2017) or overall rating (Al-barrak & Al-razgan, 2016; Putpuek et al., 2018)) or binary class problem such as (pass/fail (Hamoud et al., 2018; Oshodi et al., 2018)). As for the other approach, it is the regression where the numerical value of CGPA is predicted (Asif et al., 2017). We can also observe a broad variety in terms of the department students belongs to, from architecture (Oshodi et al., 2018), to education (Putpuek et al., 2018), with a majority in technical fields (Adekitan & Salau, 2019; Al-barrak & Al-razgan, 2016; Asif et al., 2015; Hamoud et al., 2018). An interesting finding is related to predictors: studies that included university-data, especially grades from first 2 years of the program, yielded better performance than studies that included only demographics (Putpuek et al., 2018), or only pre-university data (Oshodi et al., 2018). Details regarding the algorithm used, the sample size, the best accuracy and corresponding method, as well as the software environment that was used are all in Table 2.
Year level
Less case studies have been reported, seeking prediction of academic success at the year level. Yet, the observations regarding these studies are very similar to the one related to degree level (reported in previous section). Similar to previous sub-section, studies that included only social conditions and pre-university data gave the worse accuracy (Singh & Kaur, 2016), while including university-data improved results (Anuradha & Velmurugan, 2015). Nevertheless, it is interesting to note that even the best accuracy in (Anuradha & Velmurugan, 2015) is inferior to the accuracy in (Adekitan & Salau, 2019; Asif et al., 2015; Asif et al., 2017) reported in previous section. This can be explained by the fact that in (Anuradha & Velmurugan, 2015), only 1 year of past university-data is included while in (Asif et al., 2015; Asif et al., 2017), 2 years of past university-data and in (Adekitan & Salau, 2019) 3 years of past university-data is covered. Other details for these methods are in Table 3.
Course level
Finally, some studies can be reported, seeking the prediction of academic success at the course level. As already mentioned in degree level and year level sections, the comparative work gives accuracies of 62% to 89% while predicting success at a course level can give accuracies more than 89%, which can be seen as a more straightforward task than predicting success at degree level or year level. The best accuracy is obtained in course level with 93%. In (Garg, 2018), the target course was an advanced programming course while the influential factor was a previous programming course, also a prerequisite course. This demonstrates how important it is to have a field knowledge and use this knowledge to guide the decisions in the process and target important features. All other details for these methods are in Table 4.
Data mining process model for student success prediction
This section compiles as a set of guidelines the various steps to take while using educational data mining techniques for student success prediction; all decisions needed to be taken at various stages of the process are explained, along with a shortlist of best practices collected from the literature. The proposed framework (Fig. 5) has been derived from well-known processes (Ahmad et al., 2015; Huang, 2011; Pittman, 2008). It consists of six main stages: 1) data collection, 2) data initial preparation, 3) statistical analysis, 4) data preprocessing, 5) data mining implementation, and 6) result evaluation. These stages are detailed in the next subsections.

Stages of the EDM framework
Data collection
In educational data mining, the needed information can be extracted from multiple sources. As indicated in Table 1, the most influential factor observed in the literature is Prior Academic Achievement. Related data, that is to say, pre-university or university-data, can easily be retrieved from the university Student Information System (SIS) that are so widely used nowadays. SIS can also provide some student demographics (e.g. age, gender, ethnicity), but socio-economic status might not be available explicitly. In that case, this could either be deduced from existing data, or it might be directly acquired from students through surveys. Similarly, students’ environment related information also can be extracted from the SIS, while psychological data would probably need the student to fill a survey. Finally, students’ e-learning activities can be obtained from e-learning system logs (Table 5).
Initial preparation of data
In its original form, the data (also called raw data) is usually not ready for analysis and modeling. Data sets that are mostly obtained from merging tables in the various systems cited in Table 5 might contain missing data, inconsistent data, incorrect data, miscoded data, and duplicate data. This is why the raw data needs to go through an initial preparation (Fig. 6), consisting of 1) selection, 2) cleaning, and 3) derivation of new variables. This is a vital step, and usually the most time consuming (CrowdFlower, 2016).

Initial Preparation of Data
Data selection
The dimension of the data gathered can be significant, especially while using prior academic achievements (e.g. if all past courses are included both from high-school and completed undergraduate years). This can negatively impact the computational complexity. Furthermore, including all the gathered data in the analysis can yield below optimal prediction results, especially in case of data redundancy, or data dependency. Thus, it is crucial to determine which attributes are important, or needs to be included in the analysis. This requires a good understanding of the data mining goals as well as the data itself (Pyle, Editor, & Cerra, 1999). Data selection, also called “Dimensionality Reduction” (Liu & Motoda, 1998), consists in vertical (attributes/variables) selection and horizontal (instance/records) selection (García, Luengo, & Herrera, 2015; Nisbet, Elder, & Miner, 2009; Pérez et al., 2015) (Table 6). Also, it is worth noticing that models obtained from a reduced number of features will be easier to understand (Pyle et al., 1999).
Data cleaning
Data sources tend to be inconsistent, contain noises, and usually suffer from missing values (Linoff & Berry, 2011). When a value is not stored for a variable, it is considered as missing data. When a value is in an abnormal distance from the other values in the dataset, it is called an outlier. Literature reveals that missing values and outliers are very common in the field of EDM. Thus, it is important to know how to handle them without compromising the quality of the prediction. All things considered, dealing with missing values or outliers cannot be done by a general procedure, and several methods need to be considered within the context of the problem. Nevertheless, we try to here to summarize the main approaches observed in the literature and Table 7 provides a succinct summary of them.
If not treated, missing value becomes a problem for some classifiers. For example, Support Vector Machines (SVMs), Neural Networks (NN), Naive Bayes, and Logistic Regression require full observation (Pelckmans, De Brabanter, Suykens, & De Moor, 2005; Salman & Vomlel, 2017; Schumacker, 2012), however, decision trees and random forests can handle missing data (Aleryani, Wang, De, & Iglesia, 2018). There are two strategies to deal with missing values. The first one is a listwise deletion, and it consists in deleting either the record (row deletion, when missing values are few) or the attribute/variable (column deletion, when missing values are too many). The second strategy, imputation, that derives the missing value from the remainder of the data (e.g. median, mean, a constant value for numerical value, or randomly selected value from missing values distribution (McCarthy, McCarthy, Ceccucci, & Halawi, 2019; Nisbet et al., 2009)).
Outliers data are also known as anomalies, can easily be identified by visual means, creating a histogram, stem and leaf plots or box plots and looking for very high or very low values. Once identified, outliers can be removed from the modeling data. Another possibility is to converts the numeric variable to a categorical variable (i.e. bin the data) or leaves the outliers in the data (McCarthy et al., 2019).
Derivation of new variables
New variables can be derived from existing variables by combining them (Nisbet et al., 2009). When done based on domain knowledge, this can improve the data mining system (Feelders, Daniels, & Holsheimer, 2000). For example, GPA is a common variable that can be obtained from SIS system. If taken as it is, a student’s GPA reflects his/her average in a given semester. However, this does not explicitly say anything about this student’s trend over several semesters. For the same GPA, one student could be in a steady state, going through an increasing trend, or experiencing a drastic performance drop. Thus, calculating the difference in GPA between consecutive semesters will add an extra information. While there is no systematic method for deriving new variables, Table 8 recapitulates the instances that we observed in the EDM literature dedicated to success prediction.
Statistical analysis
Preliminary statistical analysis, especially through visualization, allows to better understand the data before moving to more sophisticated data mining tasks and algorithms (McCarthy et al., 2019). Table 9 summarizes the statistics commonly derived depending on the data type. Data mining tools contain descriptive statistical capabilities. Dedicated tools like STATISTICA (Jascaniene, Nowak, Kostrzewa-Nowak, & Kolbowicz, 2013) and SPSS (L. A. D. of S. University of California and F. Foundation for Open Access Statistics, 2004) can also provide tremendous insight.
It is important to note that this step can especially help planning further steps in DM process, including data pre-processing to identify the outliers, determining the patterns of missing data, study the distribution of each variable and identify the relationship between independent variables and the target variable (see Table 10). Furthermore, statistical analysis is used in the interpreting stage to explain the results of the DM model (Pyle et al., 1999).
Data preprocessing
The last step before the analysis of the data and modeling is preprocessing, which consists of 1) data transformation, 2) how to handle imbalanced data sets, and 3) feature selection (Fig. 7).

Data Preprocessing
Data transformation
Data transformation is a necessary process to eliminate dissimilarities in the dataset, thus it becomes more appropriate for data mining (Osborne, 2002). In EDM for success prediction, we can observe the following operations:
- 1.
Normalization of numeric attributes: this is a scaling technique used when the data includes varying scales, and the used data mining algorithm cannot provide a clear assumptions of the data distribution (Patro & Sahu, 2015). We can cite K-nearest neighbors and artificial neural networks (How to Normalize and Standardize Your Machine Learning Data in Weka, n.d.) as examples of such algorithms. Normalizing the data may improve the accuracy and the efficiency of the mining algorithms, and provide better results (Shalabi & Al-Kasasbeh, 2006). The common normalization techniques are min-max (MM), decimal scaling, Z-score (ZS), median and MAD, double sigmoid (DS), tanh, and bi-weight normalizations (Kabir, Ahmad, & Swamy, 2015).
- 2.
Discretization: The simplest method of discretization binning (García et al., 2015), converts a continuous numeric variable into a series of categories by creating a finite number of bins and assigning a specific number of values to each attribute in each bin. Discretization is a necessary step when using DM techniques that allow only for categorical variables (Liu, Hussain, Tan, & Dash, 2002; Maimon & Rokach, 2005) such as C4.5 (Quinlan, 2014), Apriori (Agrawal, 2005) and Naïve Bayes (Flores, Gámez, Martínez, & Puerta, 2011). Discretization also increases the accuracy of the models by overcoming noisy data, and by identifying outliers’ values. Finally, discrete features are easier to understand, handle, and explain.
- 3.
Convert to numeric variables: Most DM algorithms offer better results using a numeric variable. Therefore, data needs to be converted into numerical variables, using any of these methods:
- a.
Encode labels using a value between [0 and N(class-1)34] where N is the number of labels (Why One-Hot Encode Data in Machine Learning, n.d.).
- b.
A dummy variable is a binary variable denoted as (0 or 1) to represent one level of a categorical variable, where (1) reflects the presence of level and (0) reflects the absence of level. One dummy variable will be created for each present level (Mayhew & Simonoff, 2015).
- a.
- 4.
Combining levels: this allows reducing the number of levels in categorical variables and improving model performance. This is done by simply combining similar levels into alike groups through domain (Simple Methods to deal with Categorical Variables in Predictive Modeling, n.d.).
However, note that all these methods do not necessarily lead to improved results. Therefore, it is important to repeat the modeling process by trying different preprocessing scenarios, evaluate the performance of the model, and identify the best results. Table 11. recapitulates the various EDM application of preprocessing methods.
Imbalanced datasets
It is common in EDM applications that the dataset is imbalanced, meaning that the number of samples from one class is significantly less than the samples from other classes (e.g. number of failing students vs passing students) (El-Sayed, Mahmood, Meguid, & Hefny, 2015; Qazi & Raza, 2012). This lack of balance may negatively impact the performance of data mining algorithms (Chotmongkol & Jitpimolmard, 1993; Khoshgoftaar, Golawala, & Van Hulse, 2007; Maheshwari, Jain, & Jadon, 2017; Qazi & Raza, 2012). Re-sampling (under or over-sampling) is the solution of choice (Chotmongkol & Jitpimolmard, 1993; Kaur & Gosain, 2018; Maheshwari et al., 2017). Under-sampling consists in removing instances from the major class, either randomly or by some techniques to balance the classes. Oversampling consists of increasing the number of instances in the minor class, either by randomly duplicating some samples, or by synthetically generating samples (Chawla, Bowyer, Hall, & Kegelmeyer, 2002) (see Table 12).
Feature selection
When the data set is prepared and ready for modeling, then the important variables can be chosen and submitted to the modeling algorithm. This step, called feature selection, is an important strategy to be followed to mining the data (Liu & Motoda, 1998). Feature selection aims to choose a subset of attributes from the input data with the capability of giving an efficient description for the input data while reducing effects from unrelated variables while preserving sufficient prediction results (Guyon & Elisseeff, 2003). Feature selection enables reduced computation time, improved prediction performance while allowing a better understanding of the data (Chandrashekar & Sahin, 2014). Feature selection methods are classified into filter and wrapper methods (Kohavi & John, 1997). Filter methods work as preprocessing to rank the features, so high-ranking features are identified and applied to the predictor. In wrapper methods, the criterion for selecting the feature is the performance of the forecasting device, meaning that the predictor is wrapped on a search algorithm which will find a subset that gives the highest predictor performance. Moreover, there are embedded methods (Blum & Langley, 1997; Guyon & Elisseeff, 2003; P. (Institute for the S. of L. and E. Langley, 1994) which include variable selection as part of the training process without the need for splitting the data into training and testing sets. However, most data mining tools contains embedded feature selection methods making it easy to try them and chose the best one.
Data mining implementation
Data mining models
Two types of data mining models are commonly used in EDM applications for success prediction: predictive and descriptive (Kantardzic, 2003). Predictive models apply supervised learning functions to provide estimation for expected values of dependent variables according to the features of relevant independent variables (Bramer, 2016). Descriptive models are used to produce patterns that describe the fundamental structure, relations, and interconnectedness of the mined data by applying unsupervised learning functions on it (Peng, Kou, Shi, & Chen, 2008). Typical examples of predictive models are classification (Umadevi & Marseline, 2017) and regression (Bragança, Portela, & Santos, 2018), while clustering (Dutt et al., 2017) and association (Zhang, Niu, Li, & Zhang, 2018), produce descriptive models. As stated in section 4, classification is the most used method, followed by regression and clustering. The most commonly used classification techniques are Bayesian networks, neural networks, decision trees (Romero & Ventura, 2010). Common regression techniques are linear regression and logistic regression analysis (Siguenza-Guzman, Saquicela, Avila-Ordóñez, Vandewalle, & Cattrysse, 2015). Clustering uses techniques like neural networks, K-means algorithms, fuzzy clustering and discrimination analysis (Dutt et al., 2017). Table 13 shows the recurrence of specific algorithms based on the literature review that we performed.
In the process, first one needs to choose a model, namely predictive or descriptive. Then, the algorithms to build the models are chosen from the 10 techniques considered as the top 10 in DM in terms of performance, always prefer models that are interpretable and understandable such as DT and linear models (Wu et al., 2008). Once the algorithms have been chosen, they require to be configured before they are applied. The user must provide suitable values for the parameters in advance in order to obtain good results for the models. There are various strategies to tune parameters for EDM algorithms, used to find the most useful performing parameters. The trial and error approach is one of the simplest and easiest methods for non-expert users (Ruano, Ribes, Sin, Seco, & Ferrer, 2010). It consists of performing numerous experiments by modifying the parameters’ values until finding the most beneficial performing parameters.
Data mining tools
Data mining has a stack of open source tools such as machine learning tools which supports the researcher in analyzing the dataset using several algorithms. Such tools are vastly used for predictive analysis, visualization, and statistical modeling. WEKA is the most used tool for predictive modeling (Jayaprakash, 2018). This can be explained by its many pre-built tools for data pre-processing, classification, association rules, regression, and visualization, as well as its user-friendliness, and accessibility even to a novice in programming or data mining. But we can also cite RapidMiner and Clementine as stated in Table 4.
Results evaluation
As several models are usually built, it is important to evaluate them and select the most appropriate. While evaluating the performance of classification algorithms, normally the confusion matrix as shown in Table 14 is used. This table gathers four important metrics related to a given success prediction model:
True Positive (TP): number of successful students classified correctly as “successful”.
False Positive (FP): number of successful students incorrectly classified as “non-successful”.
True Negative (TN): number of did not successful students classified correctly as “non-successful”.
False Negative (FN): number of did not successful students classified incorrectly as “successful”.
Different performance measures are included to evaluate the model of each classifier, almost all measures of performance are based on the confusion matrix and the numbers in it. To produce more accurate results, these measures are evaluated together. In this research, we’ll focus on the measures used in the classification problems. The measures commonly used in the literature are provided in Table 15.
Conclusion
Early student performance prediction can help universities to provide timely actions, like planning for appropriate training to improve students’ success rate. Exploring educational data can certainly help in achieving the desired educational goals. By applying EDM techniques, it is possible to develop prediction models to improve student success. However, using data mining techniques can be daunting and challenging for non-technical persons. Despite the many dedicated software’s, this is still not a straightforward process, involving many decisions. This study presents a clear set of guidelines to follow for using EDM for success prediction. The study was limited to undergraduate level, however the same principles can be easily adapted to graduate level. It has been prepared for those people who are novice in data mining, machine learning or artificial intelligence.
A variety of factors have been investigated in the literature related to its impact on predicting students ‘academic success which was measured as academic achievement, as our investigation showed that prior-academic achievement, student demographics, e-learning activity, psychological attributes, are the most common factors reported. In terms of prediction techniques, many algorithms have been applied to predict student success under the classification technique.
Moreover, a six stages framework is proposed, and each stage is presented in detail. While technical background is kept to a minimum, as this not the scope of this study, all possible design and implementation decisions are covered, along with best practices compiled from the relevant literature.
It is an important implication of this review that educators and non-proficient users are encouraged to applied EDM techniques for undergraduate students from any discipline (e.g. social sciences). While reported findings are based on the literature (e.g. potential definition of academic success, features to measure it, important factors), any available additional data can easily be included in the analysis, including faculty data (e.g. competence, criteria of recruitment, academic qualifications) may be to discover new determinants.
Availability of data and materials
Not applicable.
Abbreviations
- (P)NN:
-
(Probabilistic) neural network
- BN:
-
BAYES net
- C:
-
Classification
- CC:
-
Clustering
- DM:
-
Data mining
- DT:
-
Decision tree
- EDM:
-
Educational data mining
- KNN:
-
K-nearest neighbors
- LR:
-
Logistic regression
- NB:
-
Naive Bayes
- NN:
-
Neural network
- R:
-
Regression
- RB:
-
Rule based
- RF:
-
Random forest
- RI:
-
Rule induction
- RT:
-
Random tree
- TE:
-
Tree ensemble
References
Adekitan, A. I. (2018). “Data mining approach to predicting the performance of first year student in a university using the admission requirements,” no. Aina 2002.
Adekitan, A. I., & Salau, O. (2019). The impact of engineering students’ performance in the first three years on their graduation result using educational data mining. Heliyon, 5(2), e01250.
Agrawal, S. (2005). Database Management Systems Fast Algorithms for Mining Association Rules. In In Proc. 20th int. conf. very large data bases, VLDB, (pp. 487–499).
Ahmad, F., Ismail, N. H., & Aziz, A. A. (2015). The Prediction of Students ’ Academic Performance Using Classification Data Mining Techniques, 9(129), 6415–6426.
Al-barrak, M. A., & Al-razgan, M. (2016). Predicting Students Final GPA Using Decision Trees : A Case Study. International Journal of Information and Education Technology, 6(7), 528–533.
Aleryani, A., Wang, W., De, B., & Iglesia, L. (2018). Dealing with missing data and uncertainty in the context of data mining. In International Conference on Hybrid Artificial Intelligence Systems.
Almarabeh, H. (2017). Analysis of students’ performance by using different data mining classifiers. International Journal of Modern Education and Computer Science, 9(8), 9–15.
Alqurashi, E. (2019). Predicting student satisfaction and perceived learning within online learning environments. Distance Education, 40(1), 133–148.
Anoopkumar, M., & Rahman, A. M. J. M. Z. (2016). A Review on Data Mining techniques and factors used in Educational Data Mining to predict student amelioration. In 2016 International Conference on Data Mining and Advanced Computing (SAPIENCE), (pp. 122–133).
Anuradha, C., & Velmurugan, T. (2015). A Comparative Analysis on the Evaluation of Classification Algorithms in the Prediction of Students Performance. Indian Journal of Science and Technology, 8(July), 1–12.
Asif, R., Merceron, A., Abbas, S., & Ghani, N. (2017). Analyzing undergraduate students ’ performance using educational data mining. Computers in Education, 113, 177–194.
Asif, R., Merceron, A., & Pathan, M. K. (2015). Predicting student academic performance at degree level: A case study. International Journal of Intelligent Systems and Applications, 7(1), 49–61.
Baker, R. Y. A. N. S. J. D. (2009). The State of Educational Data Mining in 2009: A Review and Future Visions. Journal of Educational Data Mining, 5(8), 3–16.
Blum, A. L., & Langley, P. (1997). Selection of relevant features and examples in machine learning. Artificial Intelligence, 97(1–2), 245–271.
Bragança, R., Portela, F., & Santos, M. (2019). A regression data mining approach in Lean Production. Concurrency and Computation: Practice and Experience, 31(22), e4449.
Bramer, M. (2016). Principles of data mining. London: Springer London.
Bunce, D. M., & Hutchinson, K. D. (2009). The use of the GALT (Group Assessment of Logical Thinking) as a predictor of academic success in college chemistry. Journal of Chemical Education, 70(3), 183.
Calvet Liñán, L., & Juan Pérez, Á. A. (2015). Educational Data Mining and Learning Analytics: differences, similarities, and time evolution. International Journal of Educational Technology in Higher Education, 12(3), 98.
Chandrashekar, G., & Sahin, F. (2014). A survey on feature selection methods. Computers & Electrical Engineering, 40(1), 16–28.
Chawla, N. V., Bowyer, K. W., Hall, L. O., & Kegelmeyer, W. P. (2002). SMOTE: Synthetic minority over-sampling technique. Journal of Artificial Intelligence Research, 16, 321–357.
Choi, N. (2005). Self-efficacy and self-concept as predictors of college students’ academic performance. Psychology in the Schools, 42(2), 197–205.
Chotmongkol, V., & Jitpimolmard, S. (1993). Cryptococcal intracerebral mass lesions associated with cryptococcal meningitis. The Southeast Asian Journal of Tropical Medicine and Public Health, 24(1), 94–98.
CrowdFlower (2016). Data Science Report, (pp. 8–9).
Dutt, A., Ismail, M. A., & Herawan, T. (2017). A systematic review on educational data mining. IEEE Access, 5, 15991–16005.
El-Sayed, A. A., Mahmood, M. A. M., Meguid, N. A., & Hefny, H. A. (2015). Handling autism imbalanced data using synthetic minority over-sampling technique (SMOTE). In 2015 Third World Conference on Complex Systems (WCCS), (pp. 1–5).
Fayyad, U., & Stolorz, P. (1997). Data mining and KDD: Promise and challenges. Future Generation Computer Systems, 13(2–3), 99–115.
Feelders, A., Daniels, H., & Holsheimer, M. (2000). Methodological and practical aspects of data mining. Information Management, 37(5), 271–281.
Finn, J. D., & Rock, D. A. (1997). Academic success among students at risk for school failure. The Journal of Applied Psychology, 82(2), 221–234.
Flores, M. J., Gámez, J. A., Martínez, A. M., & Puerta, J. M. (2011). Handling numeric attributes when comparing Bayesian network classifiers: Does the discretization method matter? Applied Intelligence, 34(3), 372–385.
García, S., Luengo, J., & Herrera, F. (2015). Data preprocessing in data mining, (vol. 72). Cham: Springer International Publishing.
Garg, R. (2018). Predict Sudent performance in different regions of Punjab. International Journal of Advanced Research in Computer Science, 9(1), 236–241.
Guyon, I., & Elisseeff, A. (2003). An Introduction to Variable and Feature Selection. Journal of Machine Learning Research, 3(Mar), 1157–1182.
Hamoud, A. K., Hashim, A. S., & Awadh, W. A. (2018). Predicting Student Performance in Higher Education Institutions Using Decision Tree Analysis. International Journal of Interactive Multimedia and Artificial Intelligence, inPress, 1.
Han, J., Kamber, M., & Pei, J. (2011). Data mining : concepts and techniques. Elsevier Science. Retrieved from https://www.elsevier.com/books/data-mining-concepts-and-techniques/han/978-0-12-381479-1.
Hand, D. J. (1998). Data mining: Statistics and more? The American Statistician, 52(2), 112–118.
“How to Normalize and Standardize Your Machine Learning Data in Weka.”n.d. [Online]. Available: https://machinelearningmastery.com/normalize-standardize-machine-learning-data-weka/. [Accessed: 11 Jun 2019].
S. Huang, “Predictive modeling and analysis of student academic performance in an engineering dynamics course,” All Grad. Theses Diss., 2011.
Jascaniene, N., Nowak, R., Kostrzewa-Nowak, D., & Kolbowicz, M. (2013). Selected aspects of statistical analyses in sport with the use of STATISTICA software. Central European Journal of Sport Sciences and Medicine, 3(3), 3–11.
Jayaprakash, S. (2018). A Survey on Academic Progression of Students in Tertiary Education using Classification Algorithms. International Journal of Engineering Technology Science and Research IJETSR, 5(2), 136–142.
Kabir, W., Ahmad, M. O., & Swamy, M. N. S. (2015). A novel normalization technique for multimodal biometric systems. In 2015 IEEE 58th International Midwest Symposium on Circuits and Systems (MWSCAS), (pp. 1–4).
Kantardzic, M. (2003). Data mining : concepts, models, methods, and algorithms. Wiley-Interscience. Retrieved from https://ieeexplore-ieee-org.library.iau.edu.sa/book/5265979.
Kaur, P., & Gosain, A. (2018). Comparing the behavior of oversampling and Undersampling approach of class imbalance learning by combining class imbalance problem with noise, (pp. 23–30). Singapore: Springer.
Kavakiotis, I., Tsave, O., Salifoglou, A., Maglaveras, N., Vlahavas, I., & Chouvarda, I. (2017). Machine learning and data mining methods in diabetes research. Computational and Structural Biotechnology Journal, 15, 104–116.
Khoshgoftaar, T. M., Golawala, M., & Van Hulse, J. (2007). An Empirical Study of Learning from Imbalanced Data Using Random Forest. In 19th IEEE International Conference on Tools with Artificial Intelligence (ICTAI 2007), (pp. 310–317).
Kohavi, R., & John, G. H. (1997). Wrappers for feature subset selection. Artificial Intelligence, 97(1–2), 273–324.
Kononenko, I., & Kukar, M. (2007b). Machine learning and data mining. Machine Learning and Data Mining. Woodhead Publishing Limited. https://doi.org/10.1533/9780857099440.
Kuh, G. D., Kinzie, J., Buckley, J. A., Bridges, B. K., & Hayek, J. C. (2006). What matters to student success: A review of the literature commissioned report for the National Symposium on postsecondary student success: Spearheading a dialog on student success.
L. A. D. of S. University of California and F. Foundation for Open Access Statistics., F. (2004). A Handbook of Statistical Analyses using SPSS. Journal of Statistical Software (Vol. 11). Foundation for Open Access Statistics. Retrieved from https://doaj.org/article/d7d17defdbea412f9b8c6a74789d735e.
Linoff, G., & Berry, M. J. A. (2011). Data mining techniques : for marketing, sales, and customer relationship management. Wiley. Retrieved from https://www.wiley.com/en-us/Data+Mining+Techniques%3A+For+Marketing%2C+Sales%2C+and+Customer+Relationship+Management%2C+3rd+Edition-p-9781118087459.
Liu, H., Hussain, F., Tan, C. L., & Dash, M. (2002). Discretization: An enabling technique. Data Mining and Knowledge Discovery, 6(4), 393–423.
Liu, H., & Motoda, H. (1998). Feature selection for knowledge discovery and data mining. US: Springer.
Maheshwari, S., Jain, R. C., & Jadon, R. S. (2017). A Review on Class Imbalance Problem: Analysis and Potential Solutions. International Journal of Computer Science Issues (IJCSI), 14(6), 43-51.
Maimon, Oded and Rokach, L. (2005). Data mining and knowledge discovery handbook. Journal of Experimental Psychology: General (Vol. 136). Springer. Retrieved from https://www.springer.com/gp/book/9780387254654.
Martins, M. P. G., Miguéis, V. L., Fonseca, D. S. B., & Alves, A. (2019). A data mining approach for predicting academic success – A case study, (pp. 45–56). Cham: Springer.
Massaro, A., Maritati, V., & Galiano, A. (2018). Data mining model performance of sales predictive algorithms based on Rapidminer workflows. International Journal of Computer Science & Information Technology, 10(3), 39–56.
Mayhew, M. J., & Simonoff, J. S. (2015). Non-white, no more: Effect coding as an alternative to dummy coding with implications for higher education researchers. Journal of College Student Development, 56(2), 170–175.
McCarthy, R. V., McCarthy, M. M., Ceccucci, W., & Halawi, L. (2019). Introduction to Predictive Analytics. In Applying Predictive Analytics. Springer International Publishing. https://doi.org/10.1007/978-3-030-14038-0.
Mesarić, J., & Šebalj, D. (2016). Decision trees for predicting the academic success of students. Croatian Operational Research Review, 7(2), 367–388.
Mohamed, M. H., & Waguih, H. M. (2017). Early prediction of student success using a data mining classification technique. International Journal of Science and Research, 6(10), 126–131.
Moscoso-Zea, O., Andres-Sampedro, & Lujan-Mora, S. (2016). Datawarehouse design for educational data mining. In 2016 15th International Conference on Information Technology Based Higher Education and Training (ITHET), (pp. 1–6).
Mueen, A., Zafar, B., & Manzoor, U. (2016). Modeling and predicting students’ academic performance using data mining techniques. International Journal of Modern Education and Computer Science, 8(11), 36–42.
“National Commission for Academic Accreditation & Assessment Standards for Quality Assurance and Accreditation of Higher Education Institutions,” 2015.
Nisbet, R., Elder, J. F. (John F., & Miner, G. (2009). Handbook of statistical analysis and data mining applications. Academic Press/Elsevier. Retrieved from https://www.elsevier.com/books/handbook-of-statistical-analysis-and-data-mining-applications/nisbet/978-0-12-416632-5.
Osborne, J. (2002). Notes on the Use of Data Transformation. Practical Assessment, Research, and Evaluation, 8(6), 1–7.
Oshodi, O. S., Aluko, R. O., Daniel, E. I., Aigbavboa, C. O., & Abisuga, A. O. (2018). Towards reliable prediction of academic performance of architecture students using data mining techniques. Journal of Engineering, Design and Technology, 16(3), 385–397.
P. Institute for the S. of L. and E. Langley (1994). Selection of Relevant Features in Machine Learning. In Proceedings of the AAAI Fall symposium on relevance, (pp. 140–144).
Parker, J. D., Hogan, M. J., Eastabrook, J. M., Oke, A., & Wood, L. M. (2006). Emotional intelligence and student retention: Predicting the successful transition from high school to university. Personality and Individual differences, 41(7), 1329–1336.
Parker, J. D. A., Summerfeldt, L. J., Hogan, M. J., & Majeski, S. A. (2004). Emotional intelligence and academic success: Examining the transition from high school to university. Personality and individual differences, 36(1), 163–172.
Patro, S. G. K., & Sahu, K. K. (2015). Normalization: A preprocessing stage. International Advanced Research Journal in Science, Engineering and Technology, 2(3), 20–22.
Pelckmans, K., De Brabanter, J., Suykens, J. A. K., & De Moor, B. (2005). Handling missing values in support vector machine classifiers. Neural Networks, 18(5–6), 684–692.
Peng, Y., Kou, G., Shi, Y., & Chen, Z. (2008). A descriptive framework for the field of data mining and knowledge discovery. International Journal of Information Technology and Decision Making, 7(4), 639–682.
Pérez, B., Castellanos, C., & Correal, D. (2018). Predicting student drop-out rates using data mining techniques: A case study, (pp. 111–125). Cham: Springer.
Pérez, J., Iturbide, E., Olivares, V., Hidalgo, M., Almanza, N., & Martínez, A. (2015). A data preparation methodology in data mining applied to mortality population databases. Advances in Intelligent Systems and Computing, 353, 1173–1182.
Pittman, K. (2008). Comparison of Data Mining Techniques used to Predict Student Retention,” ProQuest Diss. Publ, (vol. 3297573).
Putpuek, N., Rojanaprasert, N., Atchariyachanvanich, K., & Thamrongthanyawong, T. (2018). Comparative Study of Prediction Models for Final GPA Score : A Case Study of Rajabhat Rajanagarindra University. In 2018 IEEE/ACIS 17th International Conference on Computer and Information Science, (pp. 92–97).
Pyle, D., Editor, S., & Cerra, D. D. (1999). Data preparation for data mining. Applied Artificial Intelligence, 17(5), 375–381.
Qazi, N., & Raza, K. (2012). Effect of Feature Selection, SMOTE and under Sampling on Class Imbalance Classification. In 2012 UKSim 14th International Conference on Computer Modelling and Simulation, (pp. 145–150).
Quinlan, J. R. (2014). C4. 5: programs for machine learning. Elsevier. Retrieved from https://www.elsevier.com/books/c45/quinlan/978-0-08-050058-4.
Richard-Eaglin, A. (2017). Predicting student success in nurse practitioner programs. Journal of the American Association of Nurse Practitioners, 29(10), 600–605.
Romero, C., & Ventura, S. (2010). Educational data mining: A review of the state of the art. IEEE Transactions on Systems, Man, and Cybernetics, Part C (Applications and Reviews), 40(6), 601–618.
Ruano, M. V., Ribes, J., Sin, G., Seco, A., & Ferrer, J. (2010). A systematic approach for fine-tuning of fuzzy controllers applied to WWTPs. Environmental Modelling & Software, 25(5), 670–676.
Salman, I., & Vomlel, J. (2017). A machine learning method for incomplete and imbalanced medical data.
Sarala, V., & Krishnaiah, J. (2015). Empirical study of data mining techniques in education system. International Journal of Advances in Computer Science and Technology (IJACST), 4(1), 15–21.
Schumacker, R. (2012). Predicting Student Graduation in Higher Education Using Data Mining Models: a Comparison. University of Alabama Libraries. Retrieved from https://ir.ua.edu/bitstream/handle/123456789/1395/file_1.pdf?sequence=1&isAllowed=y.
Shahiri, A. M., Husain, W., & Rashid, N. A. (2015). A review on predicting Student’s performance using data mining techniques. Procedia Computer Science, 72, 414–422.
Shalabi, L., Shaaban, Z., & Kasasbeh, B. (2006). Data mining: A preprocessing engine. Journal of Computer Science, 2(9), 735–739.
Siguenza-Guzman, L., Saquicela, V., Avila-Ordóñez, E., Vandewalle, J., & Cattrysse, D. (2015). Literature review of data mining applications in academic libraries. Journal of Academic of Librarianship, 41(4), 499–510.
“Simple Methods to deal with Categorical Variables in Predictive Modeling.” n.d. [Online]. Available: https://www.analyticsvidhya.com/blog/2015/11/easy-methods-deal-categorical-variables-predictive-modeling/. Accessed 4 July 2019.
Singh, W., & Kaur, P. (2016). Comparative Analysis of Classification Techniques for Predicting Computer Engineering Students’ Academic Performance. International Journal of Advanced Research in Computer Science, 7(6), 31–36.
M. Sivasakthi, “Classification and Prediction based Data Mining Algorithms to Predict Students ’ Introductory programming Performance,” Icici, 0–4, 2017.
Sumathi, S., & Sivanandam, S. N. (2006). Introduction to data mining and its applications. Springer. Retrieved from https://www.springer.com/gp/book/9783540343509.
Umadevi, S., & Marseline, K. S. J. (2017). A survey on data mining classification algorithms. In 2017 International Conference on Signal Processing and Communication (ICSPC), (pp. 264–268).
“Why One-Hot Encode Data in Machine Learning?” n.d. [Online]. Available: https://machinelearningmastery.com/why-one-hot-encode-data-in-machine-learning/. Accessed 4 July 2019.
Willems, J., Coertjens, L., Tambuyzer, B., & Donche, V. (2019). Identifying science students at risk in the first year of higher education: the incremental value of non-cognitive variables in predicting early academic achievement. European Journal of Psychology of Education, 34(4), 847–872.
Witten, I. H., Frank, E., Hall, M. A., & Pal, C. J. (2016). Data Mining: Practical Machine Learning Tools and Techniques. Data Mining: Practical Machine Learning Tools and Techniques (3rd ed.). Elsevier Inc. https://doi.org/10.1016/c2009-0-19715-5.
Wu, X., et al. (2008). Top 10 algorithms in data mining. Knowledge and Information Systems, 14(1), 1–37.
Xing, W. (2019). Exploring the influences of MOOC design features on student performance and persistence. Distance Education, 40(1), 98–113.
Yassein, N. A., Helali, R. G. M., & Mohomad, S. B. (2017). Information Technology & Software Engineering Predicting Student Academic Performance in KSA using Data Mining Techniques. Journal of Information Technology and Software Engineering, 7(5), 1–5.
York, T. T., Gibson, C., & Rankin, S. (2015). Defining and Measuring Academic Success. Practical Assessment, Research & Evaluation, 20, 5.
Zawacki-Richter, O., Marín, V. I., Bond, M., & Gouverneur, F. (2019). Systematic review of research on artificial intelligence applications in higher education – where are the educators? International Journal of Educational Technology in Higher Education, 16(1), 16–39 Springer Netherlands.
Zhang, L., Niu, D., Li, Y., & Zhang, Z. (2018). A Survey on Privacy Preserving Association Rule Mining. In 2018 5th International Conference on Information Science and Control Engineering (ICISCE), (pp. 93–97).
Acknowledgments
Not applicable.
Funding
Not applicable.
Author information
Authors and Affiliations
Contributions
This study is part of EA’s MS studies requirements under the supervision of DD. EA carried out the literature review, while DD is responsible of the conceptualization of the paper. EA prepared an initial draft of the manuscript, that DD thoroughly re-organized and corrected. Both authors read and approved the final manuscript.
Corresponding author
Ethics declarations
Competing interests
The authors declare that they have no competing interests.
Additional information
Publisher’s Note
Springer Nature remains neutral with regard to jurisdictional claims in published maps and institutional affiliations.
Rights and permissions
Open Access This article is distributed under the terms of the Creative Commons Attribution 4.0 International License (http://creativecommons.org/licenses/by/4.0/), which permits unrestricted use, distribution, and reproduction in any medium, provided you give appropriate credit to the original author(s) and the source, provide a link to the Creative Commons license, and indicate if changes were made.
About this article

Cite this article
Alyahyan, E., Düştegör, D. Predicting academic success in higher education: literature review and best practices. Int J Educ Technol High Educ 17, 3 (2020). https://doi.org/10.1186/s41239-020-0177-7
Received:
Accepted:
Published:
DOI: https://doi.org/10.1186/s41239-020-0177-7