
Abstract
Background
This study aimed to provide reference values for body fat (BF) of basketball players considering sex, measurement method, and competitive level.
Methods
A systematic literature research was conducted using five electronic databases (PubMed, Web of Science, SPORTDiscus, CINAHL, Scopus). BF values were extracted, with analyses conducted using random-effects models and data reported as percentages with 95% confidence intervals (CI).
Results
After screening, 80 articles representing 4335 basketball players were selected. Pooled mean BF was 13.1% (95% CI 12.4–13.8%) for male players and 20.7% (95% CI 19.9–21.5%) for female players. Pooled mean BF was 21.4% (95% CI 18.4–24.3%) measured by dual-energy X-ray absorptiometry (DXA), 15.2% (95% CI 12.8–17.6%) via bioelectrical impedance analysis (BIA), 12.4% (95% CI 10.6–14.2%) via skinfolds and 20.0% (95% CI 13.4–26.6%) via air displacement plethysmography. Pooled mean BF across competitive levels were 13.5% (95% CI 11.6–15.3%) for international, 15.7% (95% CI 14.2–17.2%) for national and 15.1% (95% CI 13.5–16.7%) for regional-level players. As the meta-regression revealed significant effects of sex, measurement method and competitive level on BF, the meta-analysis was adjusted for these moderators. The final model revealed significant differences in BF between male and female players (p < 0.001). BF measured by DXA was significantly higher than that measured by BIA or skinfolds (p < 0.001). International-level players had significantly lower BF than national and regional-level players (p < 0.05).
Conclusions
Despite the limitations of published data, this meta-analysis provides reference values for BF of basketball players. Sex, measurement method and competitive level influence BF values, and therefore must be taken into account when interpreting results.
Key Points
-
This systematic review and meta-analysis found that body fat of basketball players differs according to players’ sex, competitive level as well as by the measurement method implemented
-
Female basketball players have higher body fat than male counterparts. International-level players have lower body fat than national and regional-level players. Across measurement methods, body fat values obtained by DXA are higher than those obtained via BIA and skinfolds.
-
Future studies reporting the body fat of basketball players should specify the reliability of measurement, clearly report the hydration and feeding status prior to measurement, specify the competitive level of the sample by reporting the country and/or region and name of the league in which players competed at the time of the study, and report body fat of players in distinct categories (i.e. sex, competitive level, playing position) for better interpretation of data.
Background
Basketball is one of the most practiced team sports worldwide [1] and has been an Olympic discipline since 1936. The game is characterised by a highly intermittent profile as well as intense neuromuscular actions such as accelerations, decelerations, changes of direction, jumps, lateral sliding and static efforts [2,3,4]. In basketball, the anthropometric profile of players is a strong performance-limiting factor. Between the mid to late twentieth century, major increases in the average height of players [5, 6] were reported in the U.S. National Basketball Association (NBA), demonstrating that in selection processes more importance was given to the screening of the players’ physical profile.
In many sports, including basketball, body composition is an important feature that is regularly assessed by practictioners [6]. The high locomotion demands of basketball [3] impose considerable physical loads on the players’ bodies [7]; therefore, a more favourable body composition profile (e.g. less fat mass) might be beneficial for the athlete. In fact, the relative proportion of body fat (BF) has been shown to be negatively associated with performance of explosive actions such as changes of direction [8] and vertical jumps [9]. Noticeably, these actions are frequent in basketball (e.g. jumps: ~ 1 ± 0.1 per minute; changes of activity every 1–3 s) [2, 3]. Higher BF has also been shown to increase risk of overuse injuries (e.g. patellar tendinopathy) in basketball and volleyball players [10, 11]. Considering also the high training [12, 13] and competition [12] loads imposed during the basketball season, it appears therefore relevant for basketball practitioners to control players’ BF, in order to optimize their performance and guarantee their health.
With regard to body composition assessments in basketball players, the player’s sex must be taken into consideration. Females possess greater BF content compared to their male peers [2, 14], mainly for evolutionary benefits (e.g. pregnancy) and hormonal differences (higher estrogen) [15]. While this notion is widely known, no study has systematically assessed previous data of BF of male and female basketball players, and thus no precise reference values are available to practitioners yet. This is of foremost importance considering that, to be selected at high levels, basketball players are commonly screened for anthropometric characteristics (including BF) [14, 16] and physical capacities which can be influenced by BF (e.g. jumps, changes of direction) [8, 9].
BF is usually quantified by laboratory (e.g. dual-energy X-ray absorptiometry [DXA], air displacement plethysmography [ADP]) and field methods (e.g. skinfold measurement, bioelectrical impedance analysis [BIA]) all of which have their own advantages and disadvantages [17]. However, it is important to note that each method makes its own assumption when estimating BF, which may yield discrepant results in the same group of athletes.
Furthermore, it is reasonable to expect that BF levels would discriminate players of different competitive levels, since the physiological demands are known to be greater in higher compared to lower leagues [2, 3]. Differences in anthropometric and physiological characteristics, such as body height, aerobic capacity and muscle power have been previously reported, with all parameters favouring players in higher leagues [18,19,20]. However, in terms of differences in BF the available body of evidence is less clear. For instance, two previous studies [18, 20] reported lower BF content in higher-level players compared to lower levels, two studies found no differences [19, 21], and one study [22] reported higher BF values in national compared to regional-level players.
Reference values for BF in basketball players are needed by researchers, coaches, and practitioners alike when evaluating players. This information should distinguish between female and male players, help interpretation of values obtained by different measurement techniques, and aid in selection processes [16] and training design [23]. Therefore, the aim of this study was to provide reference values for BF of basketball players considering sex, measurement method, and competitive level.
Methods
Study Design and Searches
A systematic review and meta-analysis was conducted in accordance with the Preferred Reporting Items for Systematic Reviews and Meta-Analyses statement guidelines [24]. A literature search was performed using electronic databases PubMed, Web of Science, SPORTDiscus, CINAHL and Scopus (Fig. 1). The search was limited to peer-reviewed studies from all languages published between January 2010 to June 2020 and was updated November 2021. The following body composition related search terms were combined with the term “basketball” to source pertinent peer-reviewed articles: “body composition” OR “body fat*” OR “fat mass” OR “lean body mass” OR “fat free mass” OR “muscle mass” OR skinfold* OR anthropometr* OR “multi-component model” OR “bioelectrical impedance” OR bioimpedance OR “magnetic resonance imaging” OR “computed tomography” OR “dual-energy X-ray absorptiometry” OR “dual X-ray absorptiometry” OR densitometry OR “underwater weighing” OR “air displacement plethysmography” OR hydrometry OR ultrasound OR “3D photonic scanning”. The literature search and study selection were independently conducted by three researchers (PS, PB and BM) and disagreements were resolved by discussion until consensus was achieved.

Flowchart of study screening and selection. BB basketball. aData for each database represent results of Jun 2020/Nov 2021 searches
Study Inclusion and Exclusion Criteria
After database screening and removal of duplicates, the remaining studies were carefully examined by screening the (1) titles, (2) abstracts and (3) full texts. The following inclusion criteria were applied: (1) participants were healthy basketball players older than 18 years; (2) players were competing at regional, national or international competitions; (3) the full-text of the article was published in a peer-reviewed journal in English, Spanish, Portuguese or German language; and (4) outcome measures included and described at least one method of estimating relative BF.
Studies were considered ineligible for this review if (1) the mean age of the sample was lower than 18 years; (2) some or all basketball players were injured (e.g. rehabilitation study); (3) the full-text of the article was not written in English, Spanish, Portuguese or German language; (4) the term basketball player was used referring to athletes from other sports or recreational basketball players, who did not engage competitively, trained less than at least twice per week and/or had less than a minimum of one year of basketball experience; (5) the BF value was not stated, or not independently reported by sex or measurement method, or the study contained duplicate data (e.g. same sample of another study already included in the search results); (6) the article full-text was not available. Case studies, reviews, conference communications, opinion articles, presentations, theses, book chapters or posters were not included. To complement the literature research, the reference lists of the included studies were also screened. The literature review and selection processes are summarized in Fig. 1.
Data Extraction Strategy
Studies were independently read by three researchers (PS, PB, and BM) for the extraction of the following variables: (1) descriptive information including authors, year of publication and type of study; (2) participant information including sample size, sex, age, body height, body mass and general sample description. Players were assigned to one of three competitive levels: regional, national and international. Players from third national leagues or lower, university athletes or regional teams without further description were considered regional-level, whereas the national level represents players from first or second national leagues, including the National Collegiate Athletic Association (NCAA) divisions 1 and 2. If the study clearly mentioned that players competed at the international level (i.e., members of a national team, club teams competing in international championships) or were playing in the NBA, they were categorised as international level. (3) Measurement information including the technique and equipment and equations used were extracted. The measurement techniques included in the study were: skinfold measurement; BIA; DXA; and ADP. Beside BF as the main variable of interest, lean compartment mass, including absolute (kg) or relative (%) muscle mass, fat free mass, or lean body mass were extracted and reported. For studies reporting multiple assessments (e.g. baseline, post-intervention, follow-up) of the same body composition indicator, the pre-intervention data or initial value were considered. Additional information regarding the ethical approval of studies, preparation for measurements (e.g. clothes, food intake, hydration) and reliability of results was also extracted. If pertinent data were absent, the authors were contacted, and the necessary information was requested via e-mail. In case of no response or unavailability of data, the article was excluded according to ineligibility criteria 5 (no data). Coding was cross-checked between authors and disagreements were settled by discussion until consensus was achieved.
Data Synthesis and Presentation, Potential Effect Modifiers and Reasons for Heterogeneity
Statistical analysis was performed using R version 4.0.3, RStudio version 1.4.1103, and the package Metafor (version 3.0-2) [25]. The outcome variable was BF, and moderator variables were: sex (male, female); method of body composition assessment (ADP, BIA, DXA, and skinfold); and competitive level (international, national and regional) with random effect being the study itself. The pooled mean estimates, and their corresponding 95% confidence intervals (CI) were reported for each performed analysis. The variance of the sample mean BF for each study was calculated (SD2/sample size) and studies were weighted by the inverse of the variance in the meta-analysis models. The random-effects model takes into consideration the residual heterogeneity of studies and it is assessed through Cochran's test of heterogeneity (QE). In addition, I2 statistics were calculated to determine the degree of statistical heterogeneity, with > 75% considered as high statistical heterogeneity. Test statistics for residual heterogeneity by removing a single study were calculated to check for single study influence on residual heterogeneity. Sensitivity analysis was implemented to investigate the influence of the removal of a single study on the pooled estimate. Publication bias was visually inspected by examining the asymmetry of the funnel plots containing pseudo confidence interval regions (white (90%), light grey (95%) and dark grey (99%) areas). Forest plots were used to present pooled means with 95% CI of arbitrarily defined groups (e.g., male international players measured with DXA).
Each moderator variable was first considered independently (e.g. in a separate model including only one moderator). As the analysis demonstrated the statistically significant difference between groups in all single moderator variables (e.g., between females and males, between international and national/regional, and between measurement methods), we subsequently used the moderator sex in combination with another moderator (measurement method or competitive level). Finally, we combined all three moderators in one model. Hence, the model equation for the final model was
where \(\hat{\theta }_{k}\) is the observed mean BF in study \(k\), \(\beta_{0}\) is the mean BF in the arbitrarily chosen reference group of male international players measured with DXA. Further regression coefficients \(\beta_{1}\) to \(\beta_{6}\) represent the change in mean BF due to female sex, measurement with BIA, skinfold or ADP, and national or regional competitive level. \(\varepsilon_{k}\) is a residual term with mean 0 and variance corresponding to the sampling variance of \(\hat{\theta }_{k}\) within the study-specific population of study \(k\). \(\zeta_{k}\) is an additional random effect with mean 0 and variance corresponding to the heterogeneity between studies.
Post-hoc Bonferroni correction was applied for p-values when performing all pairwise comparisons between the four methods of body composition assessment or the three competitive levels.
Results
The search of the five databases resulted in a total of 2563 publications. After removal of duplicates, the titles and abstracts of 1305 studies were read. Following the application of the predetermined inclusion/exclusion criteria to both titles and abstracts, a total of 326 studies remained. Following further inspection of the full texts, 80 studies [2, 8, 9, 16, 18,19,20, 22, 26,27,28,29,30,31,32,33,34,35,36,37,38,39,40,41,42,43,44,45,46,47,48,49,50,51,52,53,54,55,56,57,58,59,60,61,62,63,64,65,66,67,68,69,70,71,72,73,74,75,76,77,78,79,80,81,82,83,84,85,86,87,88,89,90,91,92,93,94,95,96,97] were included into the meta-analysis (see Fig. 1).
A detailed summary of each of the included studies (authors and years of publication, populations, methods and outcomes) can be found in Tables 1, 2, 3 and 4. Across studies, 4335 basketball players were included (3467 male, 868 female) with a mean age ranging from 19.0 [22] to 28.9 [74] years. Mean body mass and body height ranged from 75.0 [28] kg to 105.6 [69] kg and 179.4 [48] cm to 203.0 [70] cm for males and 63.8 [67] kg to 81.1 [34] kg and 164.0 [67] cm to 185.8 [42] cm for females. Mean sample size was 55 players per study and ranged from 7 [74] to 1160 [16]. There were 652 players categorized as “regional level”, 2142 as “national level” and 1518 as “international”, with one study presenting a mixed sample of regional and national level players [91]. For the assessment of BF, 39 studies used skinfold measurements, 23 BIA, 15 DXA and 3 studies used ADP.
Our results revealed that male players had significantly lower BF values compared to their female counterparts (pooled mean for males = 13.2%; 95% CI 12.4–14.0% vs. pooled mean for females = 20.4%; 95% CI 19.4–21.3%; p < 0.001). BF measured by DXA (pooled mean = 21.6%; 95% CI 18.5–24.7%) was significantly higher than BF measured by BIA (pooled mean = 14.7%; 95% CI 12.2–17.3%; p < 0.001) and skinfolds (pooled mean = 12.3%; 95% CI 10.4–14.2%; p < 0.001). Furthermore, BF measured by skinfolds was significantly lower than BF measured by ADP (pooled mean = 20.0%; 95% CI 13.3–26.6%, p = 0.02). Pooled mean BF values across competitive levels were 13.2% for international level players (95% CI 11.3–15.1%), 15.6% for national level players (95% CI 14.0–17.1%) and 15.0% for regional level players (95% CI 13.3–16.6%), with a significant difference found between international and national level players (p < 0.001) as well as international and regional level players (p = 0.02).
A random-effects meta-regression model was used to examine the effects of sex, measurement method and competitive level on BF. Our model combining all variables revealed that BF differences between male and female players stayed significant (p < 0.001) after correcting for competitive level and measurement method. Similarly, the differences between BF as measured by DXA and BIA as well as by DXA and skinfold remained significant (p < 0.001) after accounting for sex and competitive level. By contrast, the differences between BF measured by ADP and skinfolds were no longer significant after adjusting for sex and competitive level. Differences between international players and national players (p = 0.02) as well as differences between international and regional players (p = 0.02) remained significant after adjusting for sex and measurement method. However, sensitivity analysis suggested that the analysis of the influence of competitive level was not completely robust. Exclusion of one study [18] changed the statistical significance. By contrast, the stability of our findings on measurement method and sex were confirmed by the sensitivity and cumulative meta-analyses. The forest plot of the analysis is presented in Fig. 2. The results of meta-analysis according to subgroups adjusted for sex and measurement method are shown in Table 5.

Relative body fat of basketball players: forest plot showing pooled mean estimates and 95% confidence intervals of included studies. ADP air displacement plethysmography; BIA bioelectrical impedance analysis; CI confidence interval; DXA dual-energy X-ray absorptiometry; F female; M male; 1, 2, 3 single study included multiple times in the forest plot as it included data from multiple samples (e.g. male and females; international and regional); * marking different studies from same authors and published in the same year
We found no indication of a publication bias, with most points falling symmetrically within the funnel plot (see Fig. 3). Heterogeneity in our dataset was estimated by Cochran's test of heterogeneity (QE = 2621, p < 0.0001) and I2 statistics (I2 > 75%). The Cochran's test of heterogeneity revealed highly stable outcomes in our case when we ran a sensitivity analysis for p-values by removing single studies step-by-step (i.e., no changes in p-values).
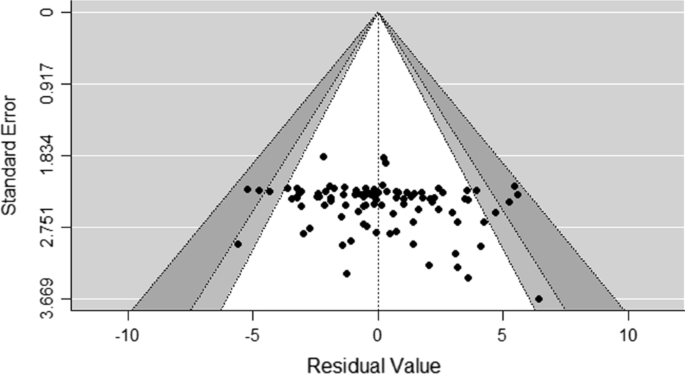
Funnel plot of the model including all moderator variables
Discussion
This is the first systematic review and meta-analysis to examine body fat in basketball players as well as the respective influences of sex, measurement method and competitive level. The main findings of this meta-analysis were: (1) male basketball players have greater BF compared to their female counterparts; (2) considerable differences exist between BF as assessed with different methods, with greater BF values reported from DXA analysis compared to BIA and skinfold estimates; and (3) BF is lower in international level players compared to lower level (i.e. national and regional) players. In general, the BF data obtained by our meta-analysis (see Table 5) are in a healthy, athletic-level range. Aside from this general outcome, as all the factors investigated significantly influenced BF, it is essential to discuss and interpret results in consideration of the player’s sex, competitive level and the measurement method implemented.
Given the increasing popularity of women’s basketball and the general need for more high-quality sports science research focusing on female athletes [98], the present study made a particular effort to evaluate the effect of sex on BF of basketball players by including sex as a potential factor into the meta-regression. As initially expected, BF values were greater in female basketball players than in males. These results were confirmed even when considering the moderating effects of measurement method and competitive levels. While a previous direct comparison across male and female basketball players has shown similar results [2], our study compiled all previous relevant research on body composition of basketball players. Females carry greater BF than males due to biological differences [15] which have to be taken into account by practitioners working with female basketball players, from both performance (e.g. speed, power training) and health (e.g. manipulating training loads to reduce risk of injury) perspectives. Despite the increasing number of publications focusing on female basketball players in recent years, the body of evidence available on women is still much smaller than that available for men (3467 male players included versus 868 female players). Considering the already comparatively low number of female athletes included into this meta-analysis, it should be noted that only 8 of the 44 studies involving female athletes estimated BF content through measurements of skinfold thickness. Hence, the respective reference values reported here must be interpreted carefully. While skinfold assessment has some limitations [99], it is also the least expensive method and most frequently used by practitioners [99]. For these reasons, further research into the anthropometry of female basketball players is warranted to obtain more robust reference data.
Interestingly, considerable differences were found between BF values registered with different measurement methods. BF as measured by DXA was significantly higher compared to BF measured by BIA or skinfolds. Thus, our meta-analysis confirms the results of a single original study, in which BF values measured by different methods were compared in the same sample [30]. Furthermore, it has been observed by various studies that athletes` BF measured by skinfold or BIA is significantly underestimated when directly compared to BF measured by DXA [100, 101]. Given these differences, it is recommended to compare BF values only to reference values derived with the same measurement method (see Table 1, 2, 3, 4, 5). Additionally, results can also be affected by measurement preparation as well as the type of measurement equipment and the computational procedures used for the estimation of BF content [17, 102]. As an example, Golja et al. [102] observed that BF estimates of young, healthy subjects ranged from 6 to 29% across several skinfold regression equations. Similarly, large variability between measurement devices and equations have been found for BIA and DXA derived values of body composition [17, 103]. This carries important implications for practitioners assessing BF levels in athletic cohorts and comparing their results to data reported in the literature. If possible, data should be compared to values obtained with the same measurement equipment and computational procedure. Equally, it is imperative that future studies clearly state both measurement devices and computational procedures. Another important point to consider is measurement methodology standardization. Even though it is well known that factors such as hydration status, food intake, physical activity and temperature can influence all body composition measurement methods [17, 103, 104] about half of the studies included in this review did not provide adequate details regarding measurement methodology standardization. Another secondary finding that might help future research planning is that only about one third of the studies included in this review reported measures of reliability (e.g. coefficient of variation, intraclass correlation coefficient, etc.) for their body fat assessments. However, this is important to ensure that data are sound, and results are accurate.
Regarding competitive levels, we found BF levels to be significantly lower in international-level players compared to national or regional players. However, it should be noted that the sensitivity analysis of the data showed that findings were influenced by single studies, which means caution is needed in their interpretation. While we expected to find lower BF values in higher competitive levels, differences between groups were generally small and could be only observed when comparing the international to lower competitive levels. While lower BF is advantageous for neuromuscular actions such as jumps and changes of directions [8, 9], the game of basketball is also characterised by static efforts. These actions refer to all those situations in which players are stationary and fight to obtain and maintain advantageous position on the court (e.g.to rebound, in picking and low-post situations) [3, 105]. In these specific scenarios, a greater body mass might be advantageous for the player, making him/her less prone to be pushed away from his/her position by an opponent. Since previous studies have shown that higher level players have a greater body mass than lower-level players [19, 20, 22], it is possible that lean compartment mass, rather than BF, is more sensitive in discriminating between basketball players of different competitive levels. While we extracted lean compartment mass from all included studies (see Tables 1, 2, 3, 4), inconsistencies in terminologies and calculation methods used impeded their joint evaluation by meta-analysis. Future studies should address these inconsistencies and clearly state how lean compartment mass was calculated. Nevertheless, our results evidenced that BF content was lower in higher competitive levels in basketball, an expected finding which might be explained by several factors related to competing at higher levels, such as more rigorous anthropometric profiling and selection processes, controlled diet, as well as higher physical, physiological and energetic demands of training and competition.
This study had some limitations. Firstly, most studies did not report reliability measures of the body composition methods implemented, which casts doubt on the reproducibility of included data. Similarly, few studies reported essential information such as hydration and feeding status—factors known to influence body composition measurements [17, 104]. Another limitation regarded the categorisation of competitive level, which could also have influenced our results. We categorised players as international, national or regional, but this classification may improperly reflect the players’ actual competitive or skill level (e.g., the competitive level in a regional league in the U.S. might actually be higher than that in a national league of a country where basketball is less popular). Lastly, since only 19 out of 80 included studies reported BF values by playing position, it was not possible to account for playing position in the present meta-analysis. Players of different positions typically feature significantly different anthropometric characteristics and performance profiles [3, 20], so there is a clear need for future studies to report BF data by playing position.
This study also aimed at critically discussing the shortcomings of research published to date, and to identify promising future research directions. We recommend future studies assessing BF of basketball players to (1) clearly describe computational procedures and measurement devices used to estimate BF (2) specify the reliability of the measurement instruments, (3) clearly control and report the hydration and feeding status prior to measurement, (4) specify the competitive level of the sample by reporting the country and/or region and name of the league in which players competed at the time of the study, and (5) report BF of players in distinct categories (i.e. sex, competitive level, playing position) for better interpretation of data. Additionally, it would be interesting to review the influence of sex, measurement method and competitive level on lean compartment mass values, such as fat free mass, lean body mass and muscle mass. However, inconsistencies in terminology could be an important barrier to the successful (quantitative) comparison of studies investigating lean compartment mass of basketball players.
Conclusion
This meta-analysis summarised and evaluated the available body of evidence on BF of basketball players. The results showed that female basketball players have greater BF than male counterparts. Results for the same basketball players varied depending on the measurement method used; therefore, it is imperative for practitioners assessing BF to compare their players’ BF only with the values obtained in this study for the same measurement method. International-level players appeared to have lower BF than national or regional level players, suggesting that body composition variables can discriminate competitive levels in basketball.
Availability of data and materials
Data will be made available upon reasonable request.
Abbreviations
- ADP:
-
Air displacement plethysmography
- BF:
-
Body fat
- BIA:
-
Bioelectrical impedance analysis
- 95% CI:
-
95% Confidence interval
- DXA:
-
Dual-energy X-ray absorptiometry
- NBA:
-
National Basketball Association
- NCAA:
-
National Collegiate Athletic Association
- QE:
-
Cochran's test of heterogeneity
- SD:
-
Standard deviation
References
Hulteen RM, Smith JJ, Morgan PJ, Barnett LM, Hallal PC, Colyvas K, et al. Global participation in sport and leisure-time physical activities: a systematic review and meta-analysis. Prev Med. 2017;95:14–25. https://doi.org/10.1016/j.ypmed.2016.11.027.
Scanlan AT, Dascombe BJ, Kidcaff AP, Peucker JL, Dalbo VJ. Gender-specific activity demands experienced during semiprofessional basketball game play. Int J Sports Physiol Perform. 2015;10(5):618–25. https://doi.org/10.1123/ijspp.2014-0407.
Stojanovic E, Stojiljkovic N, Scanlan AT, Dalbo VJ, Berkelmans DM, Milanovic Z. The activity demands and physiological responses encountered during basketball match-play: a systematic review. Sport Med. 2018;48(1):111–35. https://doi.org/10.1007/s40279-017-0794-z.
Sansone P, Tessitore A, Paulauskas H, Lukonaitiene I, Tschan H, Pliauga V, et al. Physical and physiological demands and hormonal responses in basketball small-sided games with different tactical tasks and training regimes. J Sci Med Sport. 2019;22(5):602–6. https://doi.org/10.1016/j.jsams.2018.11.017.
Sedeaud A, Marc A, Schipman J, Schaal K, Danial M, Guillaume M, Berthelot G. Toussaint JF secular trend: morphology and performance. J Sports Sci. 2014;32(12):1146–54. https://doi.org/10.1080/02640414.2014.889841.
Drinkwater EJ, Pyne DB, McKenna MJ. Design and interpretation of anthropometric and fitness testing of basketball players. Sport Med. 2008;38(7):565–78. https://doi.org/10.2165/00007256-200838070-00004.
Vanrenterghem J, Nedergaard NJ, Robinson MA, Drust B. Training load monitoring in team sports: a novel framework separating physiological and biomechanical load-adaptation pathways. Sport Med. 2017;47(11):2135–42. https://doi.org/10.1007/s40279-017-0714-2.
Spiteri T, Newton RU, Binetti M, Hart NH, Sheppard JM, Nimphius S. Mechanical Determinants of faster change of direction and agility performance in female basketball athletes. J Strength Cond Res. 2015;29(8):2205–14. https://doi.org/10.1519/JSC.0000000000000876.
Ribeiro BG, Mota HR, Sampaio-Jorge F, Morales AP, Leite TC. Correlation between body composition and the performance of vertical jumps in basketball players. J Exerc Physiol Online. 2015;18(5):69–78.
Visnes H, Bahr R. Training volume and body composition as risk factors for developing jumper’s knee among young elite volleyball players. Scand J Med Sci Sport. 2013;23(5):607–13. https://doi.org/10.1111/j.1600-0838.2011.01430.x.
Sprague AL, Smith AH, Knox P, Pohlig RT, Grävare SK. Modifiable risk factors for patellar tendinopathy in athletes: a systematic review and meta-analysis. Br J Sports Med. 2018;52(24):1575–85. https://doi.org/10.1136/bjsports-2017-099000.
Paulauskas H, Kreivyte R, Scanlan AT, Moreira A, Siupsinskas L, Conte D. Monitoring workload in elite female basketball players during the in-season phase: weekly fluctuations and effect of playing time. Int J Sport Physiol Perform. 2019;14(7):941–8. https://doi.org/10.1123/ijspp.2018-0741.
Sansone P, Gasperi L, Tessitore A, Gomez MA. Training load, recovery and game performance in semi-professional male basketball: Influence of individual characteristics and contextual factors. Biol Sport. 2021;38(2):207–17. https://doi.org/10.5114/BIOLSPORT.2020.98451.
Ziv G, Lidor R. Physical attributes, physiological characteristics, on-court performances and nutritional strategies of female and male basketball players. Sport Med. 2009;39(7):547–68. https://doi.org/10.2165/00007256-200939070-00003.
Karastergiou K, Smith SR, Greenberg AS, Fried SK. Sex differences in human adipose tissues—the biology of pear shape. Biol Sex Differ. 2012;3(1):13. https://doi.org/10.1186/2042-6410-3-13.
Cui Y, Liu F, Bao D, Liu H, Zhang S, Gómez MÁ. Key anthropometric and physical determinants for different playing positions during national basketball association draft combine test. Front Psychol. 2019;10:2359. https://doi.org/10.3389/fpsyg.2019.02359.
Kasper AM, Langan-Evans C, Hudson JF, Brownlee TE, Harper LD, Naughton RJ, et al. Come back skinfolds, all is forgiven: a narrative review of the efficacy of common body composition methods in applied sports practice. Nutrients. 2021. https://doi.org/10.3390/nu13041075.
Pehar M, Sekulic D, Sisic N, Spasic M, Uljevic O, Krolo A, et al. Evaluation of different jumping tests in defining position-specific and performance-level differences in high level basketball players. Biol Sport. 2017;34(3):263–72. https://doi.org/10.5114/biolsport.2017.67122.
Ferioli D, Rampinini E, Bosio A, La Torre A, Azzolini M, Coutts AJ. The physical profile of adult male basketball players: differences between competitive levels and playing positions. J Sports Sci. 2018;36(22):2567–74. https://doi.org/10.1080/02640414.2018.1469241.
Ben Abdelkrim N, Chaouachi A, Chamari K, Chtara M, Castagna C. Positional role and competitive-level differences in elite-level men’s basketball players. J Strength Cond Res. 2010;24(5):1346–55.
Sallet P, Perrier D, Ferret JM, Vitelli V, Baverel G. Physiological differences in professional basketball players as a function of playing position and level of play. J Sports Med Phys Fitness. 2005;45(3):291–4.
Vaquera A, Santiago S, Gerardo VJ, Carlos MJ, Vicente GT. Anthropometric characteristics of spanish professional basketball players. J Hum Kinet. 2015;46(1):99–106. https://doi.org/10.1515/hukin-2015-0038.
Sansone P, Tschan H, Foster C, Tessitore A. Monitoring training load and perceived recovery in female basketball: implications for training design. J Strength Cond Res. 2020;34(10):2929–36. https://doi.org/10.1519/JSC.0000000000002971.
Moher D, Liberati A, Tetzlaff J, Altman DG; PRISMA Group. Preferred reporting items for systematic reviews and meta-analyses: the PRISMA statement. PLoS Med. 2009;6(7):e1000097. https://doi.org/10.1371/journal.pmed.1000097.
Viechtbauer W. Conducting meta-analyses in R with the metafor package. J Stat Softw. 2010;36(3):1–48. https://doi.org/10.18637/jss.v036.i03.
Atalaǧ O, Gotshalk LA, Queen L, Wottlin S. More stress for the eastward travelling student athlete: a preliminary analysis. Isokinet Exerc Sci. 2019;27(4):275–82.
Dobrosielski DA, Leppert KM, Knuth ND, Wilder JN, Kovacs L, Lisman PJ. Body composition values of division 1 female athletes derived from dual-energy X-ray absorptiometry. J Strength Cond Res. 2019;Publish Ah:1–8.
Imeri B, Dureha DK. The study of body composition variables as predictor factors on back spines bone mineral density of basketball players. HealthMED. 2012;6(7):2308–13.
Nepocatych S, Balilionis G, O’Neal EK. Analysis of dietary intake and body composition of female athletes over a competitive season. Montenegrin J Sport Sci Med. 2017;6(2):57–65.
Ploudre A, Arabas JL, Jorn L, Mayhew JL. Comparison of techniques for tracking body composition changes across a season in college women basketball players. Int J Exerc Sci. 2018;11(4):425–38.
Raymond-Pope CJ, Solfest AL, Carbuhn A, Stanforth PR, Oliver J, Bach CW, et al. Total and regional body composition of NCAA Division I collegiate basketball athletes. Int J Sports Med. 2020;41(4):242–7. https://doi.org/10.1055/a-1073-7941.
Rockwell MS, Kostelnik SB, McMillan RP, Lancaster M, Larson-Meyer DE, Hulver MW. An association between bioavailable 25-hydroxyvitamin d and bone mineral density in a diverse cohort of collegiate athletes. Med Sci Sports Exerc. 2021. https://doi.org/10.1249/MSS.0000000000002807.
Sanfilippo J, Krueger D, Heiderscheit B, Binkley N. Dual-energy X-ray absorptiometry body composition in NCAA Division I athletes: exploration of mass distribution. Sports Health. 2019;11(5):453–60. https://doi.org/10.1177/1941738119861572.
Sekel NM, Gallo S, Fields J, Jagim AR, Wagner T, Jones MT. The effects of cholecalciferol supplementation on vitamin d status among a diverse population of collegiate basketball athletes: a quasi-experimental trial. Nutrients. 2020;12(2):1–13. https://doi.org/10.3390/nu12020370.
Stanforth D, Lu T, Stults-Kolehmainen MA, Crim BN, Stanforth PR. Bone mineral content and density among female NCAA Division I athletes across the competitive season and over a multi-year time frame. J Strength Cond Res. 2014;30(10):2828–38.
Zanders BR, Currier BS, Harty PS. Changes in energy expenditure, dietary intake, and energy availability across an entire collegiate women’s basketball season. J Strength Cond Res. 2021;35(3):804–10.
Gantois P, Aidar FJ, Peixoto Dantas M, Medeiros da Silva L, Pinheiros Paes P, Santana EE, et al. Aerobic fitness is associated with improved repeated sprints ability of basketball players after six weeks of training during preseason. Rev Bras Cineantropometria e Desempenho Hum. 2018;20(1):114–24. https://doi.org/10.5007/1980-0037.2018v20n1p114.
Taylor LW, Wilborn C, Roberts MD, White A, Dugan K. Eight weeks of pre-and postexercise whey protein supplementation increases lean body mass and improves performance in division III collegiate female basketball players. Appl Physiol Nutr Metab. 2015;41(3):249–54. https://doi.org/10.1139/apnm-2015-0463.
Sousa S, Hogera Rodrigues WR, de Aguiar Cintra Filho D. Relationship between body composition and performance in vertical jump on different sports. Rev Bras Prescrição e Fisiol do Exerc. 2017;11(71):944–51.
Ljubojevic M, Bojanic D, Krivokapic D, Nokic A. Differences in anthropometric characteristics and body composition between two elite female basketball clubs—champions of slovenia and champions of Montenegro. Sport Mont. 2020;18(3):45–9. https://doi.org/10.26773/smj.201018.
Ljubojevic M, Bojanic D, Bjelica D, Vasiljevic I, Vukotic M. Differences in anthropometric characteristics between two elite female basketball national teams—participants at Eurobasket 2019 in Latvia and Serbia. Int J Morphol. 2020;38(4):857–62.
Mala L, Maly T, Zahalka F, Bunc V, Kaplan A, Jebavy R, et al. Body composition of elite female players in five different sports games. J Hum Kinet. 2015;45(1):207–15. https://doi.org/10.1515/hukin-2015-0021.
Vukašinović-Vesić M, Andjelković M, Stojmenović T, Dikić N, Kostić M, Ćurčić D. Sweat rate and fluid intake in young elite basketball players on the FIBA Europe U20 Championship. Vojnosanit Pregl. 2015;72(12):1063–8. https://doi.org/10.2298/VSP140408073V.
Delextrat A, Trochym E, Calleja-González J. Effect of a typical in-season week on strength jump and sprint performances in national-level female basketball players. J Sport Med Phys Fit. 2012;52:128–36. https://doi.org/10.13140/RG.2.1.5129.4169.
Delextrat A, Calleja-González J, Hippocrate A, Clarke ND. Effects of sports massage and intermittent cold-water immersion on recovery from matches by basketball players. J Sports Sci. 2013;31(1):11–9. https://doi.org/10.1080/02640414.2012.719241.
Delextrat A, Baliqi F, Clarke N. Repeated sprint ability and stride kinematics are altered following an official match in national-level basketball players. J Sport Med Phys Fit. 2013;147(2):135–40. https://doi.org/10.13140/RG.2.1.5129.4169.
Delextrat A, Hippocrate A, Leddington-Wright S, Clarke ND. Including stretches to a massage routine improves recovery from official matches in basketball players. J Strength Cond Res. 2014;28(3):716–27.
Delgado-Floody P, Caamaño-Navarrete F, Carter-Thuillier B, Gallardo-Fuentes F, Ramirez-Campillo R, Cresp Barría M, et al. Comparison of body composition and physical performance between college and professional basketball players. Arch Med del Deport. 2017;34(6):332–6.
Dzedzej A, Ignatiuk W, Jaworska J, Grzywacz T, Lipińska P, Antosiewicz J, et al. The effect of the competitive season in professional basketball on inflammation and iron metabolism. Biol Sport. 2016;33(3):223–9. https://doi.org/10.5604/20831862.1201811.
Gryko K, Kopiczko A, Mikołajec K, Stasny P, Musalek M. Anthropometric variables and somatotype of young and professional male basketball players. Sports. 2018;6(1):9. https://doi.org/10.3390/sports6010009.
Koklu Y, Utku A, Fatma UK, Kocak U, Emre EA. The relationship among body composition, maximal oxygen uptake, sprint ability and T-drill agility tests in first division basketball players. Ovidius Univ Ann Ser Phys Educ Sport Mov Health. 2010;10(2):633–5.
Kukrić A, Petrović B, Dobraš R, Sekulic Z, Vuckovic I. Application of the theoretical model in normalization of vertical jump test results with respect to the body mass. Sportlogia. 2017;13(1):9–17. https://doi.org/10.5550/sgia.171301.en.kpdsv.
Michalczyk M, Zajac A, Mikolajec K, Zydek G, Langfort J. No modification in blood lipoprotein concentration but changes in body composition after 4 weeks of low carbohydrate diet (LCD) followed by 7 days of carbohydrate loading in basketball players. J Hum Kinet. 2018;65(1):125–37.
Michalczyk MM, Chycki J, Zajac A, Maszczyk A, Zydek G, Langfort J. Anaerobic performance after a low-carbohydrate diet (LCD) followed by 7 days of carbohydrate loading in male basketball players. Nutrients. 2019. https://doi.org/10.3390/nu11040778.
Ramos-Campo DJ, Sánchez FM, García PE, Rubio Arias JA, Bores C, Clemente Suarez VJ, et al. Body composition features in different playing position of professional team indoor players: basketball handball and futsal. Int J Morphol. 2014;32(4):1316–24. https://doi.org/10.4067/S0717-95022014000400032.
Stauffer K, Nagle E, Goss F, Robertson R. Assessment of anaerobic power in female division I collegiate basketball players. J Exerc Physiol Online. 2010;13(1):1–9.
Czuba M, Zając A, Maszczyk A, Roczniok R, Poprzęcki S, Garbaciak W, et al. The effects of high intensity interval training in normobaric hypoxia on aerobic capacity in basketball players. J Hum Kinet. 2013;39:103–14.
Delextrat A, Mackessy S, Arceo-Rendon L, Scanlan A, Ramsbottom R, Calleja-Gonzalez J. Effects of three-day serial sodium bicarbonate loading on performance and physiological parameters during a simulated basketball test in female university players. Int J Sport Nutr Exerc Metab. 2018;28(5):547–52. https://doi.org/10.1123/ijsnem.2017-0353.
Kutseryb T, Hrynkiv M, Vovkanych L, Muzyka F. Influence of basketball training on the features of women’s physique. J Phys Educ Sport. 2019;19(4):2384–9. https://doi.org/10.7752/jpes.2019.04361.
Omorczyk J, Ambrozy T, Puszczalowska-Lizis E, Nowak M, Markowksi A. Effects of 6-week basketball training using the modified circuit weight method. Balt J Health Phys Act. 2017;2017(4):44–54. https://doi.org/10.29359/bjhpa.09.4.04.
Salgueiro DFS, Barroso R, Barbosa AC, Telles T, Andries JO. Anthropometric parameters of cadets among different military sports. Int J Morphol. 2015;33(3):831–4. https://doi.org/10.4067/s0717-95022015000300004.
Albaladejo M, Vaquero-Cristóbal R, Esparza-Ros F. Effect of preseason training on anthropometric and derived variables in professional basketball players. Retos. 2019;2041(36):474–9. https://doi.org/10.47197/retos.v36i36.68535.
Calleja-González J, Jukíc I, Ostojic SM, Milanovic L, Zubillaga A, Terrados N. Fitness profile in elite international senior male basketball players. Differences between Croatian and Japan team. Arch Med del Deport. 2010;27(137):181–90.
Doeven SH, Brink MS, Frencken WGP, Lemmink KAPM. Impaired player-coach perceptions of exertion and recovery during match congestion. Int J Sports Physiol Perform. 2017;12(9):1151–6. https://doi.org/10.1123/ijspp.2016-0363.
Gonzalez AM, Hoffman JR, Rogowski JP, Burgos W, Manalo E, Weise K, et al. Performance changes in NBA basketball players vary in starters vs nonstarters over a competitive season. J Strength Cond Res. 2013;27(3):611–5.
Jurić I, Labor S, Plavec D, Labor M. Inspiratory muscle strength affects anaerobic endurance in professional athletes. Arh Hig Rada Toksikol. 2019;70(1):42–8. https://doi.org/10.2478/aiht-2019-70-3182.
Mtsweni LB, West SJ, Taliep MS. Anthropometric and physical fitness characteristics of female basketball players in South Africa. South Afr J Res Sport Phys Educ Recreat. 2017;39(3):93–103.
Ponce-González JG, Olmedillas H, Calleja-González J, Guerra B, Sanchis-Moysi J. Physical fitness, adiposity and testosterone concentrations are associated to playing position in professional basketballers. Nutr Hosp. 2015;31(6):2624–32. https://doi.org/10.3305/nh.2015.31.6.8977.
Tsoufi A, Maraki MI, Dimitrakopoulos L, et al. The effect of professional dietary counseling: elite basketball players eat healthier during competition days. J Sports Med Phys Fitness. 2017;57(10):1305–10. https://doi.org/10.23736/S0022-4707.16.06469-0.
Zhao J, Fan B, Wu Z, Xu M, Luo Y. Serum zinc is associated with plasma leptin and Cu–Zn SOD in elite male basketball athletes. J Trace Elem Med Biol. 2015;30:49–53. https://doi.org/10.1016/j.jtemb.2014.10.005.
Boone J, Bourgois J. Morphological and physiological profile of elite basketball players in Belgium. Int J Sport Physiol Perform. 2013;8(6):630–8. https://doi.org/10.1123/ijspp.8.6.630.
Brini S, Ouerghi N, Bouassida A. Small sided games vs repeated sprint training effects on agility in fasting basketball players. Rev Bras Med Esporte. 2020. https://doi.org/10.1590/1517-869220202603213948.
Chatzinikolaou A, Draganidis D, Avloniti A, Karipidis A, Jamurtas AZ, Skevaki CL, et al. The microcycle of inflammation and performance changes after a basketball match. J Sports Sci. 2014;32(9):870–82. https://doi.org/10.1080/02640414.2013.865251.
Daniel J, Montagner PC, Padovani CR, Beneli LM, Borin JP. Analysis of direct and indirect participation in basketball game actions according to their intensity. Sport TK-Revista Euroam Ciencias del Deport. 2017;6(1):193. https://doi.org/10.6018/293661.
Daniel JF, Montagner PC, Padovani CR, Borin JP. Techniques and tactics in basketball according to the intensity in official matches. Rev Bras Med do Esporte. 2017;23(4):300–3. https://doi.org/10.1590/1517-869220172304167577.
Dragonea P, Zacharakis E, Kounalakis S, Kostopoulos N, Bolatoglou T, Apostolidis N. Determination of the exercise intensity corresponding with maximal lactate steady state in high-level basketball players. Res Sport Med. 2019;27(1):112–20. https://doi.org/10.1080/15438627.2018.1511559.
Gomes JH, Mendes RR, De Almeida MB, Zanetti MC, Leite GDS, Júnior AJF. Relationship between physical fitness and gamerelated statistics in elite professional basketball players: regular season vs. playoffs. Motriz Rev Educ Fis. 2017. https://doi.org/10.1590/S1980-6574201700020004.
Kariyawasam A, Ariyasinghe A, Rajaratnam A, Subasinghe P. Comparative study on skill and health related physical fitness characteristics between national basketball and football players in Sri Lanka. BMC Res Notes. 2019;12(1):397. https://doi.org/10.1186/s13104-019-4434-6.
Korkmaz C, Karahan M. A comparative study on the physical fitness and performance of male basketball players in different divisions. Phys Educ Sport Sci J. 2012;6(1):16–23.
Masanovic B, Popovic S, Bjelica D. Comparative study of anthropometric measurement and body composition between basketball players from different competitive levels: elite and sub-elite. Pedagog Psychol Med Biol Probl Phys Train Sport. 2019;23(4):176–81. https://doi.org/10.15561/18189172.2019.0403.
Peña J, Moreno-Doutres D, Coma J, Buscà B. Anthropometric and fitness profile of high-level basketball, handball and volleyball players. Rev Andaluza Med del Deport. 2018;11(1):30–5. https://doi.org/10.36104/amc.2018.1400.
Pireva A. Anthropometric and body composition differences among elite Kosovo basketball, handball and soccer players. Int J Morphol. 2019;37(3):1067–72. https://doi.org/10.4067/S0717-95022019000301067.
Pluncevic J, Marosevic-Markovski J, Todorovski M, Lekovska T, Manchevska S. Comparison of cardio-physiological and anthropometrical parameters between basketball and football players. Res Phys Ed Sport Health. 2020;9(2):51–6. https://doi.org/10.46733/PESH20920051pg.
Puente C, Abián-Vicén J, Salinero JJ, Lara B, Areces F, Del Coso J. Caffeine improves basketball performance in experienced basketball players. Nutrients. 2017;9(9):1–13. https://doi.org/10.3390/nu9091033.
Sekulic D, Pehar M, Krolo A, Spasic M, Uljevic O, Calleja-González J, et al. Evaluation of basketball-specific agility: applicability of preplanned and nonplanned agility performances for differentiating playing positions and playing levels. J Strength Cond Res. 2017;31(8):2278–88. https://doi.org/10.1519/JSC.0000000000001646.
Thigpen LK, Green JM, O’Neal EK. Hydration profile and sweat loss perception of male and female division ii basketball players during practice. J Strength Cond Res. 2014;28(12):3425–31.
Watson AD, Zabriskie HA, Witherbee KE, Sulavik A, Gieske BT, Kerksick CM. Determining a resting metabolic rate prediction equation for collegiate female athletes. J Strength Cond Res. 2019;33(9):2426–32. https://doi.org/10.1519/JSC.0000000000002856.
De Oliveira GT, Gantois P, Faro HKC, Gantois P, Faro HK, Nascimiento PHD. Vertical jump and handgrip strength in basketball athletes by playing position and performance. J Phys Educ Sport. 2018;18(1):132–7. https://doi.org/10.7752/jpes.2018.01017.
Freitas TT, Calleja-González J, Carlos-Vivas J, Marín-Cascales E, Alcaraz PE. Short-term optimal load training vs a modified complex training in semi-professional basketball players. J Sports Sci. 2019;37(4):434–42. https://doi.org/10.1080/02640414.2018.1504618.
Gomez JG, Verdoy PJ. Characterization of college football athletes and basketball: anthropometry and body composition. E-balonmano.com. J Sport Sci. 2011;7(1):39–51. https://doi.org/10.47189/rcct.v18i19.205.
El MC. perfil esteroideo en jugadores de baloncesto de ambos sexos y su relación con parámetros físicos, genéticos y nutricionales. Kronos A J Interdiscip Synth. 2016;15(1):2.
Pacheco Gabaldón RP, González Peris M, Romeu FM. Nutri-K study: evaluation of potassium intake and sport in young adults. Nutr Clin y Diet Hosp. 2018;38(3):161–7. https://doi.org/10.12873/383romeu.
Scanlan AT, Dascombe BJ, Reaburn PRJ. The construct and longitudinal validity of the basketball exercise simulation test. J Strength Cond Res. 2012;26(2):523–30.
Scanlan A, Humphries B, Tucker PS, Dalbo V. The influence of physical and cognitive factors on reactive agility performance in men basketball players. J Sports Sci. 2013;32(4):367–74. https://doi.org/10.1080/02640414.2013.825730.
Fields J, Merrigan J, White J, Jones M. Seasonal and longitudinal changes in body composition by sport-position in NCAA division I basketball athletes. Sports. 2018;6(3):85. https://doi.org/10.3390/sports6030085.
Fields JB, Metoyer CJ, Casey JC, Esco MR, Jagim AR, Jones MT. Comparison of body composition variables across a large sample of national collegiate athletic association women athletes from 6 competitive sports. J Strength Cond Res. 2018;32(9):2452–7. https://doi.org/10.1519/JSC.0000000000002234.
Ladwig E, Shim A, Yom J, Cross P, Beebe J. Preseason and postseason body composition does not change relative to playing time in division I female basketball players. Int J Exerc Sci. 2013;6(3):208–16.
Elliott-Sale KJ, Minahan CL, de Jonge XAKJ, Ackerman KE, Sipilä S, Constantini NW, et al. Methodological considerations for studies in sport and exercise science with women as participants: a working guide for standards of practice for research on women. Sport Med. 2021;51(5):843–61. https://doi.org/10.1007/s40279-021-01435-8.
Meyer NL, Sundgot-Borgen J, Lohman TG, Ackland TR, Stewart AD, Maughan RJ, et al. Body composition for health and performance: a survey of body composition assessment practice carried out by the ad hoc research working group on body composition, health and performance under the auspices of the IOC medical commission. Br J Sports Med. 2013;47(16):1044–53. https://doi.org/10.1136/bjsports-2013-092561.
McLester CN, Nickerson BS, Klisczczewicz BM, McLester JR. Reliability and agreement of various inbody body composition analyzers as compared to dual-energy X-ray absorptiometry in healthy men and women. J Clin Densitom. 2020. https://doi.org/10.1016/j.jocd.2018.10.008.
Suarez-Arrones L, Petri C, Maldonado RA, Torreno N, Munguia-Izquierdo D, Di Salvo V, et al. Body fat assessment in elite soccer players: cross-validation of different field methods. Sci Med Footb. 2018. https://doi.org/10.1080/24733938.2018.1445871.
Golja P, Robic Pikel T, Zdesar Kotnik K, Flezar M, Selak S, Kapus J, et al. Direct comparison of (Anthropometric) methods for the assessment of body composition. Ann Nutr Metab. 2020. https://doi.org/10.1159/000508514.
Moon JR. Body composition in athletes and sports nutrition: an examination of the bioimpedance analysis technique. Eur J Clin Nutr. 2013. https://doi.org/10.1038/ejcn.2012.165.
Ackland TR, Lohman TG, Sundgot-Borgen J, Maughan RJ, Meyer NL, Stewart AD, et al. Current status of body composition assessment in sport: review and position statement on behalf of the ad hoc research working group on body composition health and performance, under the auspices of the I.O.C. Medical Commission. Sports Med. 2012;42(3):227–49. https://doi.org/10.2165/11597140-000000000-00000.
Sansone P, Ceravolo A, Tessitore A. External, internal, perceived training loads and their relationships in youth basketball players across different positions. Int J Sport Physiol Perform. 2021. https://doi.org/10.1123/ijspp.2020-0962.
Acknowledgements
We would like to thank all the authors who gently provided us with the original data from their articles and answered our queries, and Dr. Robin Ristl for his precious assistance. This article was supported by the Open Access Publishing Fund of the University of Vienna.
Funding
This article was supported by the Open Access Publishing Fund of the University of Vienna.
Author information
Authors and Affiliations
Contributions
PS wrote the manuscript. PS, PB and BM performed the systematic review search. All authors contributed to conception of the systematic review. PS, PB and BM devised the search parameters for the systematic review. All authors contributed to the interpretation of the results. All authors reviewed the manuscript. All authors read and approved the final manuscript.
Corresponding author
Ethics declarations
Ethics approval and consent to participate
Not applicable.
Consent for publication
Not applicable.
Competing interests
The authors, Pierpaolo Sansone, Bojan Makivic, Robert Csapo, Patria Hume, Alejandro Martínez-Rodríguez and Pascal Bauer, declare that they have no competing interests with the content of this article.
Additional information
Publisher's Note
Springer Nature remains neutral with regard to jurisdictional claims in published maps and institutional affiliations.
Rights and permissions
Open Access This article is licensed under a Creative Commons Attribution 4.0 International License, which permits use, sharing, adaptation, distribution and reproduction in any medium or format, as long as you give appropriate credit to the original author(s) and the source, provide a link to the Creative Commons licence, and indicate if changes were made. The images or other third party material in this article are included in the article's Creative Commons licence, unless indicated otherwise in a credit line to the material. If material is not included in the article's Creative Commons licence and your intended use is not permitted by statutory regulation or exceeds the permitted use, you will need to obtain permission directly from the copyright holder. To view a copy of this licence, visit http://creativecommons.org/licenses/by/4.0/.
About this article

Cite this article
Sansone, P., Makivic, B., Csapo, R. et al. Body Fat of Basketball Players: A Systematic Review and Meta-Analysis. Sports Med - Open 8, 26 (2022). https://doi.org/10.1186/s40798-022-00418-x
Received:
Accepted:
Published:
DOI: https://doi.org/10.1186/s40798-022-00418-x