
Abstract
Big data analytics (BDA) in supply chain management (SCM) is receiving a growing attention. This is due to the fact that BDA has a wide range of applications in SCM, including customer behavior analysis, trend analysis, and demand prediction. In this survey, we investigate the predictive BDA applications in supply chain demand forecasting to propose a classification of these applications, identify the gaps, and provide insights for future research. We classify these algorithms and their applications in supply chain management into time-series forecasting, clustering, K-nearest-neighbors, neural networks, regression analysis, support vector machines, and support vector regression. This survey also points to the fact that the literature is particularly lacking on the applications of BDA for demand forecasting in the case of closed-loop supply chains (CLSCs) and accordingly highlights avenues for future research.
Introduction
Nowadays, businesses adopt ever-increasing precision marketing efforts to remain competitive and to maintain or grow their margin of profit. As such, forecasting models have been widely applied in precision marketing to understand and fulfill customer needs and expectations [1]. In doing so, there is a growing attention to analysis of consumption behavior and preferences using forecasts obtained from customer data and transaction records in order to manage products supply chains (SC) accordingly [2, 3].
Supply chain management (SCM) focuses on flow of goods, services, and information from points of origin to customers through a chain of entities and activities that are connected to one another [4]. In typical SCM problems, it is assumed that capacity, demand, and cost are known parameters [5]. However, this is not the case in reality, as there are uncertainties arising from variations in customers’ demand, supplies transportation, organizational risks and lead times. Demand uncertainties, in particular, has the greatest influence on SC performance with widespread effects on production scheduling, inventory planning, and transportation [6]. In this sense, demand forecasting is a key approach in addressing uncertainties in supply chains [7,8,9].
A variety of statistical analysis techniques have been used for demand forecasting in SCM including time-series analysis and regression analysis [10]. With the advancements in information technologies and improved computational efficiencies, big data analytics (BDA) has emerged as a means of arriving at more precise predictions that better reflect customer needs, facilitate assessment of SC performance, improve the efficiency of SC, reduce reaction time, and support SC risk assessment [11].
The focus of this meta-research (literature review) paper is on “demand forecasting” in supply chains. The characteristics of demand data in today’s ever expanding and sporadic global supply chains makes the adoption of big data analytics (and machine learning) approaches a necessity for demand forecasting. The digitization of supply chains [12] and incoporporation Blockchain technologies [13] for better tracking of supply chains further highlights the role of big data analytics. Supply chain data is high dimensional generated across many points in the chain for varied purposes (products, supplier capacities, orders, shipments, customers, retailers, etc.) in high volumes due to plurality of suppliers, products, and customers and in high velocity reflected by many transactions continuously processed across supply chain networks. In the sense of such complexities, there has been a departure from conventional (statistical) demand forecasting approaches that work based on identifying statistically meannignful trends (characterized by mean and variance attributes) across historical data [14], towards intelligent forecasts that can learn from the historical data and intelligently evolve to adjust to predict the ever changing demand in supply chains [15]. This capability is established using big data analytics techniques that extract forecasting rules through discovering the underlying relationships among demand data across supply chain networks [16]. These techniques are computationally intensive to process and require complex machine-programmed algorithms [17].
With SCM efforts aiming at satisfying customer demand while minimizing the total cost of supply, applying machine-learning/data analytics algorithms could facilitate precise (data-driven) demand forecasts and align supply chain activities with these predictions to improve efficiency and satisfaction. Reflecting on these opportunities, in this paper, first a taxonmy of data sources in SCM is proposed. Then, the importance of demand management in SCs is investigated. A meta-research (literature review) on BDA applications in SC demand forecasting is explored according to categories of the algorithms utilized. This review paves the path to a critical discussion of BDA applications in SCM highlighting a number of key findings and summarizing the existing challenges and gaps in BDA applications for demand forecasting in SCs. On that basis, the paper concludes by presenting a number of avenues for future research.
Data in supply chains
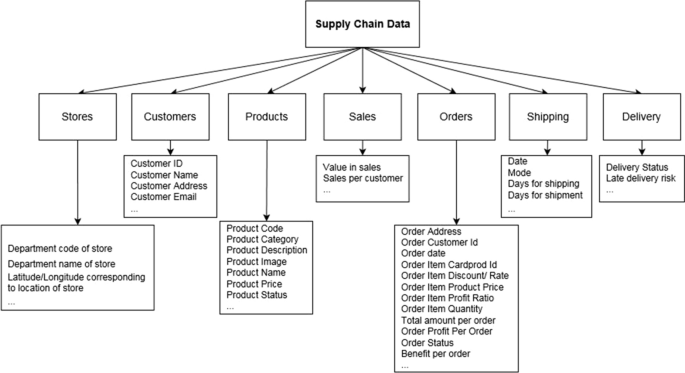
Data in the context of supply chains can be categorized into customer, shipping, delivery, order, sale, store, and product data [18]. Figure 1 provides the taxonomy of supply chain data. As such, SC data originates from different (and segmented) sources such as sales, inventory, manufacturing, warehousing, and transportation. In this sense, competition, price volatilities, technological development, and varying customer commitments could lead to underestimation or overestimation of demand in established forecasts [19]. Therefore, to increase the precision of demand forecast, supply chain data shall be carefully analyzed to enhance knowledge about market trends, customer behavior, suppliers and technologies. Extracting trends and patterns from such data and using them to improve accuracy of future predictions can help minimize supply chain costs [20, 21].
Taxonomy of supply chain data
Analysis of supply chain data has become a complex task due to (1) increasing multiplicity of SC entities, (2) growing diversity of SC configurations depending on the homogeneity or heterogeneity of products, (3) interdependencies among these entities (4) uncertainties in dynamical behavior of these components, (5) lack of information as relate to SC entities; [11], (6) networked manufacturing/production entities due to their increasing coordination and cooperation to achieve a high level customization and adaptaion to varying customers’ needs [22], and finally (7) the increasing adoption of supply chain digitization practices (and use of Blockchain technologies) to track the acitivities across supply chains [12, 13].
Big data analytics (BDA) has been increasingly applied in management of SCs [23], for procurement management (e.g., supplier selection [24], sourcing cost improvement [25], sourcing risk management [26], product research and development [27], production planning and control [28], quality management [29], maintenance, and diagnosis [30], warehousing [31], order picking [32], inventory control [33], logistics/transportation (e.g., intelligent transportation systems [34], logistics planning [35], in-transit inventory management [36], demand management (e.g., demand forecasting [37], demand sensing [38], and demand shaping [39]. A key application of BDA in SCM is to provide accurate forecasting, especially demand forecasting, with the aim of reducing the bullwhip effect [14, 40,41,42].
Big data is defined as high-volume, high-velocity, high-variety, high value, and high veracity data requiring innovative forms of information processing that enable enhanced insights, decision making, and process automation [43]. Volume refers to the extensive size of data collected from multiple sources (spatial dimension) and over an extended period of time (temporal dimension) in SCs. For example, in case of freight data, we have ERP/WMS order and item-level data, tracking, and freight invoice data. These data are generated from sensors, bar codes, Enterprise resource planning (ERP), and database technologies. Velocity can be defined as the rate of generation and delivery of specific data; in other words, it refers to the speed of data collection, reliability of data transferring, efficiency of data storage, and excavation speed of discovering useful knowledge as relate to decision-making models and algorithms. Variety refers to generating varied types of data from diverse sources such as the Internet of Things (IoT), mobile devices, online social networks, and so on. For instance, the vast data from SCM are usually variable due to the diverse sources and heterogeneous formats, particularly resulted from using various sensors in manufacturing sites, highways, retailer shops, and facilitated warehouses. Value refers to the nature of the data that must be discovered to support decision-making. It is the most important yet the most elusive, of the 5 Vs. Veracity refers to the quality of data, which must be accurate and trustworthy, with the knowledge that uncertainty and unreliability may exist in many data sources. Veracity deals with conformity and accuracy of data. Data should be integrated from disparate sources and formats, filtered and validated [23, 44, 45]. In summary, big data analytics techniques can deal with a collection of large and complex datasets that are difficult to process and analyze using traditional techniques [46].
The literature points to multiple sources of big data across the supply chains with varied trade-offs among volume, velocity, variety, value, and veracity attributes [47]. We have summarized these sources and trade-offs in Table 1. Although, the demand forecasts in supply chains belong to the lower bounds of volume, velocity, and variety, however, these forecasts can use data from all sources across the supply chains from low volume/variety/velocity on-the-shelf inventory reports to high volume/variety/velocity supply chain tracking information provided through IoT. This combination of data sources used in SC demand forecasts, with their diverse temporal and spatial attributes, places a greater emphasis on use of big data analytics in supply chains, in general, and demand forecasting efforts, in particular.
The big data analytics applications in supply chain demand forecasting have been reported in both categories of supervised and unsupervised learning. In supervised learning, data will be associated with labels, meaning that the inputs and outputs are known. The supervised learning algorithms identify the underlying relationships between the inputs and outputs in an effort to map the inputs to corresponding outputs given a new unlabeled dataset [48]. For example, in case of a supervised learning model for demand forecasting, future demand can be predicted based on the historical data on product demand [41]. In unsupervised learning, data are unlabeled (i.e. unknown output), and the BDA algorithms try to find the underlying patterns among unlabeled data [48] by analyzing the inputs and their interrelationships. Customer segmentation is an example of unsupervised learning in supply chains that clusters different groups of customers based on their similarity [49]. Many machine-learning/data analytics algorithms can facilitate both supervised learning (extracting the input–output relationships) and unsupervised learning (extracting inputs, outputs and their relationships) [41].
Demand management in supply chains
The term “demand management” emerged in practice in the late 1980s and early 1990s. Traditionally, there are two approaches for demand management. A forward approach which looks at potential demand over the next several years and a backward approach that relies on past or ongoing capabilities in responding to demand [50].
In forward demand management, the focus will be on demand forecasting and planning, data management, and marketing strategies. Demand forecasting and planning refer to predicting the quantities and timings of customers’ requests. Such predictions aim at achieving customers’ satisfaction by meeting their needs in a timely manner [51]. Accurate demand forecasting could improve the efficiency and robustness of production processes (and the associated supply chains) as the resources will be aligned with requirements leading to reduction of inventories and wastes [52, 53].
In the light of the above facts, there are many approaches proposed in the literature and practice for demand forecasting and planning. Spreadsheet models, statistical methods (like moving averages), and benchmark-based judgments are among these approaches. Today, the most widely used demand forecasting and planning tool is Excel. The most widespread problem with spreadsheet models used for demand forecasting is that they are not scalable for large-scale data. In addition, the complexities and uncertainties in SCM (with multiplicity and variability of demand and supply) cannot be extracted, analyzed, and addressed through simple statistical methods such as moving averages or exponential smoothing [50]. During the past decade, traditional solutions for SC demand forecasting and planning have faced many difficulties in driving the costs down and reducing inventories [50]. Although, in some cases, the suggested solutions have improved the day’s payable, they have pushed up the SC costs as a burden to suppliers.
The era of big data and high computing analytics has enabled data processing at a large scale that is efficient, fast, easy, and with reduced concerns about data storage and collection due to cloud services. The emergence of new technologies in data storage and analytics and the abundance of quality data have created new opportunities for data-driven demand forecasting and planning. Demand forecast accuracy can be significantly improved with data-mining algorithms and tools that can sift through data, analyze the results, and learn about the relationships involved. This could lead to highly accurate demand forecasting models that learn from data and are scalable for application in SCM. In the following section, a review of BDA applications in SCM is presented. These applications are categorized based on the employed techniques in establishing the data-drive demand forecasts.
BDA for demand forecasting in SCM
This survey aims at reviewing the articles published in the area of demand and sales forecasting in SC in the presence of big data to provide a classification of the literature based on algorithms utilized as well as a survey of applications. To the best of our knowledge, no comprehensive review of the literature specifically on SC demand forecasting has been conducted with a focus on classification of techniques of data analytics and machine learning. In doing so, we performed a thorough search of the existing literature, through Scopus, Google Scholar, and Elsevier, with publication dates ranging from 2005 to 2019. The keywords used for the search were supply chain, demand forecasting, sales forecasting, big data analytics, and machine learning.
Figure 2 shows the trend analysis of publications in demand forecasting for SC appeared from 2005 to 2019. There is a steadily increasing trend in the number of publications from 2005 to 2019. It is expected that such growth continues in 2020. Reviewing the past 15 years of research on big data analysis/machine learning applications in SC demand forecasting, we identified 64 research papers (excluding books, book chapters, and review papers) and categorized them with respect to the methodologies adopted for demand forecasting. The five most frequently used techniques are listed in Table 2 that includes “Neural Network,” “Regression”, “Time-series forecasting (ARIMA)”, “Support Vector Machine”, and “Decision Tree” methods. This table implies the growing use of big data analysis techniques in SC demand forecasting. It shall be mentioned that there were a few articles using multiple of these techniques.

Distribution of literature in supply chain demand forecasting from 2005 to 2019
It shall be mentioned that there are literature review papers exploring the use of big data analytics in SCM [10, 16, 23, 54,55,56,57,58,59,60,61,62,63,64,65,66,67]. However, this study focuses on the specific topic of “demand forecasting” in SCM to explore BDA applications in line with this particular subtopic in SCM.
As Hofmann and Rutschmann [58] indicated in their literature review, the key questions to answer are why, what and how big data analytics/machine-learning algorithms could enhance forecasts’ accuracy in comparison to conventional statistical forecasting approaches.
Conventional methods have faced a number of limitations for demand forecasting in the context of SCs. There are a lot of parameters influencing the demand in supply chains, however, many of them were not captured in studies using conventional methods for the sake of simplicity. In this regard, the forecasts could only provide a partial understanding of demand variations in supply chains. In addition, the unexplained demand variations could be simply considered as statistical noise. Conventional approaches could provide shorter processing times in exchange for a compromise on robustness and accuracy of predictions. Conventional SC demand forecasting approaches are mostly done manually with high reliance on the planner’s skills and domain knowledge. It would be worthwhile to fully automate the forecasting process to reduce such a dependency [58]. Finally, data-driven techniques could learn to incorporate non-linear behaviors and could thus provide better approximations in demand forecasting compared to conventional methods that are mostly derived based on linear models. There is a significant level of non-linearity in demand behavior in SC particularly due to competition among suppliers, the bullwhip effect, and mismatch between supply and demand [40].
To extract valuable knowledge from a vast amount of data, BDA is used as an advanced analytics technique to obtain the data needed for decision-making. Reduced operational costs, improved SC agility, and increased customer satisfaction are mentioned among the benefits of applying BDA in SCM [68]. Researchers used various BDA techniques and algorithms in SCM context, such as classification, scenario analysis, and optimization [23]. Machine-learning techniques have been used to forecast demand in SCs, subject to uncertainties in prices, markets, competitors, and customer behaviors, in order to manage SCs in a more efficient and profitable manner [40].
BDA has been applied in all stages of supply chains, including procurement, warehousing, logistics/transportation, manufacturing, and sales management. BDA consists of descriptive analytics, predictive analytics, and prescriptive analytics. Descriptive analysis is defined as describing and categorizing what happened in the past. Predictive analytics are used to predict future events and discover predictive patterns within data by using mathematical algorithms such as data mining, web mining, and text mining. Prescriptive analytics apply data and mathematical algorithms for decision-making. Multi-criteria decision-making, optimization, and simulation are among the prescriptive analytics tools that help to improve the accuracy of forecasting [10].
Predictive analytics are the ones mostly utilized in SC demand and procurement forecasting [23]. In this sense, in the following subsections, we will review various predictive big data analytics approaches, presented in the literature for demand forecasting in SCM, categorized based on the employed data analytics/machine learning technique/algorithm, with elaborations of their purpose and applications (summarized in Table 3).
Time-series forecasting
Time series are methodologies for mining complex and sequential data types. In time-series data, sequence data, consisting of long sequences of numeric data, recorded at equal time intervals (e.g., per minute, per hour, or per day). Many natural and human-made processes, such as stock markets, medical diagnosis, or natural phenomenon, can generate time-series data. [48].
In case of demand forecasting using time-series, demand is recorded over time at equal size intervals [69, 70]. Combinations of time-series methods with product or market features have attracted much attention in demand forecasting with BDA. Ma et al. [71] proposed and developed a demand trend-mining algorithm for predictive life cycle design. In their method, they combined three models (a) a decision tree model for large-scale historical data classification, (b) a discrete choice analysis for present and past demand modeling, and (c) an automated time-series forecasting model for future trend analysis. They tested and applied their 3-level approach in smartphone design, manufacturing and remanufacturing.
Time-series approach was used for forecasting of search traffic (service demand) subject to changes in consumer attitudes [37]. Demand forecasting has been achieved through time-series models using exponential smoothing with covariates (ESCov) to provide predictions for short-term, mid-term, and long-term demand trends in the chemical industry SCs [7]. In addition, Hamiche et al. [72] used a customer-responsive time-series approach for SC demand forecasting.
In case of perishable products, with short life cycles, having appropriate (short-term) forecasting is extremely critical. Da Veiga et al. [73] forecasted the demand for a group of perishable dairy products using Autoregressive Integrated Moving Average (ARIMA) and Holt-Winters (HW) models. The results were compared based on mean absolute percentage error (MAPE) and Theil inequality index (U-Theil). The HW model showed a better goodness-of-fit based on both performance metrics.
In case of ARIMA, the accuracy of predictions could diminish where there exists a high level of uncertainty in future patterns of parameters [42, 74,75,76]. HW model forecasting can yield better accuracy in comparison to ARIMA [73]. HW is simple and easy to use. However, data horizon could not be larger than a seasonal cycle; otherwise, the accuracy of forecasts will decrease sharply. This is due to the fact that inputs of an HW model are themselves predicted values subject to longer-term potential inaccuracies and uncertainties [45, 73].
Clustering analysis
Clustering analysis is a data analysis approach that partitions a group of data objects into subgroups based on their similarities. Several applications of clustering analysis has been reported in business analytics, pattern recognition, and web development [48]. Han et al. [48] have emphasized the fact that using clustering customers can be organized into groups (clusters), such that customers within a group present similar characteristic.
A key target of demand forecasting is to identify demand behavior of customers. Extraction of similar behavior from historical data leads to recognition of customer clusters or segments. Clustering algorithms such as K-means, self-organizing maps (SOMs), and fuzzy clustering have been used to segment similar customers with respect to their behavior. The clustering enhances the accuracy of SC demand forecasting as the predictions are established for each segment comprised of similar customers. As a limitation, the clustering methods have the tendency to identify the customers, that do not follow a pattern, as outliers [74, 77].
Hierarchical forecasts of sales data are performed by clustering and categorization of sales patterns. Multivariate ARIMA models have been used in demand forecasting based on point-of-sales data in industrial bakery chains [19]. These bakery goods are ordered and clustered daily with a continuous need to demand forecasts in order to avoid both shortage or waste [19]. Fuel demand forecasting in thermal power plants is another domain with applications of clustering methods. Electricity consumption patterns are derived using a clustering of consumers, and on that basis, demand for the required fuel is established [77].
K-nearest-neighbor (KNN)
KNN is a method of classification that has been widely used for pattern recognition. KNN algorithm identifies the similarity of a given object to the surrounding objects (called tuples) by generating a similarity index. These tuples are described by n attributes. Thus, each tuple corresponds to a point in an n-dimensional space. The KNN algorithm searches for k tuples that are closest to a given tuple [48]. These similarity-based classifications will lead to formation of clusters containing similar objects. KNN can also be integrated into regression analysis problems [78] for dimensionality reduction of the data [79]. In the realm of demand forecasting in SC, Nikolopoulos et al. [80] applied KNN for forecasting sporadic demand in an automotive spare parts supply chain. In another study, KNN is used to forecast future trends of demand for Walmart’s supply chain planning [81].
Artificial neural networks
In artificial neural networks, a set of neurons (input/output units) are connected to one another in different layers in order to establish mapping of the inputs to outputs by finding the underlying correlations between them. The configuration of such networks could become a complex problem, due to a high number of layers and neurons, as well as variability of their types (linear or nonlinear), which needs to follow a data-driven learning process to be established. In doing so, each unit (neuron) will correspond to a weight, that is tuned through a training step [48]. At the end, a weighted network with minimum number of neurons, that could map the inputs to outputs with a minimum fitting error (deviation), is identified.
As the literature reveals, artificial neural networks (ANN) are widely applied for demand forecasting [82,83,84,85]. To improve the accuracy of ANN-based demand predictions, Liu et al. [86] proposed a combination of a grey model and a stacked auto encoder applied to a case study of predicting demand in a Brazilian logistics company subject to transportation disruption [87]. Amirkolaii et al. [88] applied neural networks in forecasting spare parts demand to minimize supply chain shortages. In this case of spare parts supply chain, although there were multiple suppliers to satisfy demand for a variety of spare parts, the demand was subject to high variability due to a varying number of customers and their varying needs. Their proposed ANN-based forecasting approach included (1) 1 input demand feature with 1 Stock-Keeping Unit (SKU), (2) 1 input demand feature with all SKUs, (3) 16 input demand features with 1 SKU, and (4) 16 input demand features with all SKUs. They applied neural networks with back propagation and compared the results with a number of benchmarks reporting a Mean Square Error (MSE) for each configuration scenario.
Huang et al. [89] compared a backpropagation (BP) neural network and a linear regression analysis for forecasting of e-logistics demand in urban and rural areas in China using data from 1997 to 2015. By comparing mean absolute error (MAE) and the average relative errors of backpropagation neural network and linear regression, they showed that backpropagation neural networks could reach higher accuracy (reflecting lower differences between predicted and actual data). This is due to the fact that a Sigmoid function was used as the transfer function in the hidden layer of BP, which is differentiable for nonlinear problems such as the one presented in their case study, whereas the linear regression works well with linear problems.
ANNs have also been applied in demand forecasting for server models with one-week demand prediction ahead of order arrivals. In this regard, Saha et al. [90] proposed an ANN-based forecasting model using a 52-week time-series data fitted through both BP and Radial Basis Function (RBF) networks. A RBF network is similar to a BP network except for the activation/transfer function in RBF that follows a feed-forward process using a radial basis function. RBF results in faster training and convergence to ANN weights in comparison with BP networks without compromising the forecasting precision.
Researchers have combined ANN-based machine-learning algorithms with optimization models to draw optimal courses of actions, strategies, or decisions for future. Chang et al. [91] employed a genetic algorithm in the training phase of a neural network using sales/supply chain data in the printed circuit board industry in Taiwan and presented an evolving neural network-forecasting model. They proposed use of a Genetic Algorithms (GA)-based cost function optimization to arrive at the best configuration of the corresponding neural network for sales forecast with respect to prediction precision. The proposed model was then compared to back-propagation and linear regression approaches using three performance indices of MAPE, Mean Absolute Deviation (MAD), and Total Cost Deviation (TCD), presenting its superior prediction precision.
Regression analysis
Regression models are used to generate continuous-valued functions utilized for prediction. These methods are used to predict the value of a response (dependent) variable with respect to one or more predictor (independent) variables. There are various forms of regression analysis, such as linear, multiple, weighted, symbolic (random), polynomial, nonparametric, and robust. The latter approach is useful when errors fail to satisfy normalcy conditions or when we deal with big data that could contain significant number of outliers [48].
Merkuryeva et al. [92] analyzed three prediction approaches for demand forecasting in the pharmaceutical industry: a simple moving average model, multiple linear regressions, and a symbolic regression with searches conducted through an evolutionary genetic programming. In this experiment, symbolic regression exhibited the best fit with the lowest error.
As perishable products must be sold due to a very short preservation time, demand forecasting for this type of products has drawn increasing attention. Yang and Sutrisno [93] applied and compared regression analysis and neural network techniques to derive demand forecasts for perishable goods. They concluded that accurate daily forecasts are achievable with knowledge of sales numbers in the first few hours of the day using either of the above methods.
Support vector machine (SVM)
SVM is an algorithm that uses a nonlinear mapping to transform a set of training data into a higher dimension (data classes). SVM searches for an optimal separating hyper-plane that can separate the resulting class from another) [48]. Villegas et al. [94] tested the applicability of SVMs for demand forecasting in household and personal care SCs with a dataset comprised of 229 weekly demand series in the UK. Wu [95] applied an SVM, using a particle swarm optimization (PSO) to search for the best separating hyper-plane, classifying the data related to car sales and forecasting the demand in each cluster.
Support vector regression (SVR)
Continuous variable classification problems can be solved by support vector regression (SVR), which is a regression implementation of SVM. The main idea behind SVR regression is the computation of a linear regression function within a high-dimensional feature space. SVR has been applied in financial/cost prediction problems, handwritten digit recognition, and speaker identification, object recognition, etc. [48].
Guanghui [96] used the SVR method for SC needs prediction. The use of SVR in demand forecasting can yield a lower mean square error than RBF neural networks due to the fact that the optimization (cost) function in SVR does not consider the points beyond a margin of distance from the training set. Therefore, this method leads to higher forecast accuracy, although, similar to SVM, it is only applicable to a two-class problem (such as normal versus anomaly detection/estimation problems). Sarhani and El Afia [97] sought to forecast SC demand using SVR and applied Particle swarm optimization (PSO) and GA to optimize SVR parameters. SVR-PSO and SVR-GA approaches were compared with respect to accuracy of predictions using MAPE. The results showed a superior performance by PSO in terms time intensity and MAPE when configuring the SVR parameters.
Mixed approaches
Some works in the literature have used a combination of the aforementioned techniques. In these studies, the data flow into a sequence of algorithms and the outputs of one stage become inputs of the next step. The outputs are explanatory in the form of qualitative and quantitative information with a sequence of useful information extracted out of each algorithm. Examples of such studies include [15, 98,99,100,101,102,103,104,105].
In more complex supply chains with several points of supply, different warehouses, varied customers, and several products, the demand forecasting becomes a high dimensional problem. To address this issue, Islek and Oguducu [100] applied a clustering technique, called bipartite graph clustering, to analyze the patterns of sales for different products. Then, they combined a moving average model and a Bayesian belief network approaches to improve the accuracy of demand forecasting for each cluster. Kilimci et al. [101] developed an intelligent demand forecasting system by applying time-series and regression methods, a support vector regression algorithm, and a deep learning model in a sequence. They dealt with a case involving big amount of data accounting for 155 features over 875 million records. First, they used a principal component analysis for dimension reduction. Then, data clustering was performed. This is followed by demand forecasting for each cluster using a novel decision integration strategy called boosting ensemble. They concluded that the combination of a deep neural network with a boosting strategy yielded the best accuracy, minimizing the prediction error for demand forecasting.
Chen and Lu [98] combined clustering algorithms of SOM, a growing hierarchical self-organizing mapping (GHSOM), and K-means, with two machine-learning techniques of SVR and extreme learning machine (ELM) in sales forecasting of computers. The authors found that the combination of GHSOM and ELM yielded better accuracy and performance in demand forecasts for their computer retailing case study. Difficulties in forecasting also occur in cases with high product variety. For these types of products in an SC, patterns of sales can be extracted for clustered products. Then, for each cluster, a machine-learning technique, such as SVR, can be employed to further improve the prediction accuracy [104].
Brentan et al. [106] used and analyzed various BDA techniques for demand prediction; including support vector machines (SVM), and adaptive neural fuzzy inference systems (ANFIS). They combined the predicted values derived from each machine learning techniques, using a linear regression process to arrive at an average prediction value adopted as the benchmark forecast. The performance (accuracy) of each technique is then analyzed with respect to their mean square root error (RMSE) and MAE values obtained through comparing the target values and the predicted ones.
In summary, Table 3 provides an overview of the recent literature on the application of Predictive BDA in demand forecasting.
Discussions
The data produced in SCs contain a great deal of useful knowledge. Analysis of such massive data can help us to forecast trends of customer behavior, markets, prices, and so on. This can help organizations better adapt to competitive environments. To forecast demand in an SC, with the presences of big data, different predictive BDA algorithms have been used. These algorithms could provide predictive analytics using time-series approaches, auto-regressive methods, and associative forecasting methods [10]. The demand forecasts from these BDA methods could be integrated with product design attributes as well as with online search traffic mapping to incorporate customer and price information [37, 71].
Predictive BDA algorithms
Most of the studies examined, developed and used a certain data-mining algorithm for their case studies. However, there are very few comparative studies available in the literature to provide a benchmark for understanding of the advantages and disadvantages of these methodologies. Additionally, as depicted by Table 3, there is no clear trend between the choice of the BDA algorithm/method and the application domain or category.
Predictive BDA applicability
Most data-driven models used in the literature consider historical data. Such a backward-looking forecasting ignores the new trends and highs and lows in different economic environments. Also, organizational factors, such as reputation and marketing strategies, as well as internal risks (related to availability of SCM resources), could greatly influence the demand [107] and thus contribute to inaccuracy of BDA-based demand predictions using historical data. Incorporating existing driving factors outside the historical data, such as economic instability, inflation, and purchasing power, could help adjust the predictions with respect to unseen future scenarios of demand. Combining predictive algorithms with optimization or simulation can equip the models with prescriptive capabilities in response to future scenarios and expectations.
Predictive BDA in closed-loop supply chains (CLSC)
The combination of forward and reverse flow of material in a SC is referred to as a closed-loop supply chain (CLSC). A CLSC is a more complex system than a traditional SC because it consists of the forward and reverse SC simultaneously [108]. Economic impact, environmental impact, and social responsibility are three significant factors in designing a CLSC network with inclusion of product recycling, remanufacturing, and refurbishment functions. The complexity of a CLSC, compared to a common SC, results from the coordination between backward and forward flows. For example, transportation cost, holding cost, and forecasting demand are challenging issues because of uncertainties in the information flows from the forward chain to the reverse one. In addition, the uncertainties about the rate of returned products and efficiencies of recycling, remanufacturing, and refurbishment functions are some of the main barriers in establishing predictions for the reverse flow [5, 6, 109]. As such, one key finding from this literature survey is that CLSCs particularly deal with the lack of quality data for remanufacturing. Remanufacturing refers to the disassembly of products, cleaning, inspection, storage, reconditioning, replacement, and reassembling. As a result of deficiencies in data, optimal scheduling of remanufacturing functions is cumbersome due to uncertainties in the quality and quantity of used products as well as timing of returns and delivery delays.
IoT-based approaches can overcome the difficulties of collecting data in a CLSC. In an IoT environment, objects are monitored and controlled remotely across existing network infrastructures. This enables more direct integration between the physical world and computer-based systems. The results include improved efficiency, accuracy, and economic benefit across SCs [50, 54, 110].
Radio frequency identification (RFID) is another technology that has become very popular in SCs. RFID can be used for automation of processes in an SC, and it is useful for coordination of forecasts in CLSCs with dispersed points of return and varied quantities and qualities of returned used products [10, 111,112,113,114].
Conclusions
The growing need to customer behavior analysis and demand forecasting is deriven by globalization and increasing market competitions as well as the surge in supply chain digitization practices. In this study, we performed a thorough review for applications of predictive big data analytics (BDA) in SC demand forecasting. The survey overviewed the BDA methods applied to supply chain demand forecasting and provided a comparative categorization of them. We collected and analyzed these studies with respect to methods and techniques used in demand prediction. Seven mainstream techniques were identified and studied with their pros and cons. The neural networks and regression analysis are observed as the two mostly employed techniques, among others. The review also pointed to the fact that optimization models or simulation can be used to improve the accuracy of forecasting through formulating and optimizing a cost function for the fitting of the predictions to data.
One key finding from reviewing the existing literature was that there is a very limited research conducted on the applications of BDA in CLSC and reverse logistics. There are key benefits in adopting a data-driven approach for design and management of CLSCs. Due to increasing environmental awareness and incentives from the government, nowadays a vast quantity of returned (used) products are collected, which are of various types and conditions, received and sorted in many collection points. These uncertainties have a direct impact on the cost-efficiency of remanufacturing processes, the final price of the refurbished products and the demand for these products [115]. As such, design and operation of CLSCs present a case for big data analytics from both supply and demand forecasting perspectives.
Availability of data and materials
The paper presents a review of the literature extracted from main scientific databases without presenting data.
Abbreviations
- ANFIS:
-
Adaptive neural fuzzy inference systems
- ARIMA:
-
Auto regressive integrated moving average
- ANN:
-
Artificial neural network
- BDA:
-
Big data analytics
- BP:
-
Backpropagation
- CLSC:
-
Closed-loop supply chain
- ELM:
-
Extreme learning machine
- ERP:
-
Enterprise resource planning
- GA:
-
Genetic algorithms
- GHSOM:
-
Growing hierarchical self-organizing map
- HW:
-
Holt-winters
- IoT:
-
Internet of things
- KNN:
-
K-nearest-neighbor
- MAD:
-
Mean absolute deviation
- MAE:
-
Mean absolute error
- MAPE:
-
Mean absolute percentage error
- MSE:
-
Mean square error
- RMSE:
-
Mean square root error
- RBF:
-
Radial basis function
- PSO:
-
Particle swarm optimization
- SOMs:
-
Self-organizing maps
- SKU:
-
Stock-keeping unit
- SCA:
-
Supply chain analytics
- SC:
-
Supply chain
- SCM:
-
Supply chain management
- SVM:
-
Support vector machine
- SVR:
-
Support vector regression
- TSF:
-
Time-series forecasting
- TCD:
-
Total cost deviation
- U-Theil:
-
Theil inequality index
References
You Z, Si Y-W, Zhang D, Zeng X, Leung SCH, Li T. A decision-making framework for precision marketing. Expert Syst Appl. 2015;42(7):3357–67. https://doi.org/10.1016/J.ESWA.2014.12.022.
Guo ZX, Wong WK, Li M. A multivariate intelligent decision-making model for retail sales forecasting. Decis Support Syst. 2013;55(1):247–55. https://doi.org/10.1016/J.DSS.2013.01.026.
Wei J-T, Lee M-C, Chen H-K, Wu H-H. Customer relationship management in the hairdressing industry: an application of data mining techniques. Expert Syst Appl. 2013;40(18):7513–8. https://doi.org/10.1016/J.ESWA.2013.07.053.
Lu LX, Swaminathan JM. Supply chain management. Int Encycl Soc Behav Sci. 2015. https://doi.org/10.1016/B978-0-08-097086-8.73032-7.
Gholizadeh H, Tajdin A, Javadian N. A closed-loop supply chain robust optimization for disposable appliances. Neural Comput Appl. 2018. https://doi.org/10.1007/s00521-018-3847-9.
Tosarkani BM, Amin SH. A possibilistic solution to configure a battery closed-loop supply chain: multi-objective approach. Expert Syst Appl. 2018;92:12–26. https://doi.org/10.1016/J.ESWA.2017.09.039.
Blackburn R, Lurz K, Priese B, Göb R, Darkow IL. A predictive analytics approach for demand forecasting in the process industry. Int Trans Oper Res. 2015;22(3):407–28. https://doi.org/10.1111/itor.12122.
Boulaksil Y. Safety stock placement in supply chains with demand forecast updates. Oper Res Perspect. 2016;3:27–31. https://doi.org/10.1016/J.ORP.2016.07.001.
Tang CS. Perspectives in supply chain risk management. Int J Prod Econ. 2006;103(2):451–88. https://doi.org/10.1016/J.IJPE.2005.12.006.
Wang G, Gunasekaran A, Ngai EWT, Papadopoulos T. Big data analytics in logistics and supply chain management: certain investigations for research and applications. Int J Prod Econ. 2016;176:98–110. https://doi.org/10.1016/J.IJPE.2016.03.014.
Awwad M, Kulkarni P, Bapna R, Marathe A. Big data analytics in supply chain: a literature review. In: Proceedings of the international conference on industrial engineering and operations management, 2018(SEP); 2018, p. 418–25.
Büyüközkan G, Göçer F. Digital Supply Chain: literature review and a proposed framework for future research. Comput Ind. 2018;97:157–77.
Kshetri N. 1 Blockchain’s roles in meeting key supply chain management objectives. Int J Inf Manage. 2018;39:80–9.
Michna Z, Disney SM, Nielsen P. The impact of stochastic lead times on the bullwhip effect under correlated demand and moving average forecasts. Omega. 2019. https://doi.org/10.1016/J.OMEGA.2019.02.002.
Zhu Y, Zhao Y, Zhang J, Geng N, Huang D. Spring onion seed demand forecasting using a hybrid Holt-Winters and support vector machine model. PLoS ONE. 2019;14(7):e0219889. https://doi.org/10.1371/journal.pone.0219889.
Govindan K, Cheng TCE, Mishra N, Shukla N. Big data analytics and application for logistics and supply chain management. Transport Res Part E Logist Transport Rev. 2018;114:343–9. https://doi.org/10.1016/J.TRE.2018.03.011.
Bohanec M, Kljajić Borštnar M, Robnik-Šikonja M. Explaining machine learning models in sales predictions. Expert Syst Appl. 2017;71:416–28. https://doi.org/10.1016/J.ESWA.2016.11.010.
Constante F, Silva F, Pereira A. DataCo smart supply chain for big data analysis. Mendeley Data. 2019. https://doi.org/10.17632/8gx2fvg2k6.5.
Huber J, Gossmann A, Stuckenschmidt H. Cluster-based hierarchical demand forecasting for perishable goods. Expert Syst Appl. 2017;76:140–51. https://doi.org/10.1016/J.ESWA.2017.01.022.
Ali MM, Babai MZ, Boylan JE, Syntetos AA. Supply chain forecasting when information is not shared. Eur J Oper Res. 2017;260(3):984–94. https://doi.org/10.1016/J.EJOR.2016.11.046.
Bian W, Shang J, Zhang J. Two-way information sharing under supply chain competition. Int J Prod Econ. 2016;178:82–94. https://doi.org/10.1016/J.IJPE.2016.04.025.
Mourtzis D. Challenges and future perspectives for the life cycle of manufacturing networks in the mass customisation era. Logist Res. 2016;9(1):2.
Nguyen T, Zhou L, Spiegler V, Ieromonachou P, Lin Y. Big data analytics in supply chain management: a state-of-the-art literature review. Comput Oper Res. 2018;98:254–64. https://doi.org/10.1016/J.COR.2017.07.004.
Choi Y, Lee H, Irani Z. Big data-driven fuzzy cognitive map for prioritising IT service procurement in the public sector. Ann Oper Res. 2018;270(1–2):75–104. https://doi.org/10.1007/s10479-016-2281-6.
Huang YY, Handfield RB. Measuring the benefits of erp on supply management maturity model: a “big data” method. Int J Oper Prod Manage. 2015;35(1):2–25. https://doi.org/10.1108/IJOPM-07-2013-0341.
Miroslav M, Miloš M, Velimir Š, Božo D, Đorđe L. Semantic technologies on the mission: preventing corruption in public procurement. Comput Ind. 2014;65(5):878–90. https://doi.org/10.1016/J.COMPIND.2014.02.003.
Zhang Y, Ren S, Liu Y, Si S. A big data analytics architecture for cleaner manufacturing and maintenance processes of complex products. J Clean Prod. 2017;142:626–41. https://doi.org/10.1016/J.JCLEPRO.2016.07.123.
Shu Y, Ming L, Cheng F, Zhang Z, Zhao J. Abnormal situation management: challenges and opportunities in the big data era. Comput Chem Eng. 2016;91:104–13. https://doi.org/10.1016/J.COMPCHEMENG.2016.04.011.
Krumeich J, Werth D, Loos P. Prescriptive control of business processes: new potentials through predictive analytics of big data in the process manufacturing industry. Bus Inform Syst Eng. 2016;58(4):261–80. https://doi.org/10.1007/s12599-015-0412-2.
Guo SY, Ding LY, Luo HB, Jiang XY. A Big-Data-based platform of workers’ behavior: observations from the field. Accid Anal Prev. 2016;93:299–309. https://doi.org/10.1016/J.AAP.2015.09.024.
Chuang Y-F, Chia S-H, Wong J-Y. Enhancing order-picking efficiency through data mining and assignment approaches. WSEAS Transactions on Business and Economics. 2014;11(1):52–64.
Ballestín F, Pérez Á, Lino P, Quintanilla S, Valls V. Static and dynamic policies with RFID for the scheduling of retrieval and storage warehouse operations. Comput Ind Eng. 2013;66(4):696–709. https://doi.org/10.1016/J.CIE.2013.09.020.
Alyahya S, Wang Q, Bennett N. Application and integration of an RFID-enabled warehousing management system—a feasibility study. J Ind Inform Integr. 2016;4:15–25. https://doi.org/10.1016/J.JII.2016.08.001.
Cui J, Liu F, Hu J, Janssens D, Wets G, Cools M. Identifying mismatch between urban travel demand and transport network services using GPS data: a case study in the fast growing Chinese city of Harbin. Neurocomputing. 2016;181:4–18. https://doi.org/10.1016/J.NEUCOM.2015.08.100.
Shan Z, Zhu Q. Camera location for real-time traffic state estimation in urban road network using big GPS data. Neurocomputing. 2015;169:134–43. https://doi.org/10.1016/J.NEUCOM.2014.11.093.
Ting SL, Tse YK, Ho GTS, Chung SH, Pang G. Mining logistics data to assure the quality in a sustainable food supply chain: a case in the red wine industry. Int J Prod Econ. 2014;152:200–9. https://doi.org/10.1016/J.IJPE.2013.12.010.
Jun S-P, Park D-H, Yeom J. The possibility of using search traffic information to explore consumer product attitudes and forecast consumer preference. Technol Forecast Soc Chang. 2014;86:237–53. https://doi.org/10.1016/J.TECHFORE.2013.10.021.
He W, Wu H, Yan G, Akula V, Shen J. A novel social media competitive analytics framework with sentiment benchmarks. Inform Manage. 2015;52(7):801–12. https://doi.org/10.1016/J.IM.2015.04.006.
Marine-Roig E, Anton Clavé S. Tourism analytics with massive user-generated content: a case study of Barcelona. J Destination Market Manage. 2015;4(3):162–72. https://doi.org/10.1016/J.JDMM.2015.06.004.
Carbonneau R, Laframboise K, Vahidov R. Application of machine learning techniques for supply chain demand forecasting. Eur J Oper Res. 2008;184(3):1140–54. https://doi.org/10.1016/J.EJOR.2006.12.004.
Munir K. Cloud computing and big data: technologies, applications and security, vol. 49. Berlin: Springer; 2019.
Rostami-Tabar B, Babai MZ, Ali M, Boylan JE. The impact of temporal aggregation on supply chains with ARMA(1,1) demand processes. Eur J Oper Res. 2019;273(3):920–32. https://doi.org/10.1016/J.EJOR.2018.09.010.
Beyer MA, Laney D. The importance of ‘big data’: a definition. Stamford: Gartner; 2012. p. 2014–8.
Benabdellah AC, Benghabrit A, Bouhaddou I, Zemmouri EM. Big data for supply chain management: opportunities and challenges. In: Proceedings of IEEE/ACS international conference on computer systems and applications, AICCSA, no. 11, p. 20–26; 2016. https://doi.org/10.1109/AICCSA.2016.7945828.
Kumar M. Applied big data analytics in operations management. Appl Big Data Anal Oper Manage. 2016. https://doi.org/10.4018/978-1-5225-0886-1.
Zhong RY, Huang GQ, Lan S, Dai QY, Chen X, Zhang T. A big data approach for logistics trajectory discovery from RFID-enabled production data. Int J Prod Econ. 2015;165:260–72. https://doi.org/10.1016/J.IJPE.2015.02.014.
Varela IR, Tjahjono B. Big data analytics in supply chain management: trends and related research. In: 6th international conference on operations and supply chain management, vol. 1, no. 1, p. 2013–4; 2014. https://doi.org/10.13140/RG.2.1.4935.2563.
Han J, Kamber M, Pei J. Data mining: concepts and techniques. Burlington: Morgan Kaufmann Publishers; 2013. https://doi.org/10.1016/B978-0-12-381479-1.00001-0.
Arunachalam D, Kumar N. Benefit-based consumer segmentation and performance evaluation of clustering approaches: an evidence of data-driven decision-making. Expert Syst Appl. 2018;111:11–34. https://doi.org/10.1016/J.ESWA.2018.03.007.
Chase CW. Next generation demand management: people, process, analytics, and technology. Hoboken: Wiley; 2016.
SAS Institute. Demand-driven forecasting and planning: take responsiveness to the next level. 13; 2014. https://www.sas.com/content/dam/SAS/en_us/doc/whitepaper2/demand-driven-forecasting-planning-107477.pdf.
Acar Y, Gardner ES. Forecasting method selection in a global supply chain. Int J Forecast. 2012;28(4):842–8. https://doi.org/10.1016/J.IJFORECAST.2011.11.003.
Ma S, Fildes R, Huang T. Demand forecasting with high dimensional data: the case of SKU retail sales forecasting with intra- and inter-category promotional information. Eur J Oper Res. 2016;249(1):245–57. https://doi.org/10.1016/J.EJOR.2015.08.029.
Addo-Tenkorang R, Helo PT. Big data applications in operations/supply-chain management: a literature review. Comput Ind Eng. 2016;101:528–43. https://doi.org/10.1016/J.CIE.2016.09.023.
Agrawal S, Singh RK, Murtaza Q. A literature review and perspectives in reverse logistics. Resour Conserv Recycl. 2015;97:76–92. https://doi.org/10.1016/J.RESCONREC.2015.02.009.
Gunasekaran A, Kumar Tiwari M, Dubey R, Fosso Wamba S. Big data and predictive analytics applications in supply chain management. Comput Ind Eng. 2016;101:525–7. https://doi.org/10.1016/J.CIE.2016.10.020.
Hazen BT, Skipper JB, Ezell JD, Boone CA. Big data and predictive analytics for supply chain sustainability: a theory-driven research agenda. Comput Ind Eng. 2016;101:592–8. https://doi.org/10.1016/J.CIE.2016.06.030.
Hofmann E, Rutschmann E. Big data analytics and demand forecasting in supply chains: a conceptual analysis. Int J Logist Manage. 2018;29(2):739–66. https://doi.org/10.1108/IJLM-04-2017-0088.
Jain A, Sanders NR. Forecasting sales in the supply chain: consumer analytics in the big data era. Int J Forecast. 2019;35(1):170–80. https://doi.org/10.1016/J.IJFORECAST.2018.09.003.
Jin J, Liu Y, Ji P, Kwong CK. Review on recent advances in information mining from big consumer opinion data for product design. J Comput Inf Sci Eng. 2018;19(1):010801. https://doi.org/10.1115/1.4041087.
Kumar R, Mahto D. Industrial forecasting support systems and technologies in practice: a review. Glob J Res Eng. 2013;13(4):17–33.
Mishra D, Gunasekaran A, Papadopoulos T, Childe SJ. Big Data and supply chain management: a review and bibliometric analysis. Ann Oper Res. 2016;270(1):313–36. https://doi.org/10.1007/s10479-016-2236-y.
Ren S, Zhang Y, Liu Y, Sakao T, Huisingh D, Almeida CMVB. A comprehensive review of big data analytics throughout product lifecycle to support sustainable smart manufacturing: a framework, challenges and future research directions. J Clean Prod. 2019;210:1343–65. https://doi.org/10.1016/J.JCLEPRO.2018.11.025.
Singh Jain AD, Mehta I, Mitra J, Agrawal S. Application of big data in supply chain management. Mater Today Proc. 2017;4(2):1106–15. https://doi.org/10.1016/J.MATPR.2017.01.126.
Souza GC. Supply chain analytics. Bus Horiz. 2014;57(5):595–605. https://doi.org/10.1016/J.BUSHOR.2014.06.004.
Tiwari S, Wee HM, Daryanto Y. Big data analytics in supply chain management between 2010 and 2016: insights to industries. Comput Ind Eng. 2018;115:319–30. https://doi.org/10.1016/J.CIE.2017.11.017.
Zhong RY, Newman ST, Huang GQ, Lan S. Big Data for supply chain management in the service and manufacturing sectors: challenges, opportunities, and future perspectives. Comput Ind Eng. 2016;101:572–91. https://doi.org/10.1016/J.CIE.2016.07.013.
Ramanathan U, Subramanian N, Parrott G. Role of social media in retail network operations and marketing to enhance customer satisfaction. Int J Oper Prod Manage. 2017;37(1):105–23. https://doi.org/10.1108/IJOPM-03-2015-0153.
Coursera. Supply chain planning. Coursera E-Learning; 2019. https://www.coursera.org/learn/planning.
Villegas MA, Pedregal DJ. Supply chain decision support systems based on a novel hierarchical forecasting approach. Decis Support Syst. 2018;114:29–36. https://doi.org/10.1016/J.DSS.2018.08.003.
Ma J, Kwak M, Kim HM. Demand trend mining for predictive life cycle design. J Clean Prod. 2014;68:189–99. https://doi.org/10.1016/J.JCLEPRO.2014.01.026.
Hamiche K, Abouaïssa H, Goncalves G, Hsu T. A robust and easy approach for demand forecasting in supply chains. IFAC-PapersOnLine. 2018;51(11):1732–7. https://doi.org/10.1016/J.IFACOL.2018.08.206.
Da Veiga CP, Da Veiga CRP, Catapan A, Tortato U, Da Silva WV. Demand forecasting in food retail: a comparison between the Holt-Winters and ARIMA models. WSEAS Trans Bus Econ. 2014;11(1):608–14.
Murray PW, Agard B, Barajas MA. Forecasting supply chain demand by clustering customers. IFAC-PapersOnLine. 2015;48(3):1834–9. https://doi.org/10.1016/J.IFACOL.2015.06.353.
Ramos P, Santos N, Rebelo R. Performance of state space and ARIMA models for consumer retail sales forecasting. Robot Comput Integr Manuf. 2015;34:151–63. https://doi.org/10.1016/J.RCIM.2014.12.015.
Schaer O, Kourentzes N. Demand forecasting with user-generated online information. Int J Forecast. 2019;35(1):197–212. https://doi.org/10.1016/J.IJFORECAST.2018.03.005.
Pang Y, Yao B, Zhou X, Zhang Y, Xu Y, Tan Z. Hierarchical electricity time series forecasting for integrating consumption patterns analysis and aggregation consistency; 2018. In: IJCAI international joint conference on artificial intelligence; 2018, p. 3506–12.
Goyal R, Chandra P, Singh Y. Suitability of KNN regression in the development of interaction based software fault prediction models. IERI Procedia. 2014;6:15–21. https://doi.org/10.1016/J.IERI.2014.03.004.
Runkler TA. Data analytics (models and algorithms for intelligent data analysis). In: Revista Espanola de las Enfermedades del Aparato Digestivo (Vol. 26, Issue 4). Springer Fachmedien Wiesbaden; 2016. https://doi.org/10.1007/978-3-658-14075-5.
Nikolopoulos KI, Babai MZ, Bozos K. Forecasting supply chain sporadic demand with nearest neighbor approaches. Int J Prod Econ. 2016;177:139–48. https://doi.org/10.1016/j.ijpe.2016.04.013.
Gaur M, Goel S, Jain E. Comparison between nearest Neighbours and Bayesian network for demand forecasting in supply chain management. In: 2015 international conference on computing for sustainable global development, INDIACom 2015, May; 2015, p. 1433–6.
Burney SMA, Ali SM, Burney S. A survey of soft computing applications for decision making in supply chain management. In: 2017 IEEE 3rd international conference on engineering technologies and social sciences, ICETSS 2017, 2018, p. 1–6. https://doi.org/10.1109/ICETSS.2017.8324158.
González Perea R, Camacho Poyato E, Montesinos P, Rodríguez Díaz JA. Optimisation of water demand forecasting by artificial intelligence with short data sets. Biosyst Eng. 2019;177:59–66. https://doi.org/10.1016/J.BIOSYSTEMSENG.2018.03.011.
Vhatkar S, Dias J. Oral-care goods sales forecasting using artificial neural network model. Procedia Comput Sci. 2016;79:238–43. https://doi.org/10.1016/J.PROCS.2016.03.031.
Wong WK, Guo ZX. A hybrid intelligent model for medium-term sales forecasting in fashion retail supply chains using extreme learning machine and harmony search algorithm. Int J Prod Econ. 2010;128(2):614–24. https://doi.org/10.1016/J.IJPE.2010.07.008.
Liu C, Shu T, Chen S, Wang S, Lai KK, Gan L. An improved grey neural network model for predicting transportation disruptions. Expert Syst Appl. 2016;45:331–40. https://doi.org/10.1016/J.ESWA.2015.09.052.
Yuan WJ, Chen JH, Cao JJ, Jin ZY. Forecast of logistics demand based on grey deep neural network model. Proc Int Conf Mach Learn Cybern. 2018;1:251–6. https://doi.org/10.1109/ICMLC.2018.8527006.
Amirkolaii KN, Baboli A, Shahzad MK, Tonadre R. Demand forecasting for irregular demands in business aircraft spare parts supply chains by using artificial intelligence (AI). IFAC-PapersOnLine. 2017;50(1):15221–6. https://doi.org/10.1016/J.IFACOL.2017.08.2371.
Huang L, Xie G, Li D, Zou C. Predicting and analyzing e-logistics demand in urban and rural areas: an empirical approach on historical data of China. Int J Performabil Eng. 2018;14(7):1550–9. https://doi.org/10.23940/ijpe.18.07.p19.15501559.
Saha C, Lam SS, Boldrin W. Demand forecasting for server manufacturing using neural networks. In: Proceedings of the 2014 industrial and systems engineering research conference, June 2014; 2015.
Chang P-C, Wang Y-W, Tsai C-Y. Evolving neural network for printed circuit board sales forecasting. Expert Syst Appl. 2005;29(1):83–92. https://doi.org/10.1016/J.ESWA.2005.01.012.
Merkuryeva G, Valberga A, Smirnov A. Demand forecasting in pharmaceutical supply chains: a case study. Procedia Comput Sci. 2019;149:3–10. https://doi.org/10.1016/J.PROCS.2019.01.100.
Yang CL, Sutrisno H. Short-term sales forecast of perishable goods for franchise business. In: 2018 10th international conference on knowledge and smart technology: cybernetics in the next decades, KST 2018, p. 101–5; 2018. https://doi.org/10.1109/KST.2018.8426091.
Villegas MA, Pedregal DJ, Trapero JR. A support vector machine for model selection in demand forecasting applications. Comput Ind Eng. 2018;121:1–7. https://doi.org/10.1016/J.CIE.2018.04.042.
Wu Q. The hybrid forecasting model based on chaotic mapping, genetic algorithm and support vector machine. Expert Syst Appl. 2010;37(2):1776–83. https://doi.org/10.1016/J.ESWA.2009.07.054.
Guanghui W. Demand forecasting of supply chain based on support vector regression method. Procedia Eng. 2012;29:280–4. https://doi.org/10.1016/J.PROENG.2011.12.707.
Sarhani M, El Afia A. Intelligent system based support vector regression for supply chain demand forecasting. In: 2014 2nd world conference on complex systems, WCCS 2014; 2015, p. 79–83. https://doi.org/10.1109/ICoCS.2014.7060941.
Chen IF, Lu CJ. Sales forecasting by combining clustering and machine-learning techniques for computer retailing. Neural Comput Appl. 2017;28(9):2633–47. https://doi.org/10.1007/s00521-016-2215-x.
Fasli M, Kovalchuk Y. Learning approaches for developing successful seller strategies in dynamic supply chain management. Inf Sci. 2011;181(16):3411–26. https://doi.org/10.1016/J.INS.2011.04.014.
Islek I, Oguducu SG. A retail demand forecasting model based on data mining techniques. In: IEEE international symposium on industrial electronics; 2015, p. 55–60. https://doi.org/10.1109/ISIE.2015.7281443.
Kilimci ZH, Akyuz AO, Uysal M, Akyokus S, Uysal MO, Atak Bulbul B, Ekmis MA. An improved demand forecasting model using deep learning approach and proposed decision integration strategy for supply chain. Complexity. 2019;2019:1–15. https://doi.org/10.1155/2019/9067367.
Loureiro ALD, Miguéis VL, da Silva LFM. Exploring the use of deep neural networks for sales forecasting in fashion retail. Decis Support Syst. 2018;114:81–93. https://doi.org/10.1016/J.DSS.2018.08.010.
Punam K, Pamula R, Jain PK. A two-level statistical model for big mart sales prediction. In: 2018 international conference on computing, power and communication technologies, GUCON 2018; 2019. https://doi.org/10.1109/GUCON.2018.8675060.
Puspita PE, İnkaya T, Akansel M. Clustering-based Sales Forecasting in a Forklift Distributor. In: Uluslararası Muhendislik Arastirma ve Gelistirme Dergisi, 1–17; 2019. https://doi.org/10.29137/umagd.473977.
Thomassey S. Sales forecasts in clothing industry: the key success factor of the supply chain management. Int J Prod Econ. 2010;128(2):470–83. https://doi.org/10.1016/J.IJPE.2010.07.018.
Brentan BM, Ribeiro L, Izquierdo J, Ambrosio JK, Luvizotto E, Herrera M. Committee machines for hourly water demand forecasting in water supply systems. Math Probl Eng. 2019;2019:1–11. https://doi.org/10.1155/2019/9765468.
Mafakheri F, Breton M, Chauhan S. Project-to-organization matching: an integrated risk assessment approach. Int J IT Project Manage. 2012;3(3):45–59. https://doi.org/10.4018/jitpm.2012070104.
Mafakheri F, Nasiri F. Revenue sharing coordination in reverse logistics. J Clean Prod. 2013;59:185–96. https://doi.org/10.1016/J.JCLEPRO.2013.06.031.
Bogataj M. Closed Loop Supply Chain (CLSC): economics, modelling, management and control. Int J Prod Econ. 2017;183:319–21. https://doi.org/10.1016/J.IJPE.2016.11.020.
Hopkins J, Hawking P. Big Data Analytics and IoT in logistics: a case study. Int J Logist Manage. 2018;29(2):575–91. https://doi.org/10.1108/IJLM-05-2017-0109.
de Oliveira CM, Soares PJSR, Morales G, Arica J, Matias IO. RFID and its applications on supply chain in Brazil: a structured literature review (2006–2016). Espacios. 2017;38(31). https://www.scopus.com/inward/record.uri?eid=2-s2.0-85021922345&partnerID=40&md5=f062191611541391ded4cdb73eea55cb.
Griva A, Bardaki C, Pramatari K, Papakiriakopoulos D. Retail business analytics: customer visit segmentation using market basket data. Expert Syst Appl. 2018;100:1–16. https://doi.org/10.1016/J.ESWA.2018.01.029.
Lee CKM, Ho W, Ho GTS, Lau HCW. Design and development of logistics workflow systems for demand management with RFID. Expert Syst Appl. 2011;38(5):5428–37. https://doi.org/10.1016/J.ESWA.2010.10.012.
Mohebi E, Marquez L. Application of machine learning and RFID in the stability optimization of perishable foods; 2008.
Jiao Z, Ran L, Zhang Y, Li Z, Zhang W. Data-driven approaches to integrated closed-loop sustainable supply chain design under multi-uncertainties. J Clean Prod. 2018;185:105–27.
Levis AA, Papageorgiou LG. Customer demand forecasting via support vector regression analysis. Chem Eng Res Des. 2005;83(8):1009–18. https://doi.org/10.1205/CHERD.04246.
Chi H-M, Ersoy OK, Moskowitz H, Ward J. Modeling and optimizing a vendor managed replenishment system using machine learning and genetic algorithms. Eur J Oper Res. 2007;180(1):174–93. https://doi.org/10.1016/J.EJOR.2006.03.040.
Sun Z-L, Choi T-M, Au K-F, Yu Y. Sales forecasting using extreme learning machine with applications in fashion retailing. Decis Support Syst. 2008;46(1):411–9. https://doi.org/10.1016/J.DSS.2008.07.009.
Efendigil T, Önüt S, Kahraman C. A decision support system for demand forecasting with artificial neural networks and neuro-fuzzy models: a comparative analysis. Expert Syst Appl. 2009;36(3):6697–707. https://doi.org/10.1016/J.ESWA.2008.08.058.
Lee CC, Ou-Yang C. A neural networks approach for forecasting the supplier’s bid prices in supplier selection negotiation process. Expert Syst Appl. 2009;36(2):2961–70. https://doi.org/10.1016/J.ESWA.2008.01.063.
Chen F-L, Chen Y-C, Kuo J-Y. Applying Moving back-propagation neural network and Moving fuzzy-neuron network to predict the requirement of critical spare parts. Expert Syst Appl. 2010;37(9):6695–704. https://doi.org/10.1016/J.ESWA.2010.04.037.
Wu Q. Product demand forecasts using wavelet kernel support vector machine and particle swarm optimization in manufacture system. J Comput Appl Math. 2010;233(10):2481–91. https://doi.org/10.1016/J.CAM.2009.10.030.
Babai MZ, Ali MM, Boylan JE, Syntetos AA. Forecasting and inventory performance in a two-stage supply chain with ARIMA(0,1,1) demand: theory and empirical analysis. Int J Prod Econ. 2013;143(2):463–71. https://doi.org/10.1016/J.IJPE.2011.09.004.
Kourentzes N. Intermittent demand forecasts with neural networks. Int J Prod Econ. 2013;143(1):198–206. https://doi.org/10.1016/J.IJPE.2013.01.009.
Lau HCW, Ho GTS, Zhao Y. A demand forecast model using a combination of surrogate data analysis and optimal neural network approach. Decis Support Syst. 2013;54(3):1404–16. https://doi.org/10.1016/J.DSS.2012.12.008.
Arunraj NS, Ahrens D. A hybrid seasonal autoregressive integrated moving average and quantile regression for daily food sales forecasting. Int J Prod Econ. 2015;170:321–35. https://doi.org/10.1016/J.IJPE.2015.09.039.
Di Pillo G, Latorre V, Lucidi S, Procacci E. An application of support vector machines to sales forecasting under promotions. 4OR. 2016. https://doi.org/10.1007/s10288-016-0316-0.
da Veiga CP, da Veiga CRP, Puchalski W, dos Coelho LS, Tortato U. Demand forecasting based on natural computing approaches applied to the foodstuff retail segment. J Retail Consumer Serv. 2016;31:174–81. https://doi.org/10.1016/J.JRETCONSER.2016.03.008.
Chawla A, Singh A, Lamba A, Gangwani N, Soni U. Demand forecasting using artificial neural networks—a case study of American retail corporation. In: Applications of artificial intelligence techniques in wind power generation. Integrated Computer-Aided Engineering; 2018, p. 79–90. https://doi.org/10.3233/ica-2001-8305.
Pereira MM, Machado RL, Ignacio Pires SR, Pereira Dantas MJ, Zaluski PR, Frazzon EM. Forecasting scrap tires returns in closed-loop supply chains in Brazil. J Clean Prod. 2018;188:741–50. https://doi.org/10.1016/J.JCLEPRO.2018.04.026.
Fanoodi B, Malmir B, Jahantigh FF. Reducing demand uncertainty in the platelet supply chain through artificial neural networks and ARIMA models. Comput Biol Med. 2019;113:103415. https://doi.org/10.1016/J.COMPBIOMED.2019.103415.
Sharma R, Singhal P. Demand forecasting of engine oil for automotive and industrial lubricant manufacturing company using neural network. Mater Today Proc. 2019;18:2308–14. https://doi.org/10.1016/J.MATPR.2019.07.013.
Tanizaki T, Hoshino T, Shimmura T, Takenaka T. Demand forecasting in restaurants using machine learning and statistical analysis. Procedia CIRP. 2019;79:679–83. https://doi.org/10.1016/J.PROCIR.2019.02.042.
Wang C-H, Chen J-Y. Demand forecasting and financial estimation considering the interactive dynamics of semiconductor supply-chain companies. Comput Ind Eng. 2019;138:106104. https://doi.org/10.1016/J.CIE.2019.106104.
Acknowledgements
The authors are very much thankful to anonymous reviewers whose comments and suggestion were very helpful in improving the quality of the manuscript.
Funding
None.
Author information
Authors and Affiliations
Contributions
The authors contributed equally to the writing of the paper. First author conducted the literature search. Both authors read and approved the final manuscript.
Corresponding author
Ethics declarations
Ethics approval
Not applicable.
Competing interests
The authors declare no competing or conflicting interests.
Additional information
Publisher's Note
Springer Nature remains neutral with regard to jurisdictional claims in published maps and institutional affiliations.
Rights and permissions
Open Access This article is licensed under a Creative Commons Attribution 4.0 International License, which permits use, sharing, adaptation, distribution and reproduction in any medium or format, as long as you give appropriate credit to the original author(s) and the source, provide a link to the Creative Commons licence, and indicate if changes were made. The images or other third party material in this article are included in the article's Creative Commons licence, unless indicated otherwise in a credit line to the material. If material is not included in the article's Creative Commons licence and your intended use is not permitted by statutory regulation or exceeds the permitted use, you will need to obtain permission directly from the copyright holder. To view a copy of this licence, visit http://creativecommons.org/licenses/by/4.0/.
About this article

Cite this article
Seyedan, M., Mafakheri, F. Predictive big data analytics for supply chain demand forecasting: methods, applications, and research opportunities. J Big Data 7, 53 (2020). https://doi.org/10.1186/s40537-020-00329-2
Received:
Accepted:
Published:
DOI: https://doi.org/10.1186/s40537-020-00329-2